Florida International University
FIU Digital Commons
FIU Electronic Theses and Dissertations University Graduate School
11-12-2009
A Methodological Framework for Modeling
Pavement Maintenance Costs for Projects with
Performance-based Contracts
Kamalesh Panthi
Florida International University, [email protected]
Follow this and additional works at:http://digitalcommons.fiu.edu/etd
Part of theCivil Engineering Commons, and theConstruction Engineering and Management
Commons
This work is brought to you for free and open access by the University Graduate School at FIU Digital Commons. It has been accepted for inclusion in FIU Electronic Theses and Dissertations by an authorized administrator of FIU Digital Commons. For more information, please [email protected]. Recommended Citation
Panthi, Kamalesh, "A Methodological Framework for Modeling Pavement Maintenance Costs for Projects with Performance-based Contracts" (2009).FIU Electronic Theses and Dissertations.Paper 120.
UUFLORIDA INTERNATIONAL UNIVERSITY Miami, Florida
A METHODOLOGICAL FRAMEWORK FOR MODELING PAVEMENT MAINTENANCE COSTS FOR PROJECTS WITH PERFORMANCE-BASED
CONTRACTS
A dissertation submitted in partial fulfillment of the requirements for the degree of
DOCTOR OF PHILOSPHY in CIVIL ENGINEERING by Kamalesh Panthi 2009
To: Dean Amir Mirmiran choose the name of dean of your college/school
College of Engineering and Computing choose the name of your college/school
This dissertation, written by Kamalesh Panthi, and entitled A Methodological Framework for Modeling Pavement Maintenance Costs for Projects with Performance-based Contracts, having been approved in respect to style and intellectual content, is referred to you for judgment.
We have read this dissertation and recommend that it be approved.
_______________________________________ M. Emre Bayraktar _______________________________________ Arindam G. Chowdhury _______________________________________ Luis Prieto-Portar _______________________________________ Caesar Abi Shdid _______________________________________
Syed M. Ahmed, Major Professor
Date of Defense: November 12, 2009
The dissertation of Kamalesh Panthi is approved.
_______________________________________
choose the name of dean of your college/school Dean Amir Mirmiran choose the name of your college/school College of Engineering and Computing
_______________________________________ Dean George Walker University Graduate School
ACKNOWLEDGMENTS
A dissertation like this requires a great amount of sacrifice, effort, and patience by both the researcher and those around him/her. This dissertation is no different. I would therefore, like to thank everyone who directly or indirectly contributed in shaping up this dissertation work.
I would like to thank my advisory and examining committee members, Dr. M. Emre Bayraktar, Dr. Arindam G. Chowdhury, Dr. Luis Prieto-Portar, and Dr. Caesar Abi Shdid for their support and guidance throughout this research.
I wish to extend special thanks to Dr. Syed M. Ahmed, my major professor, for providing me with the opportunity to study under his guidance, and for his extra effort in helping me develop as a Ph.D. candidate. His continuous instruction, supervision and encouragement are greatly appreciated, and I shall forever remain indebted.
A special note of thanks is due to Mr. Mike Smith, Manager of Maintenance and Operations of Miami Dade Expressways Authority; Mr. Jose Quintana, Maintenance Engineer of Florida’s Turnpike Enterprise; and Mr. Jose Darsin, Senior Operations Manager of Transfield Services, for kindly agreeing to provide expert opinion on my research work.
During my time as a graduate student in the Department of Construction Management at Florida International University, I had the privilege of receiving guidance and support from Dr. Irtishad Ahmad, Chair of Construction Management Department and other faculty members for which I’m very appreciative. I’m also thankful to Dr. Salman Azhar, Mrs. Bernadette Chung, Mr. Rizwan Farooqui, and Mr. Umut Artuk for their continual support. Finally, I thank god for having given me such a wonderful and loving family
whose continual support and motivation encouraged me to achieve this highest level of education degree. I owe a lot to my wife, Rakshya, without whose patience and moral support, it would have been extremely difficult to complete this research.
Special gratitude is expressed to University Graduate School of Florida International University for providing me with the financial support in the form of a Dissertation Year Fellowship.
ABSTRACT OF THE DISSERTATION
A METHODOLOGICAL FRAMEWORK FOR MODELING PAVEMENT MAINTENANCE COSTS FOR PROJECTS WITH PERFORMANCE-BASED
CONTRACTS by
Kamalesh Panthi
Florida International University, 2009 Miami, Florida
Professor Syed M. Ahmed, Major Professor
Performance-based maintenance contracts differ significantly from material and method-based contracts that have been traditionally used to maintain roads. Road agencies around the world have moved towards a performance-based contract approach because it offers several advantages like cost saving, better budgeting certainty, better customer satisfaction with better road services and conditions. Payments for the maintenance of road are explicitly linked to the contractor successfully meeting certain clearly defined minimum performance indicators in these contracts. Quantitative
evaluation of the cost of performance-based contracts has several difficulties due to the complexity of the pavement deterioration process. Based on a probabilistic analysis of failures of achieving multiple performance criteria over the length of the contract period, an effort has been made to develop a model that is capable of estimating the cost of these performance-based contracts. One of the essential functions of such model is to predict performance of the pavement as accurately as possible. Prediction of future degradation of pavement is done using Markov Chain Process, which requires estimating transition
probabilities from previous deterioration rate for similar pavements. Transition probabilities were derived using historical pavement condition rating data, both for predicting pavement deterioration when there is no maintenance, and for predicting pavement improvement when maintenance activities are performed.
A methodological framework has been developed to estimate the cost of maintaining road based on multiple performance criteria such as crack, rut and, roughness. The application of the developed model has been demonstrated via a real case study of Miami Dade Expressways (MDX) using pavement condition rating data from Florida Department of Transportation (FDOT) for a typical performance-based asphalt pavement maintenance contract. Results indicated that the pavement performance model developed could predict the pavement deterioration quite accurately. Sensitivity analysis performed shows that the model is very responsive to even slight changes in pavement deterioration rate and performance constraints. It is expected that the use of this model will assist the highway agencies and contractors in arriving at a fair contract value for executing long term performance-based pavement maintenance works.
TABLE OF CONTENTS
CHAPTER PAGE
1. INTRODUCTION 1
1.1 Background and Motivation 1
1.2 Problem Statement 4
1.3 Research Thesis 6
1.4 Research Goals and Objectives 6
1.5 Scope 7
1.6 Summary of Methodology 8
1.6.1 Define Number of Condition States/Categories 8 1.6.2 Determine Pavement Deterioration Rate 8 1.6.3 Generate Maintenance Transition Probability Matrix 9 1.6.4 Determine Current Distribution of Pavement in Different Condition
States
10 1.6.5 Identify Treatment Costs for Each Maintenance Action 10 1.6.6 Iterate M&R Actions Using Performance Triggers 10 1.6.7 Estimate Cost Associated With a Long Term Maintenance Contract 10
1.7 Organization of Dissertation 11
1.7.1 Introduction 11
1.7.2 Literature Review 11
1.7.3 Using Historical Performance Data to Predict Pavement Deterioration and Improvement
12 1.7.4 Framework for Cost Estimation Model 12 1.7.5 Applying Methodological Framework to a Case Study 12 1.7.6 Sensitivity Analysis and Model Validation 13 1.7.7 Research Summary, Research Limitations, and Recommendations
for Future Research
13
2. LITERATURE REVIEW 14
2.1 Introduction 14
2.2 Performance-based Maintenance Contracts in Construction Industry 14 2.3 Risks in Performance-based Maintenance Contracts 19
2.4 Pavement Performance Models 24
2.5 Maintenance Strategies for Multiple Performance Criteria 32 2.6 Assessing and Estimating Costs of Maintaining Pavements within
Specified Performance Criteria 34
2.7 Conclusion 41
3. USING HISTORICAL PERFORMANCE DATA TO PREDICT PAVEMENT DETERIORATION AND IMPROVEMENT
43
3.1 Introduction 43
3.3 Generating Transition Probability Matrices from Pavement Condition Data 46 3.3.1 Data Types and Sources for Methodology Development 46
3.3.2 Pavement Condition Data 46
3.3.3 Number of Pavement Condition States 48
3.3.4 Current Pavement Condition State Vector 48 3.3.5 Transition Probabilities Estimation Using Count Proportions 50 3.3.6 Transition Probability Matrices for M&R Activities 59
3.4 Conclusion 71
4. FRAMEWORK FOR THE COST ESTIMATION MODEL 73
4.1 Introduction 73
4.2 Model Inputs 74
4.2.1 Performance Specifications 74
4.2.2 Pavement Condition 77
4.2.3 Maintenance and Repair Strategies, and Their Unit Costs 78
4.3 Pavement Deterioration Model 78
4.4 Pavement Repair Model 79
4.5 Iteration of Deterioration-Repair Process up to Analysis Period 80
4.6 Total Estimated Performance Cost 83
4.7 Conclusion 83
5. APPLYING THE METHODOLOGICAL FRAMEWORK TO A CASE STUDY: MIAMI DADE EXPRESSWAY
84
5.1 Introduction 84
5.2 Miami Dade Expressway Asset Management Contract 85
5.3 Model Inputs 88
5.3.1 Performance Specifications 88
5.3.2 Pavement Condition 93
5.3.3 Maintenance and Repair Strategies, and Their Unit Cost 97
5.4 Pavement Deterioration Model 99
5.5 Pavement Repair Model 100
5.6 Iteration of Deterioration-Repair Process 102
5.7 Total Expected Costs 113
5.8 Unit Cost Variability in Estimating Total Cost 115
5.9 Conclusion 118
6. SENSITIVITY ANALYSIS AND MODEL VALIDATION 119
6.1 Introduction 119
6.2 Models 120
6.2.1 Base Case 120
6.2.2 Sensitivity for Improved Pavement Performance 121
6.2.3 Reduced Pavement Performance 123
6.2.4 Relaxing a Performance Constraint 125
6.2.5 Restricting a Performance Constraint 126 6.2.6 Relaxing Proportion of Pavement under Threshold Limit 126
6.2.7 Restricting Proportion of Pavement under Threshold Limit 127
6.3 Model Validation 127
6.3.1 Component Model Validation 128
6.3.2 Overall Model Validation 130
6.4 Conclusion 131
7. RESEARCH SUMMARY, RESEARCH LIMITATIONS AND
RECOMMENDATIONS FOR FUTURE RESEARCH 133
7.1 Research Summary and Conclusions 133
7.2 Research Contributions 136
7.3 Research Limitations and Future Research 137
REFERENCES 141
APPENDICES 146
LIST OF TABLES
TABLE PAGE
2.1 Warranty Provisions in the U.S 17
2.2 Types of Pavement Performance Model 26
2.3 Advantages and Disadvantages of Using Different Pavement Performance Models
30
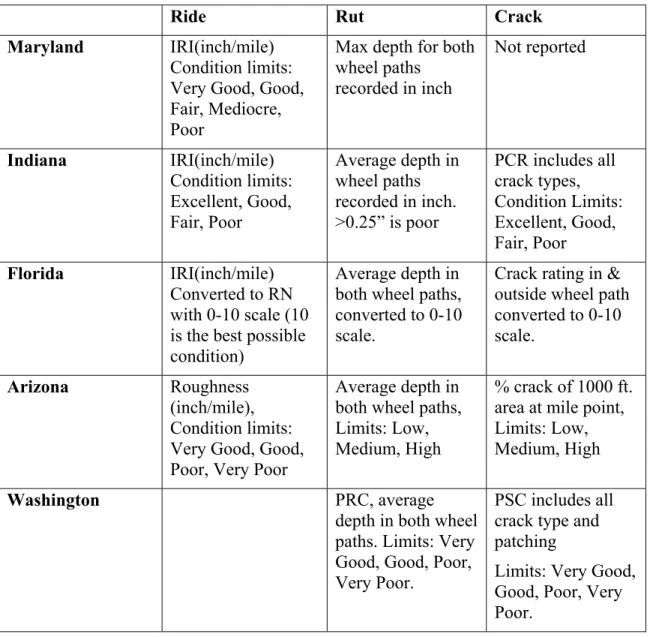
2.4 Performance Indicators and Their Measures for Different State DOTs 34 2.5 Matrix of Failures, Probabilities, Extent, and Repairs 36
2.6 Warranty Costing 36
3.1 Transition Probability Matrix 44
3.2 Data Types and Sources 46
3.3 Five-step Classification for Crack Condition States 48 3.4 Condition State Vector Using Probability Distribution of Pavement 49
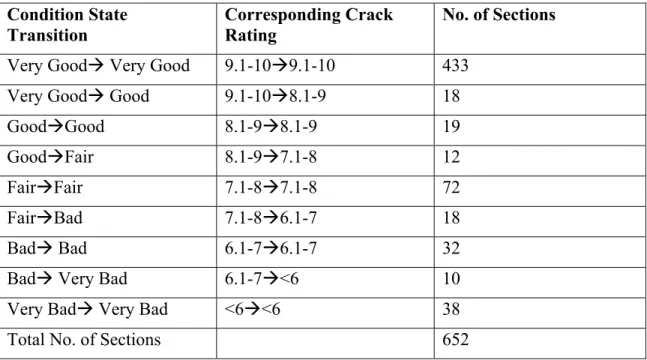
3.5 Crack Condition Rating Distribution 52
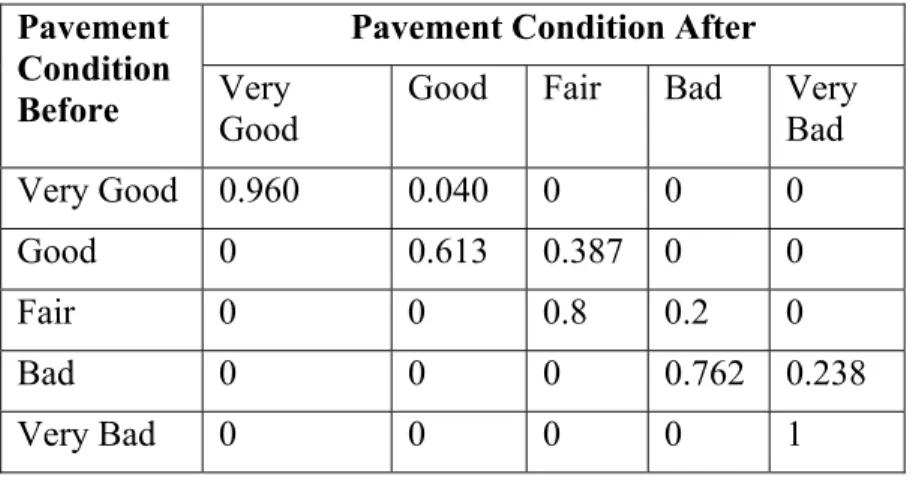
3.6 Intermediate Transition Probability Matrix for Crack 52 3.7 Transition Probability Matrix for Deterioration-Crack 53
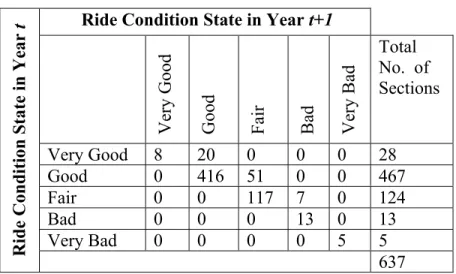
3.8 Ride Condition Rating Distribution 53
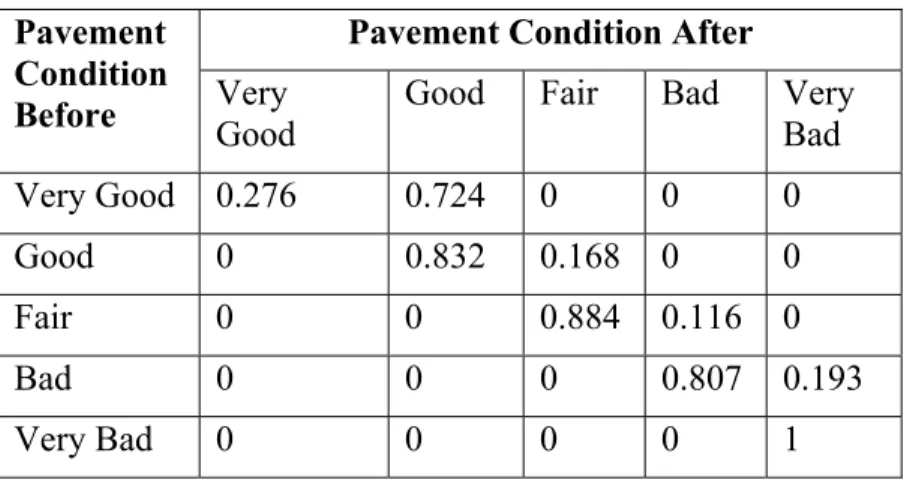
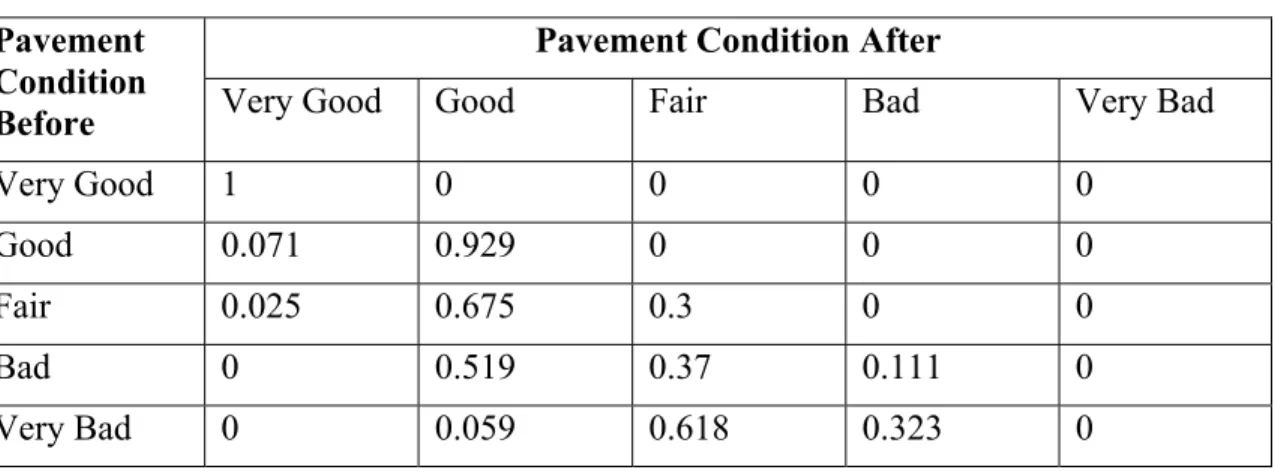
3.9 Intermediate Transition Probability Matrix for Ride 54 3.10 Transition Probability Matrix for Deterioration-Ride 54
3.11 Rut Condition Rating Distribution 54
3.12 Intermediate Transition Probability Matrix for Rut 55 3.13 Transition Probability Matrix for Deterioration-Rut 55
3.14 Standards for Low and High Volume Highways in Annual Average Daily
Traffic Volumes for Freeway-Urban 57
3.15 Transition Probability Matrix for Different Distresses for Low AADT 58
3.16 An Identity Matrix 60
3.17 Crack Condition Distribution After Resurfacing 62 3.18 Intermediate Transition Probability Matrix for Crack After Resurfacing 63 3.19 Transition Probability Matrix for Resurfacing-Crack 63 3.20 Transition Probability Matrix for Reconstruction-Crack 63 3.21 Transition Probability Matrix for Resurfacing-Ride 64 3.22 Transition Probability Matrix for Reconstruction-Ride 65 3.23 Transition Probability Matrix for Resurfacing-Rut 65 3.24 Transition Probability Matrix for Reconstruction-Rut 65 3.25 Pavement Service Index (PSI) Range for Indiana DOT Pavement Condition
Rating 66
3.26 Deriving Transition Probability Matrix for Minor Maintenance 67 3.27 Transition Probability Matrix for Minor Maintenance 67 3.28 Transition Probability Matrix for Pavement Maintenance Strategies for Crack 68 3.29 Transition Probability Matrix for Pavement Maintenance Strategies for Ride 69 3.30 Transition Probability Matrix for Maintenance Strategies for Rut 70
4.1 Standard Maintenance Strategies 82
5.1 Maintenance Elements Covered Under the Asset Management Contract 87 5.2 Distress Threshold Values and Remedial Work Specified in the FDOT
Contractor Guaranteed Asphalt Pavement (CGAP)
90
5.4 Distress Condition Rating of SR-836 (Dolphin Expressway) for Year 2008 94
5.5 Condition State Distribution for Crack 95
5.6 Condition State Distribution for Ride 95
5.7 Condition State Distribution for Rut 95
5.8 Unit Cost of Different Maintenance Treatments 99
5.9 Transition Probability Matrix for Distresses Under Pavement Deterioration
(High AADT Volume) 100
5.10 Transition Probability Matrix for Pavement Repair 101 5.11 Percentage Distribution of Condition State for Year One with Routine
Maintenance
106
5.12 Percentage Distribution of Condition State for Year One with Minor Maintenance
108
5.13 Percentage Distribution of Condition State for Year Two with Routine Maintenance
110
5.14 Program of Maintenance Works and Their Cost 113
5.15 Program of Maintenance Works and Their Cost When Major Maintenance is
Scheduled in the First Year 114
5.16 Summary Statistics of Monte Carlo Simulation on Total Cost 116 6.1 Variables and Their Range for Sensitivity Analysis 120
6.2 Variables for Sensitivity and the Base Case 121
6.3 Transition Probabilities Generated for Improved Performance (5% Less Deterioration)
122
6.4 Transition Probabilities Generated for Reduced Performance (5% More Deterioration)
LIST OF FIGURES
FIGURE PAGE
2.1 Short-term Performance Warranty Contracts 18
2.2 Long-term Performance Warranty Contracts 19
2.3 Maintenance Performance Warranty Contracts 19
2.4 Variation in Pavement Life 22
2.5 Financial Risk Due to Prediction Error of Pavement Life 23 2.6 Deterioration Curve for Past and Future Pavement Condition 25
2.7 Typical Survivor Curve 29
2.8 Timing Criteria for Formulation of Pavement M&R Strategies 32
3.1 The Transition between Two States 44
3.2 A Schematic Diagram Describing the State Transitions for a Three State Model
45
3.3 The Possible Transitions Over Two Epochs 45
3.4 Definition of Condition States for a Flexible Pavement 48 4.1 A Methodological Framework to Estimate Cost of Performance-based
Pavement Maintenance Contracts 74
4.2 Pavement Failures and Repairs 79
4.3 Flowchart for Selecting Pavement Maintenance Strategies 81
5.1 Focus Area of Case Study 85
5.2 Miami Dade Expressways Pavement Network 86
5.3 Condition Distribution of Pavement in Various Condition Ratings in Year 2008
96
5.4 An Example of Application of the Methodology to a Case Study Using
5.5 Multiplication Process to Obtain Condition State Vector for Crack in Year
One with Routine Maintenance 105
5.6 Multiplication Process to Obtain Condition State Vector for Ride in Year One with Routine Maintenance
105
5.7 Multiplication Process to Obtain Condition State Vector for Rut in Year One with Routine Maintenance
106
5.8 Multiplication Process to Obtain Condition State Vector for Crack in Year One with Minor Maintenance
107
5.9 Multiplication Process to Obtain Condition State Vector for Ride in Year One with Minor Maintenance
107
5.10 Multiplication Process to Obtain Condition State Vector for Rut in Year
One with Minor Maintenance 108
5.11 Multiplication Process to Obtain Condition State Vector for Crack in Year
Two with Routine Maintenance 109
5.12 Multiplication Process to Obtain Condition State Vector for Ride in Year Two with Routine Maintenance
109
5.13 Multiplication Process to Obtain Condition State Vector for Rut in Year Two with Routine Maintenance
110
5.14 Condition Distribution of Crack 111
5.15 Condition Distribution of Ride 111
5.16 Condition Distribution of Rut 112
5.17 Frequency Chart from Monte Carlo Simulation 117
5.18 Cumulative Frequency Chart 117
6.1 Sensitivity for Improved Performance 123
6.2 Sensitivity for Reduced Performance 125
6.3 Comparison of Predicted Crack Condition Rating 129
6.4 Comparison of Predicted Ride Condition Rating 129
LIST OF ACRONYMS AADT Average Annual Daily Traffic
AASHTO American Association of State Highway and Transportation Officials ASCE American Society of Civil Engineers
BOT Build Operate Transfer
CGAP Contractor Guaranteed Asphalt Pavement
CR Crack
DOT Department of Transportation
FDOT Florida Department of Transportation FHWA Federal Highway Administration IRI International Roughness Index KPI Key Performance Indicator LOS Level of Service
LTPP Long Term Pavement Performance MAC Managing Agent Contract
M&R Maintenance and Rehabilitation MDX Miami Dade Expressways MRP Maintenance Rating Program
OPCR Output and Performance-based Road Contracts PBC Performance Based Contacts
PCI Pavement Condition Index PDF Probability Density function PCS Pavement Condition State
PJ Performance Jump
PMMR Performance Based Management and Maintenance of Roads PMS Pavement Management System
PSI Pavement Serviceability Index
PSMC Performance Specified Maintenance Contracts RN Ride Number
ROCOF Rate of Occurrence of Failure
RU Rut
SHA State Highway Agency SR State Road
TPM Transition Probability Matrix
USDOT United States Department of Transportation WB World Bank
CHAPTER 1
INTRODUCTION 1.1 Background and Motivation
American Society of Civil Engineers (ASCE) issued its latest Report Card for America’s Infrastructure, the fourth since 1998. In its 2009 report card, the ASCE has awarded an overall grade of D for the nation’s infrastructure, and stated that the cost to bring it up to good condition has risen to $2.2 trillion (ASCE, 2009). Roadways, which comprise an essential component of the national infrastructure, received a grade of “D minus.” There is an overwhelming amount of maintenance and rehabilitation work to be done but the resources available to achieve a better standard of infrastructure facilities are too limited. In such a scenario, Department of Transportation (DOT) in many states of the US have had to take drastic cost reduction measures by increasing the efficiency and effectiveness of the way the maintenance works of roads are carried out. For example, the Florida DOT (FDOT) has been mandated to execute an employee reduction plan and examine privatization as a means of cost reduction. The percentage of FDOT maintenance work performed by private contractors was estimated to be 74% in 2003 (TRC, 2006). Department managers compared the unit costs for services such as mowing, embankment repairs, and shoulder repairs performed by employees to prices bid by private contractors and determined that in many cases private contractors were providing services at a lower unit cost than in-house employees. This allowed the FDOT to reduce its budget request for highway maintenance by $5.9 million in FY 2002–2003 (TRC, 2006).
A majority of the maintenance of the state and federal highways network currently involve material and method type specification. These specifications are based on the prescriptions of the state highway agencies as regard to type of materials and construction procedures. The construction procedure is closely supervised by client representative engineers followed by a short maintenance period. Payment to the contractor is done once the majority of the construction is completed with a certain percentage retention held pending successful completion of the construction with no defects at the end of the maintenance period. Any defects or a failure after the maintenance period is the responsibility of the agency. So, in this type of contract, a major share of risk still remains with the agency, whereas the contractors do not have to carry the burden of performance risks after the short maintenance period. With the conventional material-and method-based specification, there is a limitation on the use of new materials and innovative, unproven design and construction technologies because of the fact that there exists the risk of not achieving the required performance level. In order to transfer this risk to the contractors who have a better control over the risk of fulfilling the performance criteria in such new and unproven technologies, agencies extend this short maintenance period to a longer period so that the performance levels can be satisfactorily measured over a longer duration. These are performance-based contracts, and may also be viewed as warranty contracts that specify the output or outcome required from the finished product. When the output or outcome required from such product extends over a number of years, or when the performance is observed over an extended period of time, they become long term warranties or long term performance-based contracts. For infrastructure projects, for instance, highway projects, performance warranties for the
procurement and management of transportation infrastructure can be classified into three categories (FHWA, 2003): short term warranties, long term warranties, and maintenance warranties. Short term warranties are usually implemented to safeguard against any defects shortly after construction. Contractors are liable to rectify any damage or defect within this short period without imposing any extra cost to the highway agencies. The other form of warranty, the long term warranty, on the other hand, covers the design, construction and maintenance period even after several years post construction. This form of warranty is also known as the performance-based contract or performance-specified maintenance contract. A very similar form of warranty as that of long term warranty but that covers only the maintenance part of the constructed transportation infrastructure in use is the maintenance performance warranties. Maintenance performance warranties consider the application of preventive maintenance as well as rehabilitations and are also sometimes referred to as specified maintenance contracts or performance-based contracts (Damnjanovic, 2006). It is the intention of this study to explore this form of maintenance warranties which is often referred to as the performance-based maintenance contracts.
Performance-based contracts differ significantly from traditionally used method-based contracts for maintaining roads. In performance-method-based contracts, payments for maintaining the roads over a time period is clearly linked to the contractor successfully meeting or exceeding certain clearly defined minimum performance indicators. In traditional method-based contracts for road maintenance, highway agencies usually specify techniques, technologies, materials, and quantities of materials to be used, together with the time period for which the maintenance works should be executed. The
payments to the contractor is based on the amount of inputs (e.g. cubic meters of asphalt concrete, number of working hours) and, therefore, the cost estimation is rather straight forward. However, in performance-based contracts, evaluation of payment amount to the contractor is difficult because payments are not based on the amount of inputs. Rather, a different approach of evaluating the amount of payment for the work scheduled or done by the contractor in the performance-based contracting is necessary. When these contract values are agreed in lump sum, which is often the case, it also becomes a burden for the contractor to evaluate the fair value of these contracts so that their bid price is competitive without putting them in a peril of losing money once they get the contracts.
1.2 Problem Statement
Eventual transition from in-house maintenance practice to off-shoring of the maintenance work has in turn necessitated and brought about various contracting practices around the world and also in the United States. As evident from the discussion in the previous paragraphs, one such form of contracting is the warranty contracting. A special form of warranty contracting is the performance-based contract which is usually awarded on a long term basis, often exceeding ten years. Agreements of these contracts are complex not only because of the length of the contract durations but also because of the multiple performance criteria that these contracts have to meet. Unlike the cost estimation process in method-based contracts where the quantity of work is defined, it becomes the burden of the contracting party to estimate the cost of maintaining the road to a specified level of condition by predicting the future condition of the road. Linking performance to cost is often difficult, and it is this difficulty and uncertainty that makes the contractors more concerned about using the performance-based contracting in their
future work. One of the biggest concerns of the construction industry is the risks and liabilities posed by the use of long-term warranties. The contractor must maintain the warranted highway facilities above the required performance. Research by Bayraktar et al. (2004) indicated that the increase of bid price for such performance based contracts, or warranty projects in particular, is a function of project type and the warranty period. Short term warranties, with duration of one to three years, do not have significant impact on the cost. For warranties longer than five years, the resulting increase in the bid price varies dramatically. On average, a 5-year-warranty takes 10% of the total budget, and a 20-year warranty takes over 30% (Bayraktar et al., 2004).Contractors in many states are thus skeptical of warranty contracting. Cui et al. (2007) reported that warranty cost estimating ranked third among the main concerns in construction industry regarding warranty contracting.
Experience confirms that the only credible means of managing pavement performance is through the use of pavement modeling techniques like the pavement deterioration models (Parkman et al., 2003). However, many of the existing pavement deterioration models are mechanistic and do not take uncertainty associated with the input variables in their modeling process. A comprehensive list of controllable variables and uncontrollable factors that impact the performance of the road has been listed by Ozbek for developing a framework for measuring the efficiency of highway maintenance strategies (Ozbek, 2007) but there has been no attempt to quantify the effect of these risks on the total cost of these maintenance projects. Since the agencies specify multiple performance indicators (such as crack, rut, roughness, etc.) rather than a single performance measure, such as the pavement condition index for the pavement, it is
essential to predict the future road conditions in terms of all of these performance indicators or criteria. In its annual research needs statements, Transportation Research Board (TRB) pointed out that the maintenance level-of-service (LOS) and the budget requirements of road maintenance need more investigation. It mentions that the relationship between observed LOS and the cost necessary to achieve that LOS has been based largely on professional judgment drawn from practical experience (TRB, 2008). Given the discussion above, there is therefore a need to develop a model that can take into account the risk of achieving multiple performance criteria over an extended period of time as specified in the contract.
1.3 Research Thesis
Developing a cost estimation model for bidding purposes for long term pavement maintenance projects is quite different from developing a model for asset management purposes. When bidding, one is required to make a financial commitment on the outcomes of the model for a longer period of time, often exceeding ten years, whereas when modeling for asset management purpose the ten-year program of works is not usually required, and is often updated annually. Therefore, when modeling pavements for bidding, a different approach is required than modeling for asset management.
Research thesis: “Modeling for bidding of long-term performance-based pavement maintenance contract requires a far greater understanding of the risks associated with the bid, both financial and pavement condition related. For these reasons, a far more in-depth analysis is often required than if developing a model for purely asset management purposes. For performance-based pavement maintenance contracts, it is important to develop a model that takes into account the risk of achieving multiple performance
targets specified, which are normally not considered by the traditional methodologies for developing program of works.”
1.4 Research Goals and Objectives
The purpose of this research is to develop a model that can assist contractors and highway agencies to estimate the cost of performance-based pavement maintenance contracts, depending on the risks transferred to them by the highway agencies so that a fair value for executing the contract is obtained. Under varying contract specifications and contract durations, the risk transferred to the contractor also varies and to accurately model the cost associated with major contract risks is the primary purpose of this research. Specific objectives that will be met to achieve the research goals are:
‐ Traditional methodologies for developing program of works to meet the condition drivers are limited to a single performance criterion. This research is however, geared towards developing a model to estimate cost while meeting multiple performance criteria.
‐ When trying to quantify risks associated with such contracts it is essential to consider what-if scenarios. The second objective is to develop a model that considers what-if-scenarios for bidding purposes of these long term contracts.
1.5 Scope
The scope of this study is limited to the development of a cost estimation model. Florida Department of Transportation provided the pavement condition data used for this research. In this research, focus is directed only towards flexible pavement as rigid
pavements have different sets of performance specifications and distresses. However, the methodology used for flexible pavements can easily be adapted to suit rigid pavements and also pavements in other states with little modification.
1.6 Summary of Methodology
1.6.1 Define Number of Condition States/ Categories
Although condition states defined by the Florida Department of Transportation (FDOT) is rated on a scale of 0 to 10, for simplification purpose the condition of the distresses are reclassified into five condition states. This is done so because pavement condition ratings are spread mostly from 6 to 10. Since this research applied a five state condition model, FDOT condition rating on a scale of 1-10 is modified suitably to conform to a five-step classification of the condition states adopted in this research.
1.6.2 Determine Pavement Deterioration Rate
Pavement deterioration rate is represented by a transition matrix, the elements of which denote the change in proportion of pavement in one particular condition state to the next poor condition state in one year. Estimation of the transition matrix is a relatively straight forward process, if we can observe the sequence of states for each of the individual unit of observation. For example, if we observe the condition state of the pavement at the beginning of the year and again at end of the year, then we can estimate the probability of any pavement section moving from one condition state to another. The probability of a pavement having a particular condition state at the end of the year, (e.g. Good) given their condition state at the beginning of the year (e.g. Very Good) is given by the simple ratio of the number of pavement sections that began the year with the same condition state (Very Good) and ended with Good condition state to the total number of
pavement sections that began with a Very Good condition state. Suppose there are 100 pavement sections with a Very Good condition state at the beginning of the year, of which only 70 remain in the Very Good condition state and the remaining 30 sections degrade to next condition state Good at the end of the year, then the transition probability can be estimated using the ratio as follows:
Transition probability from Very Good (VG) to Very Good (VG) condition state is given by the proportion:
pVG,VG =70/100=0.7
Transition probability from Very Good (VG) to Good (G) condition state is given by the proportion:
pVG,G =30/100=0.3.
Transition probabilities for all other possible combinations of deterioration can be estimated in a similar manner using the count proportions obtained from historical record of condition states. Transition probability matrices are derived for three different distress indicators from the available pavement condition surveys.
1.6.3 Generate Maintenance Transition Probability Matrix
Deterioration matrix is determined by studying the transition of pavement sections going from better to worse condition state in the absence of maintenance activities. In contrast to this, transition matrix for maintenance activities is obtained by studying the transition of pavement from a worse condition state to a better condition state when different maintenance activities are applied. When performance data are available for pavements just before and after the maintenance activity, transition probability matrices for each of these maintenance actions can be determined.
1.6.4 Determine Current Distribution of Pavement in Different Condition States
Distribution of actual condition states for the entire length of the pavement under performance-based contract gives the condition state vector. The condition state vector is estimated by finding the proportion of the roadway in Very Good, Good, Fair, Bad, and Very Bad condition states. Once this initial condition state vector is determined, condition state vectors for pavement after t years can be easily calculated by multiplying this condition state vector with the deterioration matrix.
1.6.5 Identify Treatment Costs for Each Maintenance Action
In order to estimate the total cost of the performance-based contracts, it is essential to collect the unit cost of maintenance activities that are considered to be feasible for the pavement section under contract. Broad categories of pavement maintenance strategies considered in this research are routine maintenance, minor maintenance, major maintenance, and reconstruction. Cost of application of these maintenance activities per lane-mile are taken from historical maintenance cost data where available and from other related literatures for those that do not have unit cost data.
1.6.6 Iterate M&R Actions Using Performance Triggers
Depending on the initial condition of the pavement at the time of contract award, different maintenance treatments may be needed to bring the condition of the pavement to an accepted level of performance. In the iteration process, maintenance activity that requires the least overall cost to keep the pavement at the specified performance level is selected first. If this maintenance activity is unable to achieve an acceptable level of pavement performance, maintenance treatment of the next higher level is chosen. The
iteration process ensures that the pavements are at least maintained at the specified threshold level of performance.
1.6.7 Estimate Cost Associated with a Long Term Maintenance Contract
Once the overall program of maintenance actions is determined using the above steps, it then becomes easy to quantify the cost associated with these maintenance activities from the unit cost data available. These costs, which are determined for annual maintenance, are added up for the entire contract duration and for the entire pavement length under performance-based contracts. This cost should be the least among the cost obtained from different combinations of maintenance operations during iterations. This cost is then the cost of executing the pavement maintenance under performance-based contracts.
1.7 Organization of Dissertation 1.7.1 Introduction
The first chapter introduces the topic of performance-based maintenance contracts in transportation infrastructure and the need for a cost estimation methodology in the light of increasing use of this innovative contract.
1.7.2 Literature Review
The second chapter, which is the literature review, delves on the increasing use of this new contracting method and the limitations of the existing methodology to estimate the cost of these long term maintenance contracts. The literature review further investigates how the progression of body of knowledge in this research area led to the proposed methodology so as to address the problem associated with estimating the cost of performance-based contracts more systematically than the existing methodologies.
1.7.3 Using Historical Performance Data to Predict Pavement Deterioration and Improvement
The third chapter discusses how pavement performance data recorded and kept by state highway agencies can be used to predict future condition of the transportation infrastructure. In this chapter, the concept of Markov chain and transition probabilities discussed in the literature review is used to represent the change in condition distribution of the pavement as transition probability matrices. These transition probability matrices are multiplied with the condition state vector of the pavement in any one year to obtain the condition state vector of the pavement in the consecutive years. Transition probability matrices are also derived for different maintenance activities that will be used in improving the condition state of the pavement.
1.7.4 Framework for Cost Estimation Model
The fourth chapter discusses on how the methodology is developed to estimate the cost associated with performance-based maintenance contracts. The pavement is either let to deteriorate on its own (with only minimal routine maintenance) until the threshold levels of pavement performance indicators are reached and then different maintenance activities are simulated at different years so that the pavement condition never reaches below the threshold specified in the contract. Cost of providing maintenance services each year as required, is then added up to determine the total cost of the contract.
1.7.5 Applying Methodological Framework to a Case Study
The fifth chapter describes how the proposed framework can be applied to real case study problems. When pavement deterioration model and pavement improvement model are developed (Chapter 3), performance specifications from performance-based contracts
are used as inputs to determine the level of maintenance effort to meet the performance requirements. In order to achieve the performance requirements with the least maintenance effort, iteration is done for each maintenance activity until such criteria are met. This is repeated for all the years until the end of the analysis period is reached so as to obtain the program of maintenance works from which the total cost is estimated. Asphalt pavements from Miami Dade Expressways are used in the analysis to build the methodology and SR-836 (Dolphin Expressway) is used for the application purpose.
1.7.6 Sensitivity Analysis and Model Validation
The sixth chapter provides a concept of sensitivity analysis as a way of determining the risk associated with uncertainty of deterioration process, and the uncertainty of effect of changing the threshold levels. The impacts of these changes in the input of the model have on the output, which is the cost, will be demonstrated using sensitivity analysis. Quantitative and qualitative validation of the model is also performed in this chapter.
1.7.7 Research Summary, Research Limitations, and Recommendations for Future Research
The last chapter will provide a summary of the findings with conclusions derived from the findings. Based on the feedback received from the experts on the usefulness, accuracy, and flexibility of the model to estimate the long term maintenance contracts recommendations are made for future research.
CHAPTER 2
LITERATURE REVIEW 2.1 Introduction
Research in the area of long term maintenance contract is recent. The emergence of this research is attributed mainly to the increasing involvement of private sector firms in the management of these long term pavement maintenance. Body of knowledge that is present in this area is mostly focused on asset management. Available asset management models invariably revolve around life cycle maintenance cost which may not be appropriate for use by contractors who are increasingly being involved in these long term pavement maintenance works. There have been few studies and research in the area of long term maintenance contracts but much of this research is of qualitative in nature. The discussion in this chapter leads us to realize how the existing body of knowledge in this area lacks relevant literatures to quantify cost associated with long term pavement maintenance contracts with multiple performance indicators. The literature discussed in this chapter also provides foundation for the proposed methodology.
2.2 Performance–based Maintenance Contracts in Construction Industry
Performance-based contracts (PBC) differ significantly from method-based contracts that have been traditionally used to maintain roads. PBC is a type of contract in which payments for the management and maintenance of road assets are explicitly linked to the contractor successfully meeting or exceeding certain clearly defined minimum performance indicators. In traditional method-based contracts, the road agency as a client normally specifies techniques, technologies, materials and quantities of materials to be
used, together with the time period during which the maintenance works should be executed. The payment to the contractor is based on the amount of inputs (e.g., cubic meters of asphalt concrete, number of working hours). In performance-based contracting the client does not specify any method or material requirements. Instead the client specifies performance indicators that the contractor is required to meet when delivering maintenance services. For example, the contractor is not paid for the number of potholes he has patched, but for the output of his work: no pothole remaining open (or 100% patched). Failure to comply with the performance indicators or to promptly rectify revealed deficiencies adversely affects the contractor's payment through a series of clearly defined penalties. In case of compliance, the payment is regularly made, usually in equal monthly installments. PBC within the road sector can be "pure" or "hybrid". The latter combines feature of both method and performance-based contracts. Some services are paid on a unit rate basis, while others are linked to meeting performance indicators (Stankevich et al., 2005).
In some literatures PBCs are also referred to as output-based or outcome-based contracts. In the World Bank sample bidding document (World Bank, 2005), it is referred to as performance-based contract for management and maintenance of roads (PMMR). In the very latest version of the Bank’s document (World Bank, 2005) the title has been changed from PMMR to OPCR—Output-and-Performance-based Road Contracts. Performance specifications are often called "levels of service" (LOS) in some countries.
British Columbia, Canada, pioneered the use of PBC of road maintenance in 1988 which was then followed by other Canadian Provinces, Alberta and Ontario. In 1995 Australia launched its first PBC to maintain urban roads in Sydney. Since then New
South Wales, Tasmania, and Southern and Western Australia have started using performance-based and “hybrid” approaches. In 1998 a PBC was introduced in New Zealand to maintain 405 km of national roads (Zietlow, 2004). In the developing world Latin America was the pioneer in developing and adopting its own performance-based contracting model. In 1995, Argentina introduced performance-based contracts, which at present cover 44% of its national network (Liautaud, 2004). In the mid nineties Uruguay also piloted PBC, first on a small portion of its national network and then on the main urban roads of Montevideo. Shortly thereafter, other Latin American countries, such as Brazil, Chile, Colombia, Ecuador, Guatemala, Mexico and Peru, also started adopting a performance-based approach. Gradually, this trend has spread to other developed and developing countries in Europe, Africa and Asia, e.g., UK, Sweden, Finland, Netherlands, Norway, France, Estonia (63% of national roads), Serbia and Montenegro (8% of national roads), South Africa (100% of national roads), Zambia, Chad (17% of all season roads), the Philippines (231 km of national roads). At present, a PBC is referred to as a 'performance-specified maintenance contract' (PSMC) in Australia and New Zealand. A PBC is referred to as an 'Asset management contract' in the USA. PBC is referred to as a 'Managing agent contract' (MAC) in the UK, and as "Area maintenance contracts" in Finland. Preparations for launching PBC programs are underway in Albania, Cape Verde, Chad, Madagascar, Tanzania, Burkina Faso, India, Cambodia, Thailand, Indonesia, Vietnam and Yemen. Some of the above countries use “pure” performance based contracts, while others (e.g., Finland, South Africa, Serbia and Montenegro) use “hybrid” contracts (World Bank, 2005).
In 1999, the U.S. Department of Transportation (USDOT) requested highway agencies to come up with plans to convert their traditional contracts to Performance-based contracts (Tomanelli, as cited in Ozbek, 2004). DOTs within Virginia (in 1996), Florida (in 1998), Texas (in 1999), and the District of Columbia (in 2000) have been the first ones to implement performance-based contracts for the maintenance of their road and highway systems (Ozbek, 2004).
Warranty is also a form of performance-based contract that has been popularly used in the United States in the recent years (Queiroz, 1999). In warranty contracting, contractor is responsible for the post-construction risk in addition to that assumed during the construction process. In warranty contracting contractor has to ensure that the constructed infrastructure should provide the level of service (LOS) specified in the contract by the agency within the warranty period. Table 2.1 shows the states that have used warranty contracting in road construction in the US.
Table 2.1: Warranty Provisions in the U.S (Adapted from Garza et al., 2008)
North Atlantic North Central Southern Region Western Region
State Warranty Length (years) State Warranty Length (years) State Warranty Length (years) State Warranty Length (years) North
Carolina 5 Illinois 5 Florida 3 Colorado 3, 5
Virginia 3, 5 Indiana 5 Mississippi 5, 7 California 5
Michigan 5 Louisiana 3
Ohio 3, 5, 7
Wisconsin 5 Kentucky 5
Performance warranties for the procurement and management of transportation infrastructure can be classified into three categories (FHWA, 2003): short term warranties, long-term warranties, and maintenance warranties.
Short term performance warranties are warranties that are implemented as a
safeguard against the risk of latent flaws and defects, hidden in the design and construction phases. Typically they range from two to ten years after construction is completed and consider only the application of preventive maintenance actions during the coverage of the warranty. Figure 2.1 illustrates the life-cycle phases included in short-term performance warranties.
Figure 2.1: Short-term Performance Warranty Contracts
Even though short term performance warranties provide some degree of protection against poor performance, they cover only a short period of the facility’s life-cycle. To shift all the performance-related risks to the contractors, state highway agencies (SHA) can implement long term performance warranties. These warranties cover the entire life-cycle and allow for the application of both preventive maintenance and rehabilitations. The life cycle phases involved with long term performance warranties are illustrated in Figure 2.2.
Figure 2.2: Long-term Performance Warranty Contracts
In contrast to the previously discussed performance warranties that involve design and construction phases, maintenance performance warranties cover only the exploitation phase of the infrastructure life-cycle. Maintenance performance warranties consider the application of both preventive maintenance and rehabilitations and are also sometimes referred to as performance-specified maintenance contracts. Figure 2.3 shows involvement of the life-cycle phases for maintenance performance warranties.
Figure 2.3: Maintenance Performance Warranty Contracts
2.3 Risks in Performance-based Maintenance Contracts
Within the context of projects, risk is commonly associated with uncertain events or conditions that, if they occur, have positive or negative effects on the objectives of a project (Ayyub, 2003). There may be several risk areas in a construction project. For example, Zayed et al. (2002) identified eight risk areas for build-operate-transfer (BOT) projects such as financial, procurement, construction completion, and operating risks. In performance based projects, there are additional risks that a contractor may not have been exposed under standard method type contracts. These are enlisted by Owen (2000) as follows:
1. Extended maintenance periods 2. Unrealistic or too tight tolerances
3. Unproven confidence limits on specified performance values 4. Use of unproven/untried materials
5. Condition of the base layer of the road
6. Poor Quality control producing variable results
7. Communication between parties and clear understanding of the philosophy and principles of a performance specification
8. Method of measurement, variability between testing agencies 9. Assessment of failure and resultant proportional payment
Sensitivity analysis can be used to test the effects of these risks on the overall cost of the project. However, a major risk in the performance-based maintenance contract is the risk associated with the failure of the product to meet the performance requirements during the performance period. Once the economic consequence of failure, for which the contractor is liable, is quantified it then allows the owner and the contractor to trade-off the product performance risk with the contract price.
In understanding the risks in the performance-based long term pavement maintenance contracts it becomes essential to identify and understand the factors that affect pavement performance and service life. This is because whatever the extra cost is associated with unforeseen maintenance and rehabilitation of pavement projects comes from inaccuracies in estimation of the service life of the pavement. If for some reason one of the critical variables impacting pavement deterioration rate is not considered in estimating the pavement service life, the consequence would be that the pavement would deteriorate at a
faster rate than what was designed and expected by the contractor. Ultimately the contractor has to absorb the cost of maintaining the prematurely deteriorated pavement because of the lack of foresightedness in identifying the risk variable.
Not only is it important to identify all the risk variables impacting the deterioration rate of the pavement, it is also very important to understand the key performance indicators or level of service (LOS) that are required by the highway agencies. Pavement modeling on long term contracts is critical in terms of understanding the financial cost of maintaining key performance indicators (KPI’s) at a particular level and it is a very high risk area if the modeling predictions are not right (Keir & Blerk, 2006). Ozbek (2004) emphasizes this fact and has developed a warranty clause template for the performance-based road maintenance contract with an aim to reduce the risk imposed on the contractors.
In performance-based maintenance contracts risk is shifted to the party who has more control over the project. Since a contractor has more control over the project and, therefore, the risks, the contractor has to bear the risk of failure of the project. There is a wealth of research in the area of risk management for new projects but there are very few for the maintenance projects under the performance-based environment. The risks that were earlier assumed by the agencies in pavement maintenance projects under traditional contracts now fall under contractors’ responsibility in the performance-based contracts. There is a dearth of literature in the area of performance-based maintenance risks borne by the contractors. Most of the literatures discussing risks in performance-based maintenance contracts are subjective in nature focusing largely on the opportunities and importance of managing risk. Kostuk (2003) points this shortcoming and states that
Gallagher and Mangan (1998) were the first to directly address risk in the context of long term maintenance contracts but that too without any methodology to quantify the risk. Gallagher and Mangan (1998) identified that the key to success in managing the risk associated with long term maintenance contracts, is to be able to measure the condition state of the asset at the time the contract is awarded and in the future.
Cost estimation of pavement maintenance for long term contracts involves the evaluation of future funding requirements that will maintain the highway system at a desirable level meeting the performance criteria. The development of appropriate program of works relies heavily on the ability to accurately predict future needs and then to select effective courses of action to meet these needs. A vast majority of the models developed for financial planning have focused on the expected or average future performance of pavements. Risk associated with the expected performance is often ignored. This risk component can be captured in the form of variation in pavement life. Actual remaining life of the pavement is random and may be close to or far from the average as shown in Figure 2.4 and Figure 2.5.
Figure 2.4: Variation in Pavement Life
Age Critical PCI Average Life Short Life Long Life PCI New
The impact of such variations is demonstrated by a simple example as pointed out by Kazakov and Cook (1988). If for example, cost of rehabilitation of total pavement network is $1 Billion with a predicted life expectancy of the network to be 14 years. Then within this period, 1/14th of network will be maintained each year at cost of $71.4 Million. However, if the actual life of the pavement is 15 years, then 1/15th of network is maintained each year at cost of $66.7 Million. There is a prediction error of $4.7 Million/year. PCI Age Critical PC I Prediction Error L=14 L=15 New
Figure 2.5: Financial Risk Due to Prediction Error of Pavement Life
As discussed, life cycle of a pavement is a random variable and, therefore, contains risk elements. Risk is introduced not only due to the fact that the life of the pavement is random and, therefore, an uncertain event, risk is also introduced because of the threshold level of performance criteria specified in the contract. For instance, if the critical PCI level in Figure 2.5 is raised or lowered the life of the pavement is consequently reduced or increased respectively. Therefore, the tolerance level of performance specification, critical PCI level in this case, also introduces risk in the estimation of maintenance cost of
pavement. Although, theoretically, the entire network of pavement may be maintained to meet the critical PCI level, this will create an extra financial burden on the highway agency. Therefore, it may be assumed that a nominal proportion of the entire pavement network may be allowed below the accepted level of PCI without significantly impacting the LOS. This nominal percentage may vary with different highway agencies and for different categories of road. This also introduces another risk component in the estimation of performance-based pavement maintenance contracts.
2.4 Pavement Performance Models
It has been emphasized in the previous section that the best way of managing the risk associated with long term maintenance contracts is to be able to measure the present and the future condition state of the asset. The main purpose of pavement performance models is to predict future condition state when its present condition state is known. Various types of distresses, such as roughness, rut, crack, etc, or indices based on combinations of such distresses, can be used as input for these models. Pavement Management Systems (PMS) require accurate and efficient pavement performance prediction models. Pavement performance analysis is a primary form of engineering application of PMS database to determine the effects on pavement deterioration. Engineering analysis is performed to quantify these effects and develop mathematical models that predict pavement performance over time. These performance models are required in order to estimate the needs and timing of maintenance of the sections in a pavement network. Figure 2.6 below is an illustration of how deterioration prediction would be applied to an existing pavement section to estimate the rate of future
deterioration, and the “needs year”. Additionally, it illustrates the application of the deterioration model to rehabilitation alternatives applied in the needs year.
Minimum Acceptable Measure of
Deterioration
(e.g., PSI) Past
Deterioration Prediction of Future Deterioration j k Needs Year Now Time of Construction Remaining Initial Service Life i Maintenance Alternatives
Figure 2.6: Deterioration Curve for Past and Future Pavement Condition (Adapted from Federal Highway Administration, 2002)
A classification of prediction models has been suggested by Mahoney (1990), based on earlier work by Lytton (1987). Pavement performance models can either be deterministic or probabilistic. Deterministic models predict average values of pavement performance measures. In contrast, probabilistic models can predict averages as well as distributions of these measures. Most deterministic models are mechanistic or empirical. They include primary response, structural performance, functional performance, and damage models (FHWA, 2002; Mbwana, 1996; Mahoney, 1990).Examples of stochastic models include survival curves and Markov process models. Different types of performance models are summarized in Table 2.2.
Table 2.2: Types of Pavement Performance Model (Adapted from Mahoney, 1990) Deterministic Probabilistic Transition Process Models Primary Response Deflection Stress Strain Etc. Structural Distress Pavement Condition Functional PSI Safety Etc. Damage Load Equivalent Survivor Curves Markov Semi- Markov
The following paragraphs discuss stochastic or probabilistic models as they are more suited to model the uncertain behavior of pavements. Stochastic modeling of pavement performance is the most appropriate one because many factors responsible for pavement deterioration such as traffic loading, pavement materials, construction methods, and weather, are not deterministic (Mbwana, 1993). Many probabilistic or stochastic models have been developed in order to characterize the uncertain behavior of pavement deterioration processes. These previously-developed probabilistic models can be summarized into two categories: state-based Markov Chain models, and time-based reliability analysis (Haas et al., 1994; Cook and Lytton, 1987). Most state DOTs keep a record of historical database of condition state of pavements. These condition states are usually expressed in discrete scale, e.g., 1 to 5, 1-10, 1-100, and so on. This discrete representation favors the use of discrete state Markov models to characterize pavement deterioration process. Such models are based on transition probabilities that capture the nature of the evolution of condition states from one discrete time point to the next. Transition probabilities can be obtained by observing the performance of a large number of pavements over a long period of time. Following Markovian chain method, pavement
condition state at time t, PCS (t), of the pavement at any stage, t, can be calculated from the initial condition state vector PCS (0) as:
PCS (1) = P1 x PCS (0)
PCS (2) = P2 x PCS (1) = P2 x P1 x PCS (0) PCS (t) = Pt x PCS (t-1) = Pt x Pt-1....P1 x PCS (0)
where, Pt is the transition probability matrix at stage t and PCS (t) is the condition vector at stage t. PCS refers to the pavement condition states, such as serviceability index, pavement condition index, etc., suitably scaled for quantitative analysis. If a scale of 1-5 is used where 5 and 1 represent the best and the worst condition respectively, PCS (2) which is the condition vector at stage 2 can be typically expressed as {0.4, 0.3, 0.2, 0.1, 0.0}, where the elements of the vector represent the percentage of pavement section in five condition states (1 to 5) for PCS level from 1 to 5. Generally, stages are considered as series of consecutive periods of one year. A Markov transition process can be either homogeneous or non homogeneous. In homogeneous transition, variables such as, traffic load, environmental conditions, sub-grade strength, etc., are considered constant over the entire analysis period, and for this reason the probability matrix (P) remains unchanged at all stages. For all practical applications in pavement management, non-homogeneous models are commonly used. Golabi et al. (1982) proved the effectiveness of applying a homogeneous Markov Chain process. Markov-Chain models are used for predicting the performance deterioration of infrastructure facilities because of their ability to capture the time dependence and uncertainty of the deterioration process, maintenance operations, and initial condition as well as their practicality for network level analysis (Morcous and Lounis, 2005).
Semi-Markov models on the other hand are developed using available data and judgment/experience of the pavement experts. The main advantage of this type of model is the use of subjective inputs which reduce large requirement of field data.
Survivor curves (also known as mortality curves), another method of performance modeling, were developed in the actuarial process. They have been used extensively in the utility industry. Insurance companies use these curves to determine insurance premium values. The use of survivor curves in assessing pavement service life started in 1934. A survivor curve as defined by Winfrey is "the curve that shows the number of units of a given group which are surviving in service at given ages (Winfrey, 1967). The ordinates of the curve give at any particular age the percentage (or the actual number) of the original number which are yet surviving in service. The abscissa is measured in years or other suitable service unit" (Winfrey, 1967). The number of units surviving is generally expressed in percentage. The area under the curve divided by 100 (if units are expressed in percentage) gives the average service life of the units. Survivor curve gives the probable life of units at any particular age. The area under the curve to the right of the vertical line drawn at any age gives the service remaining at that age. The expectancy of remaining life at any age can be computed by dividing the service remaining by the number of units surviving at that age. The probable average life at any age can be obtained by adding the expectancy to the age for which the expectancy is computed. Considerable error may be found in the estimate of life expectancy if retirement data of small group of units are used. However, the probability of error can be reduced if adequate representative data is used and service conditions are evaluated by the experts. A typical survivor curve is shown in Figure 2.7.
Figure 2.7 : Typical Survivor Curve Percentage Surviving Probable Life Expectancy Average Life Age, Years Survivor Curve Probablelife Curve
An application of survivor curves for the determination of pavement service life is explained by Gharibeh and Darter (2003). Prozzi and Madanat (2000) applied survival analysis to reanalyze the AASHTO road test data and stated that the survival model is more appealing than the original AASHTO formulations. Wang et al. (1994) conducted survival analysis on the development patterns of fatigue crack using flexible pavement test data of the Long-Term Pavement Performance (LTPP) program.
A survivor curve can be modeled using the following mathematical form:
PS = 1 – e AGE where, PS = probability of surviving e = base of natural logarithm
= a coefficient to control life of the curve AGE = age of pavement
= a coefficient to control the shape of the curve
Types of performance models which may be used at different level of pavement management are summarized in Table 2.3.
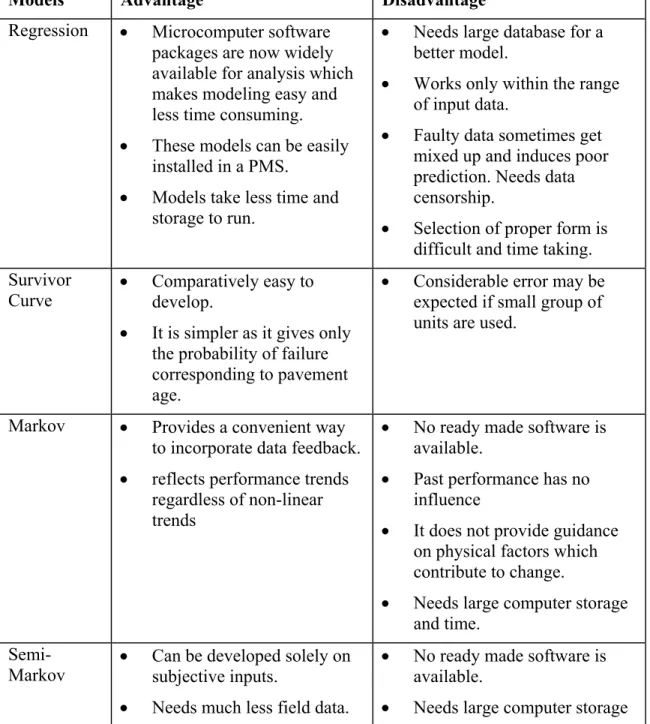
Table 2.3: Advantages and Disadvantages of Using Different Pavement Performance Models (Adapted from FHWA, 1990)
Models Advantage Disadvantage
Regression Microcomputer software packages are now widely available for analysis which makes modeling easy and less time consuming.
These models can be easily installed in a PMS.
Models take less time and storage to run.
Needs large database for a better model.
Works only within the range of input data.
Faulty data sometimes get mixed up and induces poor prediction. Needs data censorship.
Selection of proper form is difficult and time taking. Survivor
Curve Comparatively easy to develop.
It is simpler as it gives only the probability of failure corresponding to pavement age.
Considerable error may be expected if small group of units are used.
Markov Provides a convenient way to incorporate data feedback.
reflects performance trends regardless of non-linear trends
No ready made software is available.
Past performance has no influence
It does not provide guidance on physical factors which contribute to change.
Needs large computer storage and time.
Semi-Markov Can be developed solely on subjective inputs.
Needs much less field data.
No ready made software is available.
Provides a convenient way to incorporate data feedback.
Past performance can be used
Mechanistic Prediction is based on cause-and-effect relationship, hence gives the best result.
Needs maximum computer power, storage and time.
Uses large number of variables (e.g. material properties, environment conditions, geometric elements, loading characteristics etc.).
Predicts only basic material responses
Mechanistic-empirical Primarily based on cause-and-effect relationship, hence its prediction is better.
Easy to work with the final empirical model.
Needs less computer power and time.
Depends on field data for the development of empirical model.
Does not lend itself to subjective inputs.
Works within a fixed domain of independent variable.
Generally works with large number of input variables (material properties, environment conditions, geometric elements, etc.) which are often not available in a PMS.
Bayesian Can be developed from past experience and limited field data.
Simpler than Markov and Semi-Markov models.
Can be suitably enhanced using feedback data.
May not consider mechanistic behavior.
Improper judgment can lead to erroneous model.
2.5 Maintenance Strategies for Multiple Performance Criteria
Maintenance strategies may consist of activities whose timings can be based on pre-defined intervals of time or usage, or condition triggers as shown in Figure 2.8.
Pre-defined Condition Triggers Regular Intervals Irregular Intervals Aggregate Measures Disaggregate Measures Load-based (Accumulated Weather-based (Accumulated Weather Severity) Time-based (Age) Maintenance
for each pavement type
Figure 2.8: Timing Criteria for Formulation of Pavement M&R Strategies (Adapted from Lamptey et al., 2005)
Maintenance activities planned at predefined intervals may be regular or irregular. These intervals may further be based on time, accumulated load, and accumulated weather. On the other hand, maintenance activities based on condition triggers, a specific treatment activity is undertaken anytime a selected measure of pavement condition reaches a certain threshold value. The measure of pavement condition may be aggregate or disaggregate, meaning that either a single composite performance index may be used,