Impact of Carbon Pricing on Voluntary Environmental
Disclosures of Electricity Generating Sector: A Multi
Country Analysis
A thesis submitted
in fulfilment of the requirements for the degree of Master of Business
Sohanur Rahman
MBA (AIS) University of Dhaka, Bangladesh BBA (AIS) University of Dhaka, Bangladesh
School of Accounting College of Business
RMIT University June 2018
i
Declaration
I, Sohanur Rahman, certify that the work completed is mine alone, that this documenthas not been submitted for qualifications at any other academic institution, that the content of this thesis is the result of work which has been carried out since the officialcommencement date of the approved research program, that any editorial work undertaken by a third party is acknowledged, and relevant procedures and guidelines have been followed.
Sohanur Rahman June, 2018
ii
Acknowledgements
First of all, I am grateful to almighty Allah who has sent me here on earth to learn and grow and blessed me in so many ways through special people who are an inseparable part of my life.
I wish to offer my deepest gratitude to both of my supervisors, Dr. Tehmina Khan and Dr. Pavithra Siriwardhane. This project could not have been accomplished without their valuable input and proper guidance. I am deeply appreciative for the excellent direction and support I have received from them throughout this entire process. Since the very beginning, they have been monitoring my progress and giving advice on both thesis and personal matters. It has been my privilege to have them as my supervisors and mentors.
I would also like to thank Dr. Prem Yapa, PhD coordinator, School of Accounting, for his support throughout my candidature. Many thanks are also due to the School of Accounting research staff and other RMIT staff for their guidance and cooperation in making my journey at RMIT smoother.
I am grateful to my distinguished colleagues in the research lab at RMIT who were always very kind and friendly while helping and motivating me in every critical situation at different stages throughout my research work at RMIT. It would be impossible to list all the outstanding individuals who I have met here. I specially want to mention the name of Tinh and Lalitha for their unconditional support and assistance. I also thank all of my friends in Bangladesh and Australia.
I was fortunate to receive a considerable amount of valuable feedback from examiners, academic journal reviewers, discussants and audiences in conferences I attended. Their comments and suggestions assisted me to improvise my thesis and other publication works.
Finally, I wish to express my heartfelt gratitude to my father, mother and younger brother for their unconditional love and support. I am grateful to my wife, Mumtaheena Anwar, for providing me with friendship and an extraordinary level of support, encouragement and understanding during this endeavour. They all made my journey enjoyable. I dedicate this thesis to them.
iii
Thesis Related Research Outcomes
Refereed Conference Papers
Rahman, S., Khan, T. and Siriwardhane, P., 2018, ‘Impact of the non-government guidance on the voluntary environmental disclosures of EU electricity companies’, 41st Annual Congress of the European Accounting Association (EAA, Milan, Italy) 30 May – 1 June.
iv
Table of Contents
Declaration ………... i
Acknowledgements ………... ii
Thesis Related Research Outcomes ……… iii
Table of Contents ……….. iv
List of Tables ……….. vii
List of Figures ……… vii
List of Graphs ……… vii
Abbreviation ………... viii
Abstract ………... ix
Chapter One: Introduction 1.1 Introduction ……… 1
1.2 Background and rationale for the research ………. 1
1.3 Research objectives ……… 3
1.4 Research questions ………. 4
1.5 Overview of methodology and methods ……….. 4
1.6 Organisation of the remaining chapters ……… 6
1.7 Structure of the research 7 Chapter Two: Emergence of Carbon Pricing as an Emissions Reduction Strategy 2.1 Introduction ……… 9
2.2 Emissions: Causes and effects ……….. 9
2.3 Carbon/ GHG emissions as a major concern for the environment ………….. 11
2.3.1 Impact of carbon emissions around the world ……… 12
2.3.2 Carbon emissions by different sectors ………. 13
2.3.3 Electricity generating sector and carbon emissions ……….. 15
2.4 Carbon emissions pricing mechanisms ……… 19
2.4.1 Carbon tax ……… 20
2.4.2 Emissions trading scheme ………. 21
2.4.3 Carbon pricing and reduction of emissions ………. 23
v
2.6 Chapter conclusion ……….. 27
Chapter Three: Literature Review 3.1 Introduction ……… 28
3.2 Environmental accounting: An overview ………... 28
3.2.1 Environmental management accounting ……….. 30
3.2.2 External environmental reporting and disclosures ………. 31
3.3 Environmental reporting and voluntary environmental disclosures ………….. 31
3.3.1 Prior research on voluntary environmental disclosures ………. 31
3.3.2 National or International environmental policy and Voluntary environmental disclosures ……….. 34
3.4 Carbon pricing and voluntary reporting of the organizations ………. 36
3.4.1 Carbon pricing and voluntary environmental disclosures ………….. 38
3.5 Voluntary environmental disclosures by the Electricity generating sector ….. 40
3.6 Research contribution to literature ………. 42
3.7 Chapter conclusion ………... 43
Chapter Four: Theoretical Perspectives Underpinning the Research 4.1 Introduction ……… 44
4.2 Legitimacy theory ……… 45
4.2.1 Strategic legitimacy theory ………. 47
4.2.2 Institutional legitimacy theory ……… 47
4.2.3 Legitimacy theory applied in environmental accounting/reporting literature ……… 48 4.3 Institutional theory ……… 49 4.3.1 Institutional isomorphism ……… 51 4.3.1.1 Coercive isomorphism ……… 52 4.3.1.2 Mimetic isomorphism ……….. 53 4.3.1.3 Normative isomorphism ………. 54
4.3.2 Institutional theory applied in environmental accounting/reporting literature ……… 54
4.4 Justification of the theories underpinning the current research ……… 55
4.5 Conclusion ………. 57
Chapter Five: Methodology of the study 5.1 Introduction ……… 58
vi
5.2 Related research and hypotheses development ………. 58
5.3 Data collection and method ……… 62
5.3.1 Selection of countries ………... 63
5.3.2 Selection of companies ……… 64
5.3.3 Method ……… 65
5.3.3.1 GRI framework-basis of the dependent variable ………. 66
5.4 Empirical models and variable definitions ……… 68
5.5 Chapter Conclusion ……….. 73
Chapter Six: Carbon Pricing Mechanism – Impact on Quantity and Quality of VED: Analysis and Findings 6.1 Introduction ……… 74
6.2. Descriptive statistics ……… 74
6.3 Results – quantity of voluntary environmental disclosures ……… 76
6.3.1 Testing assumptions of linear regression analysis ………. 76
6.3.2 Correlation statistics ……….. 78
6.3.3 Multiple linear regression analysis ……….. 79
6.4 Results – quality of voluntary environmental disclosures ……….. 81
6.4.1 Testing assumptions of linear regression analysis ……….. 81
6.4.2 Correlation statistics ……….. 83
6.4.3 Multiple linear regression analysis ……….. 84
6.5 Conclusion ………. 85
Chapter Seven: Discussion and Conclusion 7.1 Introduction ……… 87
7.2 Discussion ………. 87
7.3 Conclusion ………. 92
7.4 Contributions of the research ………. 94
7.5 Research limitations ………. 95
7.6 Suggestions for future research ………. 96
Bibliography ………... 97
Appendix A ………. x
Appendix B ………. xii
vii
List of Tables
Table 2.1 Carbon emissions by electricity generating sector of each country
18 Table 2.2 National greenhouse gas inventory data of selected carbon
pricing countries
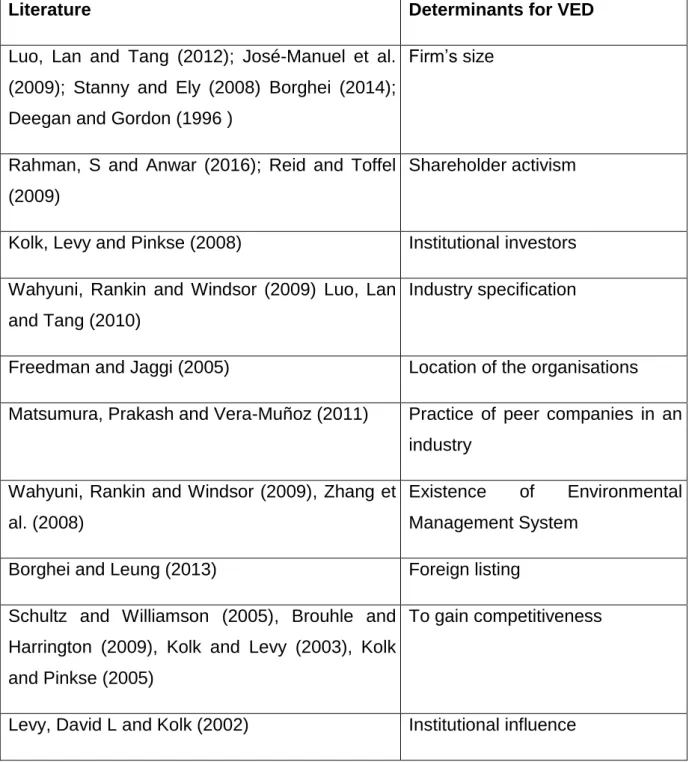
25 Table 3.1 Summary of prior literature on determinants for VED 32 Table 3.2 Summary of prior literature on VED of electricity generating
companies
41 Table 5.1 List of carbon pricing and non-carbon pricing countries 64 Table 5.2 Prior studies which used global reporting initiative guidelines to develop indices
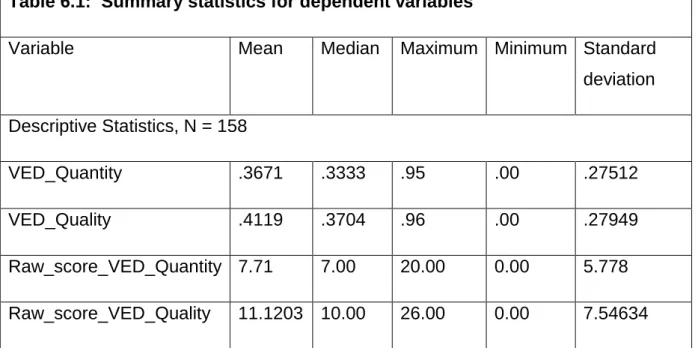
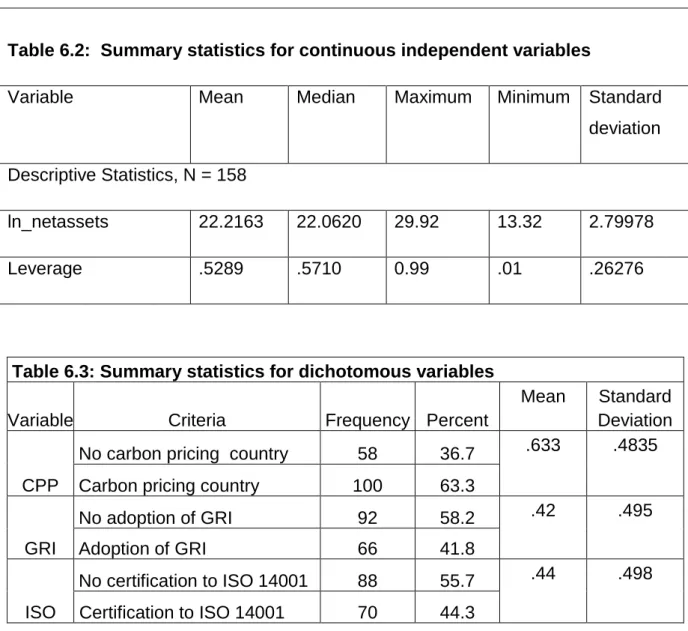
67 Table 6.1 Summary statistics for dependent variables 75 Table 6.2 Summary statistics for continuous independent variables 76 Table 6.3 Summary statistics for dichotomous variables 76 Table 6.4 Results of multicollinearity Test 78 Table 6.5: Correlation statistics for dependent and independent variables 79
Table 6.6: Regression results 80
Table 6.7: Correlation statistics for dependent and independent variables 83
Table 6.8: Regression results 85
List of Figures
Figure 1.1: Research structure 8
Figure 2.1 Global greenhouse gas emissions by gas 10 Figure 2.2 Global emissions by different sectors 14 Figure 2.3 Power consumption by electricity generating sector 16 Figure 4.1 Broad classification of theoretical framework 45 Figure 4.2 Theoretical perspectives underpinning the current study 56
List of Graphs
Graph 6.1 Normal p- plot regression standardized residual 77
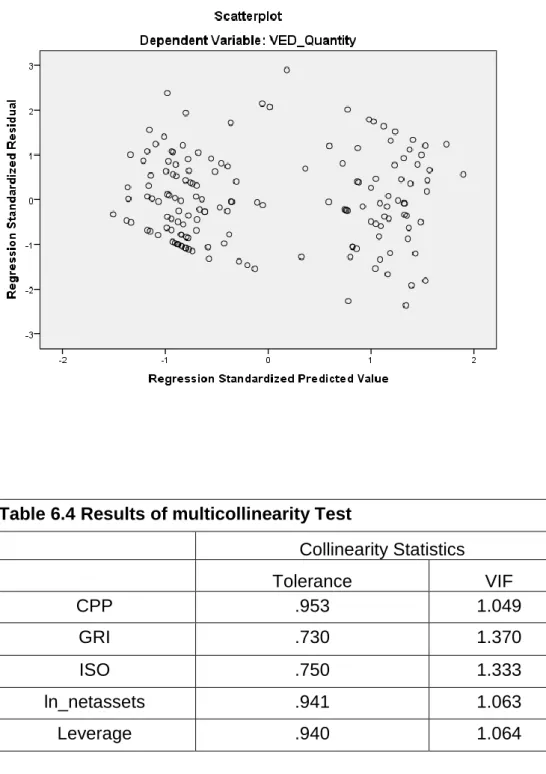
Graph 6.2 Scatterplot 78
Graph 6.3 Normal p- plot regression standardized residual 82
viii
Abbreviations
AAA American Accounting Association
AICPA American Institute of Certified Public Accountants EEA European Environment Agency
EMS Environmental Management System EPA Environmental Protection Agency ETS Emissions Trading Scheme
EU European Union GHG Greenhouse Gases GRI Global Reporting Initiative IEA International Energy Agency
IPCC Intergovernmental Panel on Climate Change ISO International Organization for Standardization NPI National Pollutant Inventory
UNEP United Nations Environment Programme
UNFCC United Nations Framework Convention on Climate Change VED Voluntary Environmental Disclosures
ix
Abstract
The electricity generating sector is one of the highest carbon emitting sectors in the world. In accordance with legitimacy theory, sectors with higher emissions undertake a greater amount of voluntary environmental reporting. According to institutional theory, carbon pricing such as carbon tax or emissions trading scheme, as an institutional setting in the form of soft law, has an indirect impact on voluntary environmental reporting. The aim in this project is to identify the impact of carbon pricing along with GRI and ISO adoption on the voluntary environmental disclosures (VED) of electricity generating companies, segregating the companies from carbon pricing countries (e.g. Italy, Belgium, Japan etc.) and non-carbon pricing countries (e.g. Turkey, Brazil, Vietnam etc.). Few studies have considered the impact of carbon pricing on VED and this study adds to the growing literature about the impact of factors such as carbon pricing on VED.
Secondary data was collected from the 2015 annual reports or standalone sustainability reports of electricity generating companies from 53 countries around the world. Content analysis approach was adopted for measuring the extent of the quantity and quality of VED. This quantitative study used two separate indices, based on Global Reporting Initiative (GRI) guidelines for quantity and quality measurement adopted from prior studies, with some modification to align it with G4 Sustainability Reporting Guidelines.
The findings of the multiple regression analysis in SPSS suggest that there is an institutional impact of carbon pricing on the quantity and quality of VED along with the institutional impact of non-government guidance of GRI or ISO. This study also finds that VED is affected by the company size where this study finds no significant relationship of leverage with VED.
A key conclusion from this study is that due to the indirect coercive pressure of government carbon pricing policies, organisations try to legitimise their environmental actions through VED. Moreover, quantity and quality of VED are influenced by management decisions regarding the adoption of GRI guidelines for external reporting or certification to ISO 14001 for a better environmental management system (EMS).
1
Chapter One: Introduction
1.1 Introduction
Global climate change is occurring at a rapid pace with potential for serious impacts in recent years around the world. These impacts include rising sea levels, global warming, depletion of forest coverage, reduced availability of clean drinking water, to mention a few. Minimising global warming, climate change and their related impacts is a major concern for the international community. There are different types of initiatives in different parts of the world to combat global climate change and carbon pricing is one them. Carbon pricing mechanisms trigger carbon emissions reduction by imposing a price on carbon emissions including those of the Business sector. This sector is responsible for more than 50% of global carbon emissions (Intergovernmental Panel on Climate Change (IPCC) 2014). As far as Business is concerned, the electricity generating sector is one of the most emitting sectors due to the massive use of fossil fuels compared to other sectors. Voluntary environmental reporting is a critical mechanism for transparency in the impacts of business activities relating to climate change. Thus, the current study investigates the impact of carbon pricing on the voluntary environmental disclosures of the electricity generating sector. This study first identifies the voluntary environmental disclosures of companies from 53 selected countries, using a wide range of 2015 annual reports. Differences in voluntary environmental disclosure patterns are examined, focusing on companies selected from carbon pricing countries and companies from non-carbon pricing countries. The impact of non-carbon pricing is analysed. This study is an attempt to enrich the knowledge and prevailing literature on the unexplored area of indirect impact of carbon pricing (which is a regulation for carbon emissions not disclosures) on the voluntary environmental disclosures of companies around the world.
1.2 Background and rationale for the research
In accordance with the Intergovernmental Panel on Climate Change (IPCC) (2007), scientific evidence for warming of the climate system is unequivocal. The world communities‟ concerns for global warming, or massive climate change, can be exemplified by the recent data provided by NASA on their official website. NASA
2 (2018b) mentions that global carbon dioxide levels in the air are at their highest compared to past years. Sixteen of the seventeen warmest years have been recorded just since 2001, while 2016 was the warmest year of all time (NASA 2018a). Earth‟s polar ice sheets are melting at an alarming rate (286 Gigatonnes per year) resulting in rise of sea level 3.4 millimetres per year.
If the emissions level continues to increase at the current level, the Intergovernmental Panel on Climate Change (IPCC) forecasts a temperature increase of 2.5 to 10 degrees Fahrenheit over the next century (Intergovernmental Panel on Climate Change (IPCC) 2014).
The IPCC mentions, in its fifth assessment report, that the reason behind the global climate change or global temperature rise is the human expansion of the “greenhouse effect”. Greenhouse Gases (GHG) or carbon emissions are the major contributors to global climate change where carbon occupies 92% of GHG (this study uses the terms GHG emissions and carbon emissions interchangeably). Use of fossil fuels, such as coal or oil, is one of major contributors to these global emissions. Over the last century, burning of fossil fuel has increased the greenhouse gas concentration in the atmosphere dramatically.
Over the last few decades, key initiatives such as the Kyoto protocol, 1992; Paris agreement, 2015, have been undertaken by the international community to minimise global climate change. Many different countries or regions have also introduced different mechanisms to reduce their emissions. Carbon pricing is one of the most important mechanisms introduced by different countries/regions to reduce emissions. Pricing carbon gives an economic signal to polluters to decide for themselves whether to reduce emissions, discontinue their polluting activity, or continue polluting and pay for it (World Bank 2014a). So, carbon pricing is a process to convert the concern for environment protection into economic action.
The electricity generating sector accounts for the largest share of global anthropogenic GHG emissions, which accounts for 42% of total emissions (IEA 2016c). Although there is a move toward renewable sources of energy for electricity generation, organisations of many countries still use fossil fuel as the prime source of energy for electricity generation. This sector is subject to many different types of
3 policies and actions. Different policies and actions adopted to tackle global climate change have accounting and reporting implications which deserve further research by accounting academics (Bebbington & Larrinaga-Gonzalez 2008). As a result, this study focuses on this sector for examining the impact of carbon pricing on the voluntary environmental disclosures.
There is an assumption that the carbon pricing mechanism (a form of government regulation for carbon emissions but not for reporting) exerts indirect pressure on the reporting of companies, according to the coercive isomorphism branch of institutional theory (Scott 1987). This assumption may not hold under all circumstances (Freedman & Jaggi 2005). As this is a critical assumption with major implications, it requires a detailed investigation, which is the main purpose of this study.
When regulations require organisations to disclose carbon emissions data to the state/government, and subsequently this information becomes public, organisations also provide more disclosures voluntarily as a result, to legitimize their actions (Liu et al. 2017). Voluntary environmental disclosures (VED) are the means of symbolic representation of legitimacy (Guthrie & Parker 1989). The attainment of legitimacy is also a critical issue for business, as legitimacy is a relative concept and function of time and place where the entity operates, which is very dynamic in nature and ever changing (Deegan 2009; Suchman 1995).
This study uses the Global reporting initiatives guidelines (G4 guidelines) as a measurement tool for investigating the degree of voluntary environmental disclosures by electricity generating companies. The two opposing notions are investigated as a significant problem: GRI as a legitimacy tool; and GRI as an effective tool to demonstrate environmental performances.
1.3 Research objectives
The aim of this study is to analyse the differences between voluntary disclosures of the electricity generating sector from carbon pricing and non-carbon pricing countries. To achieve this aim the study fulfils the following five objectives:
4 1. To identify the voluntary environmental disclosure pattern of companies
operating in carbon pricing countries;
2. To identify the voluntary environmental disclosure pattern of organisations operating in non-carbon pricing countries;
3. To assess the quantity and quality of voluntary environmental disclosures of companies from different countries; and
4. To assess the implementation of G4 sustainability reporting guidelines by the selected companies of different countries.
5. To assess the certification to ISO 14001 by the selected companies of different countries.
1.4 Research questions
To achieve the above research objectives a primary research question is formulated as follows: How do the voluntary environmental disclosures of electricity generating companies of carbon pricing countries vary from the voluntary environmental disclosures of companies from non-carbon pricing countries?
To answer this primary research question, the following two research sub-questions are addressed in the current study:
a. To what degree do the voluntary environmental disclosures of electricity generating companies vary between the carbon pricing and non-carbon pricing countries?
b. To what degree do the voluntary environmental disclosures of electricity generating companies comply with the GRI guidelines in terms of quantity and quality?
1.5 Overview of methodology and methods
Although a detailed discussion on methodological assumptions, data collection and analysis is conducted in chapter 5, a glimpse of methodological issues is outlined here. A quantitative approach has been used to assess if there is any impact of carbon pricing on the voluntary environmental disclosures of electricity companies of selected countries. Countries were broadly categorized as carbon pricing and non-carbon pricing countries based on the report “state and trends of non-carbon pricing”
5 published by the World Bank (World Bank 2014b, 2015). Carbon pricing countries include both carbon tax countries and emissions trading scheme (ETS) countries.
Data was collected from secondary sources such as annual reports, standalone sustainability reports or environmental reports published on the website of the respective organisations. Data was collected for the year 2015 as it was the latest year selected to avoid the time lag between the publication of G41 and the adoption of G4 by the organisations.
In order to examine the research questions, this study used content analysis (Guthrie & Farneti 2008; Krippendorff 2004) to investigate the VED in the organisations‟ aforementioned reports. Content analysis is a technique for making replicable inferences and is the most widely used method in social and environmental disclosure literature, specifically for scoring the extent of disclosure in terms of quantity and quality (Guthrie & Mathews 1985; Guthrie & Parker 1990; Milne & Adler 1999; Roberts, J 1991). Content analysis is conducted with a view to measuring the quantity and quality of voluntary environmental disclosures. Disclosure indices were used, based on GRI to assess whether any specific issues on a predefined index are disclosed or not (Joseph & Taplin 2011). GRI is the most extensively used voluntary sustainability reporting framework across the world (Manetti & Becatti 2009; Reynolds & Yuthas 2008). Two disclosure indices were adopted separately for quantity of VED and quality of VED. The extent of quantity of VED was measured by a disclosure index based on the modification of Dragomir (2010). It is very common for researchers to modify the existing disclosure indices to meet their own perceived needs (Marston & Shrives 1991). The range of unweighted score for the quantity measurement index varies from 0 to 21.On the other hand, the extent of quality of VED was measured by an index adopted from Hąbek and Wolniak (2016). The range of weighted score varies from 0 to 27. Finally this study uses multiple linear regression analysis in SPSS to reach the conclusion based on the collected data.
1
6 1.6 Organisation of the remaining chapters
This thesis is divided into seven chapters. Chapter 2 discusses the issues of emissions as a concern for the international community, and reasons and effects of emissions on the natural environment. Then the discussion flows to the major industrial sectors responsible vastly for the negative environmental impacts. At the end of this chapter, details of carbon pricing mechanisms such as carbon tax and emissions trading scheme (ETS) are discussed as these are the carbon reduction strategies adopted by different countries and regions. The discussion of this chapter leads to an investigation of whether and how carbon emissions related issues have been discussed in existing environmental accounting and reporting literature, more specifically voluntary environmental disclosure related literature which is ultimately discussed in chapter 3.
Chapter 3 begins with the discussion of environmental accounting and reporting literature. This chapter illustrates the related literature on national or international environmental policy and voluntary environmental disclosures. This discussion subsequently flows to the discussion on prior literature addressing the carbon pricing issues in voluntary environmental disclosures. Finally this chapter gives an overview of previous studies addressing the issues of voluntary environmental disclosures by the electricity generating sector worldwide, which is the selected sector for this broad study.
Chapter 4 discusses the theoretical framework for this study. This chapter aims to give a justification of the theoretical perspectives (legitimacy and institutional theory broadly) underpinning this study. This chapter discusses legitimacy and institutional theory broadly. After that, justification of theoretical perspectives, “institutional legitimacy theory”, “coercive isomorphism” and “mimetic isomorphism” branch of institutional theory are discussed.
Chapter 5 presents the methodology of this study which begins with the discussions about and formulation of the hypotheses in the light of findings of prior studies, followed by the method of testing those hypotheses along with the data collection procedures. Mode of data collection process is illustrated, followed by a discussion of the definitions and measurement criteria of dependent variables and independent variables of two separate linear models.
7 Chapter 6 illustrates the results of the statistical operations conducted in SPSS software. The results of these statistical operations lead to the last chapter of this study which deals with the analysis of the findings of this study.
Chapter 7 provides a discussion and conclusion for this study by revisiting the research findings and contributions. Research limitations of this study are then described, followed by the further potential research scope within this area.
1.7 Structure of the research
8
Figure 1.1: Research structure
Introduction (background, objectives, rationale, research questions) [Chapter 1]
Emergence of carbon pricing as an emissions trading strategy [Chapter 2]
Statistical results Gaps found in previous literature on
indirect impact of carbon pricing on VED Literature review [Chapter 3] Methodology of the study [Chapter 5] Review of relevant literature
Research contributions, limitations and future scope Institutional legitimacy theory, coercive
and mimetic isomorphism branch of institutional theory
Related research and hypothesis development
sample selection, empirical model and variable definition
Data scored and analysis using SPSS (Multiple regression performed)
Discussion and conclusion
[Chapter 7]
Theoretical perspectives underpinning the research
[Chapter 4]
Carbon pricing mechanism- impact on quantity and quality of VED: Analysis and findings [Chapter 6]
9
Chapter Two: Emergence of Carbon Pricing as an
Emissions Reduction Strategy
2.1 Introduction
This chapter provides an introduction to the issue of carbon/GHG emissions and carbon pricing mechanisms. First this chapter illustrates the causes and subsequent effects of emissions, major industries or sectors responsible for these emissions. This chapter also discusses the emissions reduction strategies adopted nationally and around the world. Finally this chapter discusses types of carbon pricing mechanisms and the current status of carbon pricing mechanisms around the world.
2.2 Emissions: Causes and effects
Nowadays world climate is going through a drastic change. The Intergovernmental Panel on Climate Change (IPCC) (2014) mentions in its fifth assessment report that carbon emissions or GHG emissions around the world are the driving force behind this global climate change or global warming. Here emissions mean the release of carbon or any other gases to the atmosphere, which causes greenhouse gas (GHG) effects. So emissions are mostly responsible for air pollution. These air pollutants can originate from two sources: natural sources and anthropogenic or man-made sources. Water vapour is the major source of natural emissions. Other sources of natural emissions are lightning, soil bacteria, animal respiration, decay, biological processes etc. Anthropogenic or human made emissions originate from internal combustion engines. Major sources of human made emissions are combustion of fossil fuel such as coal or diesel by the industrial sector, high temperature fuel combustion by the industrial sector or motor vehicles, natural gas leaks and combustion, aerosol propellants etc. (Sher 1998b). Emissions originating from the combustion of fossil fuels by electricity and heat generations, industrial operations, agriculture and transportation are the major man-made economic causes of global emissions, which account for almost 78% of total emissions (Intergovernmental Panel on Climate Change (IPCC) 2014).
10 Carbon dioxide, nitrogen oxide, carbon mono oxides, non-methane hydrocarbons, methane and chlorofluorocarbons are the major gases responsible for global emissions causing devastating global warming or destruction of stratospheric ozone layer.
Figure 2.1 Global greenhouse gas emissions by gas [Source: Intergovernmental Panel on Climate Change (IPCC) (2014)]
Global emissions of carbon dioxide, a major greenhouse gas (GHG) and driver of climate change, increased from 22.4 billion metric tons in 1990 to 35.8 billion in 2013, a rise of 60% (World Bank 2017). The substances of global emissions adversely affect the environment worldwide by interfering with climate, negatively impacting the survival of animal species, the physiology of plants, entire ecosystems and human property in the form of agricultural crops or man-made structures. The environmental effects of emissions are very alarming. These emissions cause destruction of the stratospheric ozone layer which is a cause of various types of skin diseases or even skin cancer. These emissions instigate the possibility of acid rain which destroys plants and crops as well as being very detrimental for fish and wildlife (Sher 1998a).
The current trend of emissions may push 100 million more people into extreme poverty by 2030. Moreover, the impact of extreme natural disasters is equivalent to a
Carbon Dioxide 76% Methane 16% Nitrous Oxide 6% Fluorinated Gases 2%
11 $520 billion loss in annual consumption, and it forces some 26 million people into poverty each year (World Bank 2017)
2.3 Carbon/ GHG emissions as a major concern for the environment
Global climate change (or global warming) has been recognized as the top most environmental challenge faced by humanity in the 21st century. Different organisations are working for the protection of the environment from global emissions. The Intergovernmental Panel on Climate Change (IPCC), United Nations Environment Programme (UNEP), Global Environment Facility (GEF), and European Environment Agency (EEA) are some of the major international organisations working with a view to protecting the world from global emissions.
The Kyoto protocol was the first agreement between different nations to mandate the country-to-country GHG reductions. This is a treaty which extends the 1992 United Nations Framework on Conventions. The main objective of this protocol is to reduce the human made GHG emissions in various ways, taking into consideration the differences in level of emissions, economic development and capability of making the reductions (Grubb 2004). The Kyoto protocol was adopted in Kyoto, Japan on 1991 and came into force on 2005. Currently 192 countries have ratified the agreement committing to a reduction of GHG emissions to achieve the predetermined threshold within a specified time.
The protocol is based on a common objective to reduce the concentration of emissions into the atmosphere to a level that would prevent dangerous anthropogenic interference with the climate system (Article 2: Kyoto Protocol 1997). The protocol outlines different degrees of responsibility as it puts the obligation to reduce current emissions on developed countries, on the basis that they are historically responsible for the current levels of greenhouse gases in the atmosphere. The first commitment period of the Kyoto protocol was 2008 to 2012 and the second commitment period is from 2012 to 2020. Each period binds each ratified country to lower the emissions level by a certain percentage.
The Paris climate agreement within the United Nations Framework Convention on Climate Change (UNFCC) is another notable movement by world politicians to deal with the global GHG or carbon emissions reduction and finance, starting from 2020.
12 A total of 195 UNFCC countries have signed this agreement, of which 153 have ratified it. Each country has agreed to implement initiatives to reduce carbon emissions and report its contribution to the mitigation of global warming. The agreement is based on the voluntary mechanism by each country rather than on force (Reguly & Mccarthy 2015). Each country will set a target for reduction of emissions by a specific date and each subsequent target will go beyond the previous target.
2.3.1 Impact of carbon emissions around the world
The effect of emissions is fearsome around the world. These carbon or other GHG emissions have contributed to a rise in the mean global temperature of .80 degrees Celsius above preindustrial times‟ trapped solar energy in the atmosphere (World Bank 2017). A study of Zeebe (2013) suggests that amplified warming due to unabated fossil fuel burning increases the possibility that large ice sheets, such as the Greenland ice sheet, will melt, leading to a significant sea level rise. Land ice is already melting 287.0 Gigatonnes per year and the sea level is increasing by 3.4 millimetres every year (NASA 2017). Different portions of the world have already gone under sea water and many others areas such as Maldives, Bangladesh, Tuvalu, Kiribati, Nauru, Palau and Seychelles are threatened with flooding in the near future, as the global arctic ice minimum is decreasing by 13.3% each decade (NASA 2017). The increased amount of emissions has also made the sea water 30% more acidic since the industrial revolution (Intergovernmental Panel on Climate Change (IPCC) 2007). As a result, people from low-lying coastal regions suffer from contamination of salt water.
Recent evidence suggests that droughts have been happening more frequently recently, due to the change in global climate; and they are expected to happen even more frequently and intensely in Africa, Southeast Asia , Australia, southern Europe, the Middle East and most of the Americas (Dai 2011). These droughts result in crop failures around the world and pose a threat to food security, specially to the poor countries (Ding, Hayes & Widhalm 2011). The World Economic Forum‟s Global Risks Report 2016 shows food crises due to the global climate change as the fourth top risk for business organisations.
13 The Current trends of global climate change, caused by the increased amount of emissions, have some direct and indirect impacts on the operation of business organisations. If the agriculture sector is affected by flood or droughts then crop production will decline and the cost of raw materials will increase, which instigates the inflation of the economy. Due to the scarcity of proper water, production process may be hampered. According to World Economic Forum (2016), water crisis stands first as the long-term risk for business organisations in future. The infrastructure of business organisations may be threatened as well, and this will increase the insurance cost of business organisations as a result. Above all there is a possibility of failure of climate-change mitigation and adaption by business organisations in the near or far future, if they do not take initiatives to limit their level of emissions.
2.3.2 Carbon emissions by different sectors
Business organisations, especially manufacturing organisations, are responsible for global emissions to a great extent directly or indirectly, as the source of power used by these organisations comes from the burning of fossil fuels, and fossil fuels are the largest source of anthropogenic GHG emissions (IEA 2017). The fossil fuel industry, along with its products and services, accounts for almost 91% of global industrial emissions and 70% of anthropogenic emissions, as identified in 2015 (Griffin 2017). If emissions by the industrial sector continue growing at this pace by 2050, the average global temperature will rise above pre-industrial levels and is projected to reach almost 5.5°C in the long term and an almost 4°C increase by the end of this century (IEA 2017). This rise of global temperature entails substantial species extinction, large risks of regional and global food scarcity, and could cross multiple tipping points in the Earth‟s climate system, leading to even more severe consequences as already mentioned (Intergovrnmental Panel on Climate Change 2014).
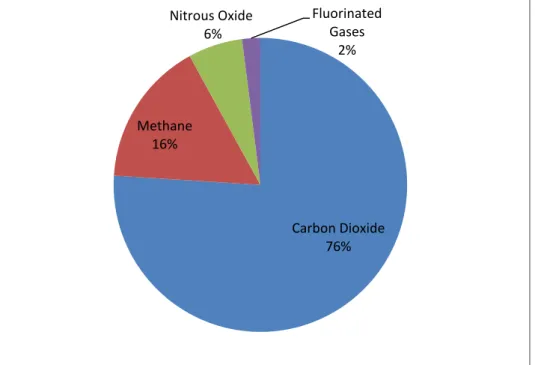
According to the Intergovernmental Panel on Climate Change (IPCC) (2014), global emissions can be broken down into several categories, based on the economic activities of different sectors. The electricity and heat generation sector stands first among the other economic sectors as it accounts for 25% of the total 2010 global emissions. Use of natural gas, coal and oil for the production of electricity and heat is the single largest source of global emissions.
14 Emissions from agriculture, forestry and other land use come mostly from cultivation of crops, livestock and deforestation, and generate 24% of global emissions through its economic sector. This estimate does not include the CO2 emissions that
ecosystems remove from the atmosphere by repossessing carbon in biomass, dead organic matter, and soils, which offset approximately 20% of emissions (FAO 2014). Figure 2.2 Global emissions by different sectors [Source: Intergovernmental Panel on Climate Change (IPCC) (2014)]
Emissions by the industry sector account for 21% of the total 2010 global emissions. Global GHG emissions from the industry sector occur mainly through fossil fuel consumption by manufacturing organisations, to generate energy. This sector includes emissions from metallurgical, chemical and mineral transformation processes which are not associated with waste management or energy consumption activities.
GHG emissions from the transportation sector account for 14% of total global emissions by the economic sector. This involves fossil fuel burnt for road, rail, marine and air transportation. Almost 95% of global transportation energy comes from use
Electricity and heat production
25%
Agriculture, forestry and other land use
24% Industry 21% Transportation 14% Buildings 6% Other energy 10%
15 of petroleum-based fuels such as gasoline or diesel (Environmental Protection Agency 2017).
6% of total 2010 GHG comes from building sector which involves generating energy and heat for cooking in homes (electricity use in building is included in the electricity and heat generation segment).
GHG emissions from all other energy sectors which are not directly associated with electricity and heat generation such as fuel extraction, refining and transportation, account for 10% of total global emissions. As depicted in the figure 2.2 above, the most emitting sector is the electricity and heat generating sector. This sector comprises those types of companies which produce electricity and heat for final consumption and trade. These companies generate electricity and heat using renewable (e.g. wind or water) and non-renewable sources (e.g. coal or gas).
2.3.3 Electricity generating sector and carbon emissions
The electricity generating sector is the most emitting sector compared to other sectors. This sector generates 42% of total global emissions as identified in 2014 (IEA 2016a). Electricity is produced from primary energy sources of coal, oil, natural gas, and less from uranium, the sun, wind or water (see Figure 2.3). The main methods of producing electricity cause CO2 or global GHG emissions. Emissions are
heavily reliant on the source of energy production: renewable or non-renewable: coal, oil, natural gas and uranium.
The most widespread type of power stations are combustion power plants which burn fossil fuels such as coal, oil or natural gas and biomass (household waste or plant matter), as they are the least expensive to build. Coal-fired plants are still the most common and currently generate more than 40% of the world's electricity (IEA 2016b). They are also the most carbon emitting per kilowatt-hour (kWh). Large countries like India and China rely primarily on coal for their electricity.
Nuclear power plants function on the heat produced by fissioning of atoms of uranium-235 or plutonium-239. Concentrated solar power technology harnesses the heat of the sun, which is amplified by mirrors.
16 Coal 41% Gas 22% Hydropower 16% Nucler power 11% Oil 4% Wind, solar, geothermal power and others 6%
The turbines of power plants can be driven by water and wind where hydropower plants use the energy of water as it is moved by dams, tides or rivers. Wind turbines capture the wind's energy with their enormous blades and use it to spin turbines. Some contemporary technologies use the energy of the ocean, capturing the wave power, but these are very few in number. If fossil fuel based power plants can be replaced by these renewable sources of energy based power plants, CO2 emissions
by the electricity generating companies will decline remarkably in the future. Renewable energy sources are the world‟s fastest growing source of energy, and use of renewable energy is increasing by an average 2.6% per year (IEA 2016c). This increasing trend of using renewables can reduce GHG emissions 70% by 2050 (International Renewable Energy Agency 2017).
Electricity generation is increasing rapidly to keep pace with the population increases and economic growth worldwide, as electricity is essential for household and business activities. 41% of this world electricity is produced from coal, 22% from gas, 16% from hydropower, 11% from nuclear power, 4% from oil and a mere 6% from renewable sources like wind, solar or geothermal power (IEA 2017).
Electricity generation is responsible for 42.5% of global CO2 emissions and 73% of
this can be attributed to coal-fired power plants, which emit 950 grams of CO2 for
Figure 2.3 Power consumption by electricity generating sector (IEA 2017) IEA (2017)
17 every kilowatt-hour of electricity they generate, compared with 350 grams for gas-fired power plants and 3 to 22 grams for wind, hydropower or even nuclear (Réseau de Transport d'Électricité 2017) [CO2 emissions attributable to only the construction
of plant].
Emissions from the electricity generating sector have increased by 50% between 2000 and 2014. Production of electricity is also expected to be increased in near future as well. So, increased production of electricity will result in increased amount of emissions. Due to carbon pricing in many countries, electricity generating companies are becoming interested in utilising renewable sources of energy instead of the combustion of fossil fuels. IEA reveals that electricity generation increased by 3% during the year 2015 compared to 2014; but there was a massive increase, 16%, in use of renewable sources and 1% fall in the use of fossil fuels such as coal or gas. During the year 2014 over 60% of total global emissions originated from only ten countries (IEA 2016a). Use of fossil fuel is the prime reason behind these emissions by electricity generating companies all over the world. Among the other fossil fuels coal, the most carbon-intensive fossil fuel, is mostly used by the companies. India, China, Poland and South Africa produce over 70% of their electricity using coal (IEA 2014).
Carbon emissions from the electricity generating sector are very high compared to other sectors around the world. In most countries the volume of carbon emissions from the electricity generating sector is very alarming and varies from 30% to 70% of the total emissions in some instances. The following table shows the volume of carbon emissions and the percentage of carbon emissions by the electricity generating sector against the total emissions during the year 2014 from the sample countries.
Table 2.1 shows that solely the electricity generating sector from India, China, South Africa, Turkey, Russia, Poland etc. emits more than 50% carbon of total emissions of that specific country.
18 Table 2.1 Carbon emissions by the electricity generating sector of each country [Source: IEA (2016a)]
Country
Total carbon emissions (MtCO2)
Carbon emissions by electricity generating sector (MtCO2) %
Austria 60.8 12.7 20.89 Belgium 87.4 16.4 18.76 Brazil 476 94.7 19.89 Bulgaria 42.1 28.2 66.98 Chile 75.8 29.6 39.05 China 9,134.90 4,415.70 48.34 Colombia 72.5 13 17.93 Croatia 15.1 3.3 21.85 Cyprus 5.8 2.9 50.00 Czech Republic 96.6 54.2 56.11 Denmark 34.5 13.5 39.13 Estonia 17.5 13.5 77.14 Finland 45.3 19.7 43.49 France 285.7 28.9 10.12 Germany 723.3 327.6 45.29 Greece 65.9 34 51.59 Hungary 40.3 11.1 27.54 Iceland 2 0 0.00 India 219.7 146.4 66.64 Indonesia 436.5 168.3 38.56 Iran 556.1 155.8 28.02 Ireland 33.9 11.1 32.74 Italy 319.7 103.4 32.34 Japan 1888.6 577.1 30.56 Jordan 24.1 12 49.79 Kazakhstan 223.7 95.9 42.87
19 Korea 567.8 298.7 52.61 Latvia 6.7 1.8 26.87 Lithuania 10.3 1.8 17.48 Luxembourg 9.2 0.8 8.70 Malta 2.3 1.6 69.57 Mexico 430.9 137.8 31.98 Morocco 53.1 20.3 38.23 Netherlands 148.3 58.3 39.31 New Zealand 31.2 5.7 18.27 Norway 35.3 1.9 5.38 Peru 47.8 11.6 24.27 Poland 279 148.3 53.15 Portugal 42.8 15.4 35.98 Romania 68.2 27.3 40.03 Russian Federation 1467.6 830.9 56.62 Slovakia 29.3 6.6 22.53 Slovenia 12.8 4.5 35.16 South Africa 437.4 251.8 57.57 Spain 232 70.2 30.26 Sweden 37.4 6.3 16.84 Switzerland 37.7 2.6 6.90 Thailand 243.5 92.3 37.91 Turkey 307.1 132.1 43.02 Ukraine 236.5 113.1 47.82 United Kingdom 407.8 145.3 35.63 Vietnam 143.3 50 34.89
2.4 Carbon emissions pricing mechanisms
If any country wants to curb the emissions or introduce carbon pricing mechanisms, government has to play a pivotal role, as government designs the policies and
20 implements those policies, relying on different wings. They have to coordinate different ministries and portfolios such as environmental protection authority/agency, ministry of commerce, ministry of planning, ministry of finance, ministry of foreign trade and affairs, ministry of transport, ministry of fuel/energy/electricity, ministry of business, local government etc. Only government can exercise power on these wings. These wings/departments have to work in an integrated way to ensure the reduction of emissions of respective countries.
Pricing on carbon is a process to shift the burden for damage back to those parties who are actually responsible for it. Carbon pricing means to put a price on carbon (World Bank 2014a). Carbon Pricing Leadership Coalition (2016) defines carbon pricing as “putting a price on carbon pollution to account for the impacts of greenhouse gas (GHG) emissions that stem from the economic choices made by both producers and consumers”. So, carbon price is the amount to be paid by the responsible parties, with a view to getting the right to emit carbon into the atmosphere. Carbon tax and emissions trading schemes are the two major forms of carbon pricing mechanisms.
2.4.1 Carbon tax
Carbon tax is a form of tax that is levied on the carbon emissions generated from use of fossil fuel content (Hoeller & Wallin 1991). According to World Bank (2014a) “carbon tax directly sets a price on carbon by defining a tax rate on greenhouse gas emissions or – more commonly – on the carbon content of fossil fuels”. Carbon exists in every sort of fossil fuel such as coal, petroleum and gas. Once this fuel is burnt, it produces carbon and other GHG which are responsible for global warming. Since combustion of these fossil fuels causes GHG emissions through the production process of goods or services, carbon tax is levied by imposing tax on the carbon content of fossil fuel at any point in the fuel product cycle. Carbon tax is imposed at the same rate per ton of carbon emitted.
Carbon tax was introduced in 1990 by Finland, the first country to use carbon pricing as an instrument for climate change mitigation (Kingsmill et al. 2015). Initially carbon tax was applied countrywide, with few exemptions for specific fuels or sectors (Vourc'h & Jimenez 2000). Norway, Sweden and Denmark implemented carbon tax in 1991 and 1992. In most cases carbon tax is imposed on products/services with
21 implications of carbon/GHG emissions (e.g. tax imposed on the electricity) rather than emissions of CO2 directly.
2.4.2 Emissions trading scheme
Emissions trading scheme is a government-mandated cap-and-trade system which requires organisations to acquire a government „permit‟ if they emit greenhouse gas to control emissions by providing economic incentives for attaining the objectives of emissions reduction (Stavins 2003). In this mechanism, total allowable emissions in a country or regions are set in advance („capped‟). Governments permit organisations a certain level of greenhouse gas emission, and governments reduce the permits each year, resulting in the reduction of the emission gradually. If the emitters do not exhaust the permit fully in a particular year, they can carry forward the surplus permit to the following year, or they can trade the surplus with other companies for free or through auction in an open market.
The concept of an emissions trading scheme was first introduced by Ellison Burton and William Sanjour between 1967 and 1970 for National Air Pollution Control Administration (predecessor to the United States Environmental Protection Agency's Office of Air and Radiation), USA. Their studies used mathematical models to assess and compare the cost and effectiveness of different emissions control strategies of several cities (Burton & Sanjour 1967). One of the first successes of the emissions trading scheme concept was demonstrated by the 1980s USA program to phase out lead from motor fuel (Newell & Rogers 2003). This program was followed by the Environmental Protection Agency sulphur dioxide (SO2) emissions trading program.
The was the first large-scale application of the emissions cap-and-trade or emissions trading scheme initiated under Title IV of the 1990 Clean Air Act Amendments in the United States (Burtraw & Szambelan 2009).
The market-based emissions trading scheme gained widespread political support, which was reflected in the Kyoto Protocol. Several emissions trading schemes have been launched under the shade of Kyoto protocol in the ratified countries around the world.
22 The European Union emissions trading scheme is the largest multi-country and multi-sector GHG emissions trading scheme (European Commission Climate Action 2017). In 1997 the Kyoto Protocol set binding emissions reduction targets for 37 highly industrialized countries for the first time. In 2000 the European Commission presented a paper mentioning preliminary ideas about the design of its EU ETS system. In 2003 the EU ETS directive was adopted, and in 2005 the EU ETS was officially launched. EU ETS has four phases (World Economic Forum 2016): phase 1 (2005-2007), phase 2 (2008-2012), phase 3 (2013-2020) and phase 4 (2021-2020). The first phase of EU ETS started in 2005, a three-year trial period, which was a „learning by doing‟ stage to prepare for phase 2 (European Commission Climate Action 2017). During phase one ETS covered only CO2 emissions from
power generating companies and other energy intensive industries. The first phase was successful as it established the price for carbon of EU member countries. The second phase was 2008 to 2012. In this period EU member countries had concrete emissions reduction targets. The third phase of EU ETS started in 2013 and will end in 2020. One of the major reforms in this third phase is the provision of reducing cap on emissions of power stations by 1.74% every year (European Commission Climate Action 2017). The European Commission revised the EU ETS for its fourth phase (2021-2030) in its legislative proposal in 2015, in line with the EU‟s 2030 climate and energy policy framework. The aim of this proposal is to reduce the emissions of EU ETS by 43% compared to the 2005 level.
The EU ETS regulates around 45% of total GHG emissions of 28 EU member countries along with Norway, Iceland and Liechtenstein, covering 11,000 power stations and manufacturing plants. Now Europe is looking forward to linking the EU ETS with some other compatible schemes of different countries around the world. Currently the EU ETS covers CO2 emissions from the power and heat generating
industry, energy intensive industries such as oil refineries, steel work and production of iron, metals, aluminium, lime, cement, glass, ceramics, paper, pulp, acids and the bulk organic chemicals.
Another prominent emissions trading scheme is New Zealand ETS which begun in 2008. At the initial stage this scheme covered only the forestry sector, but subsequently, in July 2010, it expanded the coverage to incorporate fishing, industrial process, and liquid fossil fuel and energy sectors. In 2015 the New Zealand
23 Government implemented the ETS nationally to cover all sectors (including agriculture).
Switzerland introduced both carbon tax and the Swiss ETS in 2008, on a voluntary basis (International Carbon Action Partnership 2017c). The ETS became mandatory for large firms on February 28, 2013. Companies having an energy capacity above 20MW, or GHG emissions above 25000 tonnes per year, are required to participate in the Swiss ETS. Medium-sized companies can choose either to pay carbon tax or participate in ETS. If any medium-sized company receives exemption from carbon tax it, will be allocated free credit up to its level of emissions from its preceding year. Other credits are traded in auction. Large companies are allocated free credits up to a benchmark. The EU ETS benchmark is used for selecting the Swiss ETS benchmark.
Korea launched its ETS (KETS) program on January 1, 2015. This is the first cap-and-trade system implemented nationally in East Asia (International Carbon Action Partnership 2017b). This scheme covers around 525 largest emitters in the country, which accounts for 68% of national GHG emissions.
The Republic of Kazakhstan launched its national ETS (KAZ ETS) on January 2013 on a pilot project basis, and it rolled into full implementation in 2014 (International Carbon Action Partnership 2017a). This scheme covers manufacturing, mining, waste, agriculture, transport and energy sector companies which emit more than twenty thousand tonnes CO2 per year. The target of this scheme is to achieve a 5%
reduction of GHG from the 1990 GHG level by 2020, and a 15%-25% reduction of GHG from the 1990 GHG level by 2030 (International Carbon Action Partnership 2017a).
2.4.3 Carbon pricing and reduction of emissions
The report of Intergovernmental Panel on Climate Change (IPCC) (2014), signifies putting a price on carbon to help limit the increase in global mean temperature to a maximum of 2 degrees Celsius above pre-industrial levels.
24 The reduction of emissions by EU countries makes clear the positive impact of carbon pricing to reduce the emissions, as EU ETS is the world‟s largest carbon pricing mechanism. In 2015 GHG emissions in EU countries were down by 22% compared to the 1990 level, which represents a reduction of 1265 million tonnes of CO2 equivalents (Eurostat 2017). This emissions reduction trend put the EU‟s target
on track to reduce the emissions by 20% by 2020 and 40% by 2030.
National greenhouse gas inventory data (see Table 2.2) for the period 1990–2014 by the United Nations Framework Convention on Climate Change (2016), reveals that carbon emissions by the different industrial sectors in most of the countries which have adopted a carbon pricing mechanism at the national level, have declined by significant percentages from 1990 to 2014, except for some countries like Cyprus, Iceland, Japan etc. In some countries such as Bulgaria, Latvia, Lithuania and Romania, emissions declined even more than 50% compared to the 1990 level. All of these countries are from the EU where carbon pricing has acted as a driving force for the reduction of emissions (Eurostat 2017). Considering the effectiveness of carbon pricing, 74 countries as well as 23 substantial jurisdictions, and more than 1,000 companies along with the institutional investors, expressed their support for applying carbon pricing by governments at the UN Secretary-General‟s Climate Summit, 2014.
World Bank (2014a) stated, “Pricing carbon is inevitable if we are to produce a package of effective and cost-efficient policies to support scaled up mitigation”. Once the emissions are priced through an emissions trading scheme or carbon tax, the revenue collected is used for steps taken by the governments to reduce the emissions, such as introducing new technology that emits less GHG.
25 Table 2.2 National greenhouse gas inventory data of selected carbon pricing countries [Source: United Nations Framework Convention on Climate Change (2016)] Country kt CO2 equivalent 1990 2000 2010 2013 2014 Change from 1990 to 2014 (%) Austria 78845 80429 84946 80043 76333 –3.2 Belarus 133457 77960 91184 93037 91896 –31.1 Belgium 146021 149213 133258 119375 113867 –22.0 Bulgaria 114578 58265 59820 54946 57197 –50.1 Croatia 31205 25173 27280 23771 22899 –26.6 Cyprus 5638 8339 9521 7963 8394 48.9 Czech Republic 195345 147993 137687 128390 123651 –36.7 Denmark 70246 70131 62944 54984 50785 –27.7 Estonia 39965 17062 19912 21677 21059 –47.3 EU 28 countries altogether 5656504 5161669 4775529 4463078 4278052 –24.4 Finland 71077 69855 75835 63197 59029 –17.0 France 549065 556461 518940 491159 464418 –15.4 Germany 1246101 1041064 939372 943520 900202 –27.8 Greece 104827 127688 118733 104669 101403 –3.3 Hungary 109636 73557 65524 57554 57225 –47.8 Iceland 3634 3963 4730 4535 4597 26.5 Ireland 56088 69251 62235 58482 58189 3.7
26 Italy 521921 554479 508424 438887 418587 –19.8 Japan 1270743 1386714 1304903 1407883 1363862 7.3 Latvia 26256 10434 12362 11415 11353 –56.8 Lithuania 47209 18739 20163 19256 19139 –59.5 Luxembourg 12871 9743 12221 11207 10771 –16.3 Malta 2000 2626 3099 2954 2983 49.1 Netherlands 221516 219916 213523 194825 186845 –15.7 New Zealand 65828 76385 78942 80298 81104 23.2 Norway 51913 54869 55272 53552 53156 2.4 Poland 579869 392276 403599 393092 380038 –34.5 Portugal 60487 83798 70232 64751 64395 6.5 Romania 304651 142317 119056 111837 111507 –63.4 Russia 3940191 2432751 2772489 2815190 2812310 –28.6 Slovakia 74272 49712 46483 42792 40658 –45.3 Slovenia 20394 19126 19619 18314 16582 –18.7 Spain 285934 385119 360800 327447 328926 15.0 Sweden 71917 68869 64997 55940 54383 –24.4 Switzerland 53314 52314 54363 52508 48605 –8.8 United Kingdom 799838 717281 613863 569783 527203 –34.1
2.5 Carbon pricing and voluntary environmental reporting
Contemporary stakeholders are much more aware of the operation of their organisations. They are not only concerned for the profit of business organisations but also concerned about the detrimental effect of operations of the organisations on
27 the environment. Carbon pricing mechanisms are an instrument that directly or indirectly instigates companies to limit their emissions. Carbon pricing is a mechanism imposed by governments with a view to reducing carbon emissions by companies. This mechanism binds the organisations to reduce emissions and report their level of emissions to the government. Reports regarding emissions to the other stakeholders are not mandatory in most of the countries around the world; instead, organisations voluntarily report their actions toward the protection of environment so that stakeholders can be informed about the level of emissions and actions taken to reduce the emissions. On the other hand, when regulations bind the organisations to disclose carbon emission to the government, and subsequently this information becomes public, organisations give more disclosures, although these disclosures are not required by the regulations (Liu et al. 2017). This study will be investigating how the decision of implementing carbon pricing by the government at the national level of any country would indirectly affect voluntary environmental disclosures of electricity generating companies of those respective countries.
2.6 Chapter conclusion
The aim of this chapter was to provide evidence that emissions have become a global concern and that business organisations, specially electricity generating companies, are responsible to a great extent for these emissions through using fossil fuel such as coal, oil, gas etc. Governments of different countries are trying to curb emissions by introducing carbon emissions pricing at national levels. Some countries have already introduced carbon tax or ETS, and other countries are committed to introducing such measures in the near future. There is evidence that carbon pricing contributes to the redution of emissions. Thus, this chapter builds the platform for broader study to investigate the impact of carbon pricing mechanisms on the voluntary environmental disclosures of electricity generating companies. For this purpose we need to know how such organisations incorporate the concern for emissions in their discosures practices voluntarily. Chapter 3 will revisit the previous literature on environmental accounting and disclosure issues along with the relevant literature on the relationship of carbon regulations and reporting.
28
Chapter Three: Literature Review
3.1 Introduction
This chapter aims to give an overview of previous research in environmental reporting specifically relating to voluntary environmental disclosures (VED). The chapter begins with the introductory discussion about environmental accounting and the major segments of environmental accounting which are environmental management accounting and external environmental accounting and disclosures. “Environmental reporting and voluntary environmental disclosures” illustrates how the VED started in the arena of environmental reporting. The chapter then proceeds to prior research in the field of VED where findings (determinants of VED) by previous studies have been incorporated. This chapter then provides an overview of the influence of national and international environmental policies on VED, followed by the section “carbon pricing and reporting of the organisations”. This section gives an overview regarding how the specific carbon pricing policies adopted by the government at the national level impact the reporting practices of an organisation. A detailed overview of previous research on VED of electricity generating companies is provided. Lastly, the chapter summarises the contribution of this research to literature on the impact of policy adoption on voluntary environmental reporting.
3.2 Environmental accounting: An overview
Environmental accounting is “the identification, measurement and allocation of environmental costs, the integration of these environmental costs into business decisions, and the subsequent communication of the information to a company‟s stakeholders‟‟ (Institute of Management Accountants 1996, p. 2). In the same way Steele and Powell (2002) define environmental accounting as the identification, allocation and analysis of material streams and their related money flows by using environmental accounting systems to provide insight into environmental impacts and associated financial effects. Company-related environmental impacts can be referred to as environmentally induced financial impacts of organisations on their economic system, and impacts of organisational operations on the environment (Burritt, Roger L, Hahn & Schaltegger 2002):
29 This branch of accounting is concerned with identifying the effect of the operation of business organisations on the surrounding environment, and incorporating the costs within business considerations. According to Stanko, Brogan and Alexander (2006) environmental accounting helps business organisations identify, measure and allocate environmental costs, integrate those environmental costs into business decisions and communicate the information to the stakeholders of those organisations. Ever-increasing pressure from different stakeholders concerned about the impact of business operations on the environment is pushing management to engage with environmental issues (Dyllick 1988). The costs of environmental impacts have risen substantially, so that environmental information has increasingly become economically relevant for decision-making and accountability (Schaltegger & Burritt 2000). So, as a whole, incorporating environmental costs into business considerations helps both the internal decision-making processes by the management (internal stakeholders) of the organisations and external decision-making processes by different external stakeholders (Deegan 2003). Although the type and amount of information required for internal decision makers may differ significantly for financial disclosures and environmental or sustainability reports (Institute of Management Accountants 1996), as a whole, environmental accounting is of immense importance to both internal and external parties. According to Baldarelli, Del Baldo and Nesheva-Kiosseva (2017, pp. 40-41), the importance of environmental accounting can be inferred as:
i. Many costs associated with the environment can be significantly reduced or eliminated as a result of business solutions for environment-friendly production based investments in “green” technology in the production process, and adjustment or modification of processes and/or products.
ii. There are potential cost savings that are neglected in cost management and are mainly expenses related to the environment.
iii. Opportunities exist to generate revenue for the company, such as through the sale of waste by-products.
iv. Through environmental accounting and reporting, competitive advantage can be achieved by greening design of manufactured goods, while greening manufacturing processes, products and services, which are increasingly preferred by customers.
![Figure 2.2 Global emissions by different sectors [Source: Intergovernmental Panel on Climate Change (IPCC) (2014)]](https://thumb-us.123doks.com/thumbv2/123dok_us/1486231.2698960/24.892.110.786.345.783/figure-global-emissions-different-sectors-source-intergovernmental-climate.webp)