This paper is included in the Proceedings of the
24th USENIX Security Symposium
August 12–14, 2015 • Washington, D.C.
ISBN 978-1-931971-232
Open access to the Proceedings of
the 24th USENIX Security Symposium
is sponsored by USENIX
Needles in a Haystack:
Mining Information from Public Dynamic Analysis
Sandboxes for Malware Intelligence
Mariano Graziano and Davide Canali,
Eurecom;
Leyla Bilge,
Symantec Research Labs;
Andrea Lanzi,
Universitá degli Studi di Milano;
Davide Balzarotti,
Eurecom
Needles in a Haystack:
Mining Information from Public Dynamic Analysis
Sandboxes for Malware Intelligence
Mariano Graziano
Eurecom
Davide Canali
Eurecom
Symantec Research Labs
Leyla Bilge
Andrea Lanzi
Universita’ degli Studi di Milano
Davide Balzarotti
Eurecom
Abstract
Malware sandboxes are automated dynamic analysis systems that execute programs in a controlled environ-ment. Within the large volumes of samples submitted every day to these services, some submissions appear to be different from others, and show interesting character-istics. For example, we observed that malware samples involved in famous targeted attacks – like the Regin APT framework or the recently disclosed malwares from the Equation Group – were submitted to our sandbox months or even years before they were detected in the wild. In other cases, the malware developers themselves interact with public sandboxes to test their creations or to develop a new evasion technique. We refer to similar cases as
malware developments.
In this paper, we propose a novel methodology to au-tomatically identifymalware developmentcases from the samples submitted to a malware analysis sandbox. The results of our experiments show that, by combining dy-namic and static analysis with features based on the file submission, it is possible to achieve a good accuracy in automatically identifying cases ofmalware development. Our goal is to raise awareness on this problem and on the importance of looking at these samples from an intelli-gence and threat prevention point of view.
1 Introduction
Malware sandboxes are automated dynamic analysis tools that execute samples in an isolated and instru-mented environment. Security researchers use them to quickly collect information about the behavior of suspi-cious samples, typically in terms of their execution traces and API calls. While customized sandboxes are often installed in the premises of security companies, some sandboxes are available as public online services, as it is the case for Malwr [13], Anubis [10], ThreatExpert [14], VirusTotal [16], and many others [5, 18, 4, 6, 15, 1, 3]
The main advantage of these systems is the fact that the analysis is completely automated and easily paral-lelizable, thus providing a way to cope with the over-whelming number of new samples that are collected ev-ery day. However, due to this extreme parallelization, an incredible amount of reports are generated every day. This makes the task of distinguishing new and important malware from the background noise of polymorphic and uninteresting samples very challenging.
In particular, two important and distinct observations motivate our work. First, it is relatively common that malware samples used to carry out famous targeted at-tacks were collected by antivirus companies or public sandboxes long before the attacks were publicly dis-covered [25]. For instance, the binaries responsible for operation Aurora, Red October, Regin, and even some of the new one part of the Equation Group were sub-mitted to the sandbox we used in our experiments sev-eral months before the respective attacks appeared in the news [11, 40, 17, 50, 45, 35]. The reasons behind this phenomenon are not always clear. It is possible that the files were automatically collected as part of an automated network or host-based protection system. Or maybe a security analyst noticed something anomalous on a com-puter and wanted to double-check if a suspicious file ex-hibited a potentially malicious behavior. It is even pos-sible that the malware developers themselves submitted an early copy of their work to verify whether it triggered any alert on the sandbox system. Whatever the reason, the important point is that no one paid attention to those files until it was too late.
The second observation motivating our study is the constant arm race between the researchers that put con-tinuous effort to randomize their analysis environments, and the criminals that try to fingerprint those systems to avoid being detected. As a consequence of this hid-den battle, malware and packers often include evasion techniques for popular sandboxes [19] and updated in-formation about the internal sandbox details are
regu-larly posted on public websites [2]. These examples prove that there must be a constant interaction between malware developers and popular public malware analysis services. This interaction is driven by the need to collect updated information as well as to make sure that new malware creation would go undetected. Even though de-tecting this interaction might be very difficult, we be-lieve it would provide valuable information for malware triage.
Up to the present, malware analysis services have col-lected large volumes of data. This data has been used both to enhance analysis techniques [23, 46] and to ex-trapolate trends and statistics about the evolution of mal-ware families [24]. Unfortunately, to the best of our knowledge, these datasets have never been used to sys-tematically study malware development and support mal-ware intelligence on a large scale. The only public excep-tion is a research recently conducted by looking at Virus-Total to track the activity of specific high-profile hacking groups involved in APT campaigns [52, 27].
In this paper, we approach this objective by applying data-mining and machine learning techniques to study the data collected by Anubis Sandbox [10], a popular malware dynamic analysis service. At the time we per-formed our analysis, the dataset contained the analysis reports for over 30 millions unique samples. Our main goal is to automatically detect if miscreants submit their samples during the malware development phase and, if this is the case, to acquire more insights about the dy-namics of malware development. By analyzing the meta-data associated to the sample submissions, it might be possible to determine the software provenance and im-plement an early-warning system to flag suspicious sub-mission behaviors.
It is important to understand that our objective is not to develop a full-fledged system, but instead to explore a new direction and to show that by combining metadata with static and dynamic features it is possible to suc-cessfully detect many examples of malware development submitted to public sandboxes. In fact, our simple pro-totype was able to automatically identify thousands of development cases, including botnets, keyloggers, back-doors, and over a thousand unique trojan applications.
2 Overview and Terminology
There are several reasons why criminals may want to in-teract with an online malware sandbox. It could be just for curiosity, in order to better understand the analysis environment and estimate its capabilities. Another rea-son could be to try to escape from the sandbox isolation to perform some malicious activity, such as scanning a network or attacking another machine. Finally, criminals may also want to submit samples for testing purposes,
to make sure that a certain evasion technique works as expected in the sandbox environment, or that a certain malware prototype does not raise any alarm.
In this paper, we focus on the detection of what we call
malware development. We use the term“development”
in a broad sense, to include anything that is submitted by the author of the file itself. In many cases the author has access to the source code of the program – either because she wrote it herself or because she acquired it from some-one else. However, this is not always the case, e.g., when the author of a sample uses a builder tool to automatically generate a binary according to a number of optional con-figurations (see Section 6 for a practical example of this scenario). Moreover, to keep things simple, we also use the word“malware”as a generic term to model any sus-picious program. This definition includes traditional ma-licious samples, but also attack tools, packers, and small probes written with the only goal of exfiltrating informa-tion about the sandbox internals.
Our main goal is to automatically detect suspicious submissions that are likely related to malware develop-ment or to a misuse of the public sandbox. We also want to use the collected information for malware intelligence. In this context, intelligencemeans a process, supported by data analysis, that helps an analyst to infer the moti-vation, intent, and possibly the identity of the attacker.
Our analysis consists of five different phases. In the first phase, we filter out the samples that are not inter-esting for our analysis. Since the rest of the analysis is quite time-consuming, any sample that cannot be related to malware development or that we cannot process with our current prototype is discarded at this phase. In the second phase, we cluster the remaining samples based on their binary similarity. Samples in each cluster are then compared using a more fine-grained static analysis technique. Afterwards, we collect six sets of features, based respectively on static characteristics of the submit-ted files, on the results of the dynamic execution of the samples in the cluster, and on the metadata associated to the samples submissions. This features are finally pro-vided to a classifier that we previously trained to identify
themalware developmentclusters.
3 Data reduction
The first phase of our study has the objective of reducing the amount of data by filtering out all the samples that are not relevant for our analysis. We assume that a cer-tain file could be a candidate for malware development only if two conditions are met. First, the sample must have been submitted to the public sandboxbeforeit was observed in the wild. Second, it has to be part of a man-ualsubmission done by an individual user – and not, for example, originating from a batch submission of a
secu-rity company or from an automated malware collection or protection system.
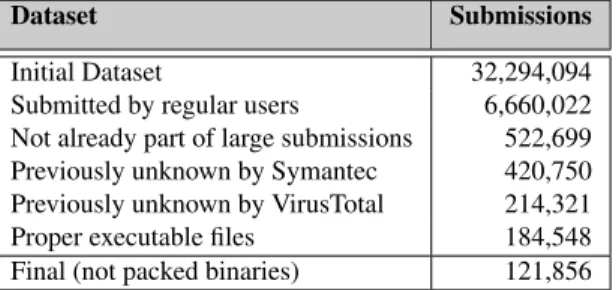
We started by filtering out the large number of batch submissions Anubis Sandbox receives from several re-searchers, security labs, companies, universities and reg-istered users that regularly submit large bulks of binaries. As summarized in Table 1, with this step we managed to reduce the data from 32 million to around 6.6 million binaries. These samples have been collected by Anubis Sandbox from 2006 to 2013.
Then, to isolate the new files that were never observed in the wild, we applied a two-step approach. First, we re-moved those submissions that, while performed by single users, were already part of a previous batch submission. This reduced the size of the dataset to half a million sam-ples. In the second step, we removed the files that were uploaded to the sandboxafterthey were observed by two very large external data sources: Symantec’s Worldwide Intelligence Network (WINE), and VirusTotal.
After removing corrupted or not executable files (e.g, Linux binaries submitted to the Microsoft Windows sandbox), we remained with 184,548 files that match our initial definition of candidates for malware development. Before sending them to the following stages of our anal-ysis, we applied one more filter to remove the packed ap-plications. The rationale behind this choice is very sim-ple. As explained in Section 4, the majority of our fea-tures work also on packed binaries, and, therefore, some potential malware development can be identified also in this category. However, it would be very hard for us to verify our results without having access to the decom-piled code of the application. Therefore, in this paper we decided to focus on unpacked binaries, for which it is possible to double-check the findings of our system. The packed executables were identified by leveraging the SigBuster [37] signatures.
Table 1 summarizes the number of binaries that are fil-tered out after each step. The filtering phase reduced the data to be analyzed from over 32 millions to just above 121,000 candidate files, submitted by a total of 68,250 distinct IP addresses. In the rest of this section we de-scribe in more details the nature and role of the Symantec and VirusTotal external sources.
Symantec Filter
Symantec Worldwide Intelligence Network Environment (WINE) is a platform that allows researchers to perform data intensive analysis on a wide range of cyber security relevant datasets, collected from over a hundred million hosts [28]. The data provided by WINE is very valuable for the research community, because these hosts are com-puters that are actively used by real users which are
po-Dataset Submissions
Initial Dataset 32,294,094
Submitted by regular users 6,660,022 Not already part of large submissions 522,699 Previously unknown by Symantec 420,750 Previously unknown by VirusTotal 214,321 Proper executable files 184,548 Final (not packed binaries) 121,856 Table 1: Number of submissions present in our dataset at each data reduction step.
tential victims of various cyber threats. WINE adopts a 1:16 sampling on this large-scale data such that all types of complex experiments can be held at scale.
To filter out from our analysis the binaries that are not good candidates to belong to malware development, we used two WINE datasets: the binary reputation and the AntiVirus telemetry datasets. The binary reputation dataset contains information about all of the executables (both malicious and benign) downloaded by Symantec customers over a period of approximately 5 years. To preserve the user privacy, this data is collected only from the users that gave explicit consent for it. At the time we performed our study, the binary reputation dataset included reports for over 400 millions of distinct bina-ries. On the other hand, the AntiVirus telemetry dataset records only the detections of known files that triggered the Norton Antivirus Engine on the users’ machines.
The use of binary reputation helps us locating the exact point in time in which a binary was first disseminated in the wild. The AntiVirus telemetry data provided instead the first time the security company deployed a signature to detect the malware. We combined these datasets to remove those files that had already been observed by Symantec either before the submission to Anubis Sand-box, or within 24 hours from the time they were first sub-mitted to the sandbox.
VirusTotal Filter
VirusTotal is a public service that provides virus scan re-sults and additional information about hundreds of mil-lions of analyzed files. In particular, it incorporates the detection results of over 50 different AntiVirus engines – thus providing a reliable estimation of whether a file is benign or malicious. Please note that we fetched the VirusTotal results for each file in our dataset several months (and in some cases even years) after the file was first submitted. This ensures that the AV signatures were up to date, and files were not misclassified just because they belonged to a new or emerging malware family.
binaries, the most important piece of information we in-corporate in our study is the first submission time of a certain file to the service. We believe that by combining the timestamps obtained from the VirusTotal and Syman-tec datasets, we achieved an acceptable approximation of the first time a certain malicious file was observed in the wild.
4 Sample Analysis
If a sample survived the data reduction phase, it means that (with a certain approximation due to the coverage of Symantec and Virustotal datasets) it had never been observed in the wild before it was submitted to the on-line malware analysis sandbox. Although this might be a good indicator, it is still not sufficient to flag the sub-mission as part of a potential malware development. In fact, there could be other possible explanations for this phenomenon, such as the fact that the binary was just a new metamorphic variation of an already known mal-ware family.
Therefore, to reduce the risk of mis-classification, in this paper we consider a candidate for possible develop-ment only when we can observe at least two samples that clearly show the changes introduced by the author in the software. In the rest of this section we describe how we find these groups of samples by clustering similar sub-missions together based on the sample similarity.
4.1 Sample Clustering
In the last decade, the problem of malware clustering has been widely studied and various solutions have been proposed [31, 33, 51, 32]. Existing approaches typi-cally use behavioral features to group together samples that likely belong to the same family, even when the binaries are quite different. Our work does not aim at proposing a new clustering method for malware. In fact, our goal is quite different and requires to group files to-gether only when they are very similar (we are looking for small changes between two versions of the same sam-ple) and not when they just belong to the same family. Therefore, we leverage a clustering algorithm that simply groups samples together based on their binary similarity (as computed byssdeep[38]) and on a set of features we extract from the submission metadata.
Moreover, we decided to put together similar binaries into the same cluster only if they were submitted to our sandbox in a well defined time window. Again, the as-sumption is that when a malware author is working on a new program, the different samples would be submitted to the online sandbox in a short timeframe. Therefore, to cluster similar binaries we compute the binary similari-ties among all the samples submitted in a sliding window
of seven days. We then shift the sliding window ahead of one day and repeat this step. We employ this sliding window approach in order (1) to limit the complexity of the computation and the total number of binary compar-isons, and (2) to ensure that only the binaries that are similar and have been submitted within one week from each other are clustered together. We also experimented with other window sizes (between 2 and 15 days) but while we noticed a significant reduction of clusters for shorter thresholds, we did not observed any advantage in increasing it over one week.
Similarities among binaries are computed using the ss-deep[38] tool which is designed to detect similarities on binary data. ssdeepprovides a light-weight solution for comparing a large-number of files by relying solely on similarity digests that can be easily stored in a database. As we already discarded packed binaries in the data re-duction phase, we are confident that the similarity score computed byssdeepis a very reliable way to group to-gether binaries that share similar code snippets. After computing the similarity metrics, we executed a simple agglomerative clustering algorithm to group the binaries for which the similarity score is greater than 70%. Note that this step is executed separately for each time win-dow, but it preserves transitivity between binaries in dif-ferent sliding windows. For example, if fileAis similar toBinsidewindow1, andBis similar to fileCinside the next sliding window, at the end of the processA,BandC
will be grouped into the same cluster. As a result, a sin-gle cluster can model a malware development spanning also several months.
Starting from the initial number of binaries, we identi-fied 5972 clusters containing an average of 4.5 elements each.
Inter-Cluster Relationships
Thessdeepalgorithm summarizes the similarity using an
index between 0 (completely different) and 100 (perfect match). Our clustering algorithm groups together sam-ples for which the difference between the fuzzy hashes is greater than the 70% threshold. This threshold was chosen according to previous experiments [38], which concluded that 70% similarity is enough to guarantee a probability of misclassification close to zero.
However, if the malware author makes very large changes on a new version of his program, our approach may not be able to find the association between the two versions. Moreover, the final version of a malware devel-opment could be compiled with different options, mak-ing a byte-level similarity too imprecise. To mitigate these side effects, after the initial clustering step, we per-form a refinement on its output by adding inter-clusters edges whenever two samples in the same time window
share the same submission origin (i.e., either from the same IP address or using the same email address for the registration). These are “weak” connections that do not model a real similarity between samples, and therefore they are more prone to false positives. As a consequence, our system does not use them when performing its auto-mated analysis to report suspicious clusters. However, as explained in Section 6, these extra connections can be very useful during the analysis of a suspicious cluster to gain a more complete picture of a malware development. After executing this refinement step, we were able to link to our clusters an additional 10,811 previously iso-lated binaries. This procedure also connected several clusters together, to form 225 macro groups of clusters.
4.2 Intra-cluster Analysis
Once our system had clustered the binaries that likely belong to the same malware development, we investigate each cluster to extract more information about its char-acteristics. In particular, we perform a number of code-based analysis routines to understand if the samples in the same cluster share similar code-based features.
Code Normalization
Code normalization is a technique that is widely used to transform binary code to a canonical form [26]. In our study, we normalize the assembly code such that the dif-ferences between two binaries can be determined more accurately. Under the assumption that two consecutive variations of the same program are likely compiled with the same tool chain and the same options, code normal-ization can be very useful to remove the noise introduced by small variations between two binaries.
There are several approaches that have been proposed to normalize assembly code [36, 49, 34]. Some of them normalize just the operands, some the mnemonics, and some normalize both. In this paper, we chose to nor-malize only the operands so that we can preserve the semantics of the instructions. In particular, we imple-mented a set of IDA Pro plugins to identify all the func-tions in the code and then replace, for each instruction, each operand with a corresponding placeholder tag:reg
for registers, memfor memory locations , valfor
con-stant values,nearfor near call offsets, andreffor
ref-erences to memory locations. These IDA scripts were run in batch mode to pre-process all the samples in our clusters.
Programming Languages
The second step in our intra-cluster analysis phase con-sists in trying to identify the programming language used
to develop the samples. The programming language can provide some hints about the type of development. For example, scripting languages are often used to develop tools or probes designed to exfiltrate information from the sandbox. Moreover, it is likely that a malware author would use the same programming language for all the in-termediate versions of the same malware. Therefore, if a cluster includes samples of a malware development, all samples should typically share the same programming language. Exceptions, as the one explained in Section 6, may point to interesting cases.
To detect the programming language of a binary we implemented a simple set of heuristics that incorpo-rate the information extracted by three tools: PEiD, the pefile python library, and the Linux strings
com-mand. First, we use pefile to parse the Import
Ad-dress Table (IAT) and obtain the list of libraries that are linked to the binary. Then, we search for program-ming language specific keywords on the extracted list. For example, the “VB” keyword in the library name is a good indicator of using Visual Basic, and including
mscoree.dllin the code can be linked to the usage of
Microsoft.NET. In the second step of our analysis, we
analyze the strings and the output ofPEiDto detect
com-piler specific keywords (e.g.,type infoand RTTI
pro-duced by C++ compilers, or “Delphi” strings generated by the homonymous language).
With these simple heuristics, we identified the pro-gramming language of 14,022 samples. The most rep-resented languages are Visual Basic (49%), C (21%), Delphi (18%), Visual Basic .Net (7%), and C++ (3%). The large number of Visual Basic binaries could be a consequence of the fact that a large number of available tools that automatically create generic malware programs adopt this language.
Fine-grained Sample Similarity
In this last phase, we look in more detail at the similar-ity among the samples in the same cluster. In particular, we are interested to know why two binaries show a cer-tain similarity: Did the author add a new function to the code? Did she modify a branch condition, or remove a basic block? Or maybe the code is exactly the same, and the difference is limited to some data items (such as a domain name, or a file path).
To answer these questions, we first extract the time-line of each cluster, i.e., the sequence in which each sam-ple was submitted to the sandbox in chronological order. Moving along the timeline, we compare each couple of samples using a number of static analysis plugins we de-veloped for IDA Pro.
The analysis starts by computing and comparing the
the normalized code of each function, to check which functions of the second binary were present unchanged in the first binary. The output is a list of additional func-tion that were not present in the original file, plus a list of functions that were likely modified by the author – i.e., those function that share the same position in the call graph but whose code does not perfectly match. How-ever, at this level of granularity it is hard to say if some-thing was modified in the function or if the author just removed the function and added another with the same callee.
Therefore, in these cases, we “zoom” into the function and repeat our analysis, this time comparing their
con-trol flow graphs(CFGs). Using a similar graph-based
approach, this time we look for differences at the basic block level. If the two CFGs are too different, we con-clude that the two functions are not one the evolution of the other. Otherwise, we automatically locate the differ-ent basic blocks and we generate a similarity measure that summarize the percentage of basic blocks that are shared by the two functions.
4.3 Feature Extraction
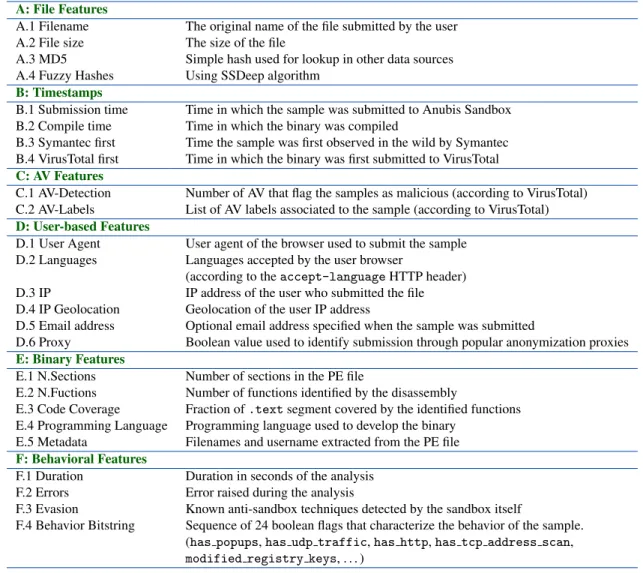
Based on the analysis described in the previous sections, our system automatically extracts a set of 48 attributes that we believe are relevant to study the dynamics of mal-ware development.
This was done in two phases. First, we enriched each sample with 25 individual features, divided in six cate-gories (see the Appendix for a complete list of individual features). The first class includes self-explanatory file features (such as its name and size). The Timestamps features identify when the sample was likely created, when it was submitted to Anubis Sandbox, and when it was later observed in the wild. While the creation time of the binary (extracted from the PE headers) could be man-ually faked by the author, we observed that this is seldom the case in practice, in particular when the author submits a probe or an intermediate version of a program. In fact, in these cases we often observed samples in which the compilation time precedes the submission time by only few minutes.
The third category of features contain the output of the VirusTotal analysis on the sample, including the set of la-bels associated by all AntiVirus software and the number of AVs that flag the sample as malicious. We then collect a number of features related to the user who submitted the sample. Since the samples are submitted using a web browser, we were able to extract information regarding the browser name and version, the language accepted by the system (sometime useful to identify the nationality of the user) and the IP from which the client was connect-ing from. Two features in this set require more
explana-tion. The email address is an optional field that can be specified when submitting a sample to the sandbox web interface. The proxy flag is instead an attempt to identify if the submitter is using an anonymization service. We created a list of IP addresses related to these services and we flagged the submissions in which the IP address of the submitter appears in the blacklist. In the Binary features set we record the output of the fine-grained binary anal-ysis scripts, including the number of sections and func-tions, the function coverage, and the metadata extracted by the PE files. Finally, in the last feature category we summarize the results of the sandbox behavioral report, such as the execution time, potential runtime errors, use of evasion techniques, and a number of boolean flags that represent which behavior was observed at runtime (e.g., HTTP traffic, TCP scans, etc.)
In the second phase of our analysis we extended the previous features from a single sample to the cluster that contains it. Table 2 shows the final list of aggregated at-tributes, most of which are obvious extensions of the val-ues of each sample in the cluster. Some deserve instead a better explanation. For instance, the clustershape(A3)
describes how the samples are connected in the cluster: in a tightly connected group, in a chain in which each node is only similar to the next one, or in a mixed shape including a core group and a small tail. TheFunctions diff(B13) summarized how many functions have been
modified in average between one sample and the next one.Dev time(B25) tells us how far apart in time each
samples were submitted to the sandbox, andConnect Back(B24) counts how many samples in the cluster open
a TCP connection toward the same /24 subnetwork from which the sample was submitted. This is a very com-mon behavior for probes, as well as for testing the data exfiltration component of a malicious program.
Finally, some features such as the number of crashes (C8) and the average VT detection (D4) are not very in-teresting per se, but they become more relevant when compared with the number of samples in the cluster. For example, imagine a cluster containing three very simi-lar files. Two of them run without errors, while the third one crashes. Or two of them are not detected by AV sig-natures, but one is flagged as malware by most of the existing antivirus software.
While we are aware of the fact that each feature could be easily evaded by a motivated attacker, as described in Section 6 the combinations of all them is usually suffi-cient to identify a large number of development clusters. Again, our goal is to show the feasibility of this approach and draw attention to a new problem, and not to propose its definitive solution.
A: Cluster Features
A.1 Cluster id The ID of the cluster
A.2 Num Elements The number of samples in the cluster
A.3 Shape An approximation of the cluster shape (GROUP—MIX—CHAIN)
B: Samples Features
B.1-4 Filesize stats Min, Max, Avg, and Variance of the samples filesize B.5-8 Sections stats Min, Max, Avg, and Variance of the number of sections B.9-12 Functions stats Min, Max, Avg, and Variance of the number of functions B.13 Functions diff Average number of different functions
B.14 Sections diff Average number of different sections B.15 Changes location One of: Data, Code, Both, None
B.16 Prog Languages List of programming languages used during the development B.17 Filename Edit Distance The Average edit distance of the samples’s filenames B.18 Avg Text Coverage Avg text coverage of the .text sections
B.19-22 CTS Time Min, Max, Avg, and Variance of the difference between compile and the submission time B.23 Compile time Flags Booleans to flagNULLor constant compile times
B.24 Connect back True if any file in the cluster contacts back the submitter’s /24 network B.25 Dev time Average time between each submission (in seconds)
C: Sandbox Features
C.1 Sandbox Only Numer of samples seen only by the sandbox (and not from external sources) C.2 Short Exec Number of samples terminating the analysis in less than 60s
C.4-6 Exec Time Min, Max, and Avg execution time of the samples within the sandbox C.7 Net Activity The number of samples with network activity
C.7 Time Window Time difference between first and last sample in the cluster (in days) C.8 Num Crashes Number of samples crashing during their execution inside the sandbox
D: Antivirus Features
D.1-3 Malicious Events Min, Max, Avg numbers of behavioral flags exibited by the samples D.4-5 VT detection Average and Variance of VirusTotal detection of the samples in the cluster D.6 VT Confidence Confidence of the VirusTotal score
D.7 Min VT detection The score for the sample with the minimum VirusTotal Detection D.8 Max VT detection The score for the sample with the maximum VirusTotal Detection D.9 AV Labels All the AV labels for the identified pieces of malware in the cluster
E: Submitter Features
E.1 Num IPs Number of unique IP addresses used by the submitter E.2 Num E-Mails Number of e-mail addresses used by the submitter E.3 Accept Languages Accepted Languages from the submitter’s browser
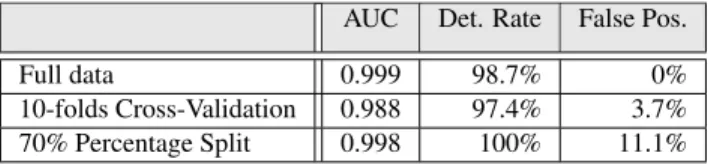
Table 2: List of Features associated to each cluster AUC Det. Rate False Pos.
Full data 0.999 98.7% 0%
10-folds Cross-Validation 0.988 97.4% 3.7% 70% Percentage Split 0.998 100% 11.1% Table 3: Classification accuracy, including detection and false positive rates, and the Area Under the ROC Curve (AUC)
5 Machine Learning
Machine learning provides a very powerful set of tech-niques to conduct automated data analysis. As the goal of this paper is to automatically distinguishing malware developments from other submissions, we tested with a
number of machine learning techniques applied to the set of features we presented in detail in the previous section. Among the large number of machine learning algo-rithms we have tested our training data with, we have obtained the best results by using the logistic model tree (LMT). LMT combines the logistic regression and decision tree classifiers by building a decision tree whose leaves have linear regression models [41].
Training Set
The most essential phase of machine learning is the train-ing phase where the algorithm learns how to disttrain-inguish the characteristics of different classes. The success of the training phase strictly depends on a carefully pre-pared labeled data. If the labeled data is not prepre-pared
carefully, the outcome of machine learning can be mis-leading. To avoid this problem, we manually labeled a number of clusters that were randomly chosen between the ones created at the end of our analysis phase. Manual labeling was carried out by an expert that performed a manual static analysis of the binaries to identify the type and objective of each modification. With this manual ef-fort, we flagged 91 clusters as non-development and 66 as development. To estimate the accuracy of the LMT classifier, we conducted a 10-fold cross validation and a 70% percentage split evaluation on the training data.
Feature Selection
In the previous section, we have presented a comprehen-sive set of features that we believe can be related to the evolution of samples and to distinguish malware devel-opments from ordinary malware samples. However, not all the features contribute in the same way to the final classification, and some works well only when used in combination with other classes.
To find the subset of features that achieves the opti-mal classification accuracy while helping us to obtain the list of features that contribute the most to it, we lever-aged a number of features selection algorithms that are widely used in machine learning literature: Chi-Square, Gain Ratio and Relief-F attribute evaluation. Chi-square attribute evaluation computes the chi-square statistics of each feature with respect to the class, which in our case is the fact of being a malware development or not. The Gain Ratio evaluation, on the other hand, evaluates the effect of the feature by measuring its gain ratio. Fi-nally, the Relief-F attribute evaluation methodology as-signs particular weights to each feature according to how much they are successful to distinguish the classes from each other. This weight computation is based on the comparison of the probabilities of two nearest neighbors having the same class and the same feature value.
While the order slightly differs, the ten most effective features for the accuracy of the classifier for all three fea-ture selection algorithms are the same. As also the com-mon sense suggests, the features we extract from the bi-nary similarity and the analysis of the samples are the most successful. For example, the connect back feature that checks if the sample connects back to the same IP address of the submitter, the average edit distance of the filenames of the samples, the binary function similar-ity, and the sample compile time features are constantly ranked on the top of the list. The submitter features and the sandbox features are following the sample features in the list. All of the features except the number of sand-box evasions, the VirusTotal results, and the features we extracted from the differences on the file sizes in the clus-ters had a contribution to the accuracy. After removing
those features, we performed a number of experiments on the training set to visualize the contribution of the different feature sub-sets to the classification accuracy. Figure 1 shows (in log-scale) the impact of each class and combination of classes. Among all the classes the samples-based features produced the best combination of detection and false positive rates (i.e. 88.2% detection rate with 7.4% false positives). In particular, the ones based on the static and dynamic analysis of the binaries seem to be the core of the detection ability of the sys-tem. Interestingly, the cluster-based features alone are the worst between all sets, but they increase the accuracy of the final results when combined with other features.
The results of the final classifier are reported in Ta-ble 3: 97.4% detection with of 3.7% false positives, ac-cording to 10-folds cross validation experiment. Note that we decided to tune the classifier to favor detection over false positives, since the goal of our system is only to tag suspicious submissions that would still need to be manually verified by a malware analyst.
6 Results
Our prototype implementation was able to collect sub-stantial evidences related to a large number of malware developments.
In total, our system flagged as potential development 3038 clusters over a six years period. While this number was too large for us to perform a manual verification of each case, if such a system would be deployed we es-timate between two and three alerts generated per day. Therefore, we believe our tool could be used as part of an early warning mechanism to automatically collect in-formation about suspicious submissions and report them to human experts for further investigation.
In addition to the 157 clusters already manually la-beled to prepare the training set for the machine learning component, we also manually verified 20 random clus-ters automatically flagged as suspicious by our system. Although according to the 10-fold cross validation exper-iments the false positive rate is 3.7%, we have not found any false positives on the clusters we randomly selected for our manual validation.
Our system automatically detected the development of a diversified group of real-world malware, ranging from generic trojans to advanced rootkits. To better under-stand the distribution of the different malware families, we verified the AV labels assigned to each reported clus-ter. According to them, 1474 clusters were classified as malicious, out of which our system detected the develop-ment of 45 botnets, 1082 trojans, 83 backdoors, 4 key-loggers, 65 worms, and 21 malware development tools (note that each development contained several different samples modeling intermediate steps). A large fraction
1 2 4 8 16 32 64 128 submi-e r (sub)
sample (samp) sandbox (sand) cluster (clus) an;virus
sample+submi-er sample+sandbox sample+cluster sample+av sample+cluster+submi-er sample+cluster+sandbox sample+cluster+av samp+clusr+sub+av samp+clus+sub+sand_selected Wrong Classifica;ons Detec;on Rate False Posi;ves
Figure 1: Classification success of different feature combinations.
Campaign Early Submission Time Before Public Disclosure Submitted by Operation Aurora 4 months US
Red October 8 months Romania
APT1 43 months US
Stuxnet 1 months US
Beebus 22 months Germany
LuckyCat 3 months US
BrutePOS 5 months France
NetTraveller 14 months US
Pacific PlugX 12 months US
Pitty Tiger 42 months US
Regin 44 months UK
Equation 23 months US
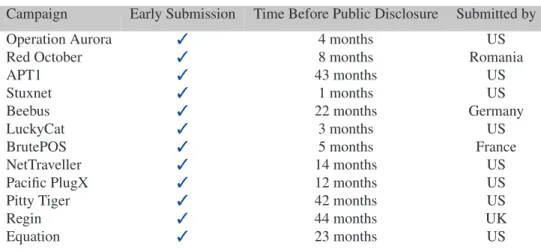
Table 4: Popular campaigns of targeted attacks in the sandbox database
of the clusters that were not identified by the AV sig-natures contained the development of probes, i.e., small programs whose goal is only to collect and transmit in-formation about the system where they run. Finally, some clusters also contained the development or testing of offensive tools, such as packers and binders.
6.1 Targeted Attacks Campaigns
Before looking at some of the malware development cases detected by our system, we wanted to verify our initial hypothesis that even very sophisticated malware
used in targeted attacks are often submitted to public sandboxes months before the real attacks are discovered. For this reason, we created a list of hashes of known and famous APT campaigns, such as the ones used in op-eration Aurora and Red October. In total, we collected 1271 MD5s belonging to twelve different campaigns. As summarized in Table 4, in all cases we found at least one sample in our database before the campaign was publicly discovered (Early Submissioncolumn). For example, for Red October the first sample was submitted in February 2012, while the campaign was later detected in October
2012. The sample of Regin was collected a record 44 months before the public discovery.
Finally, we checked from whom those samples were submitted to the system. Interestingly, several samples were first submitted by large US universities. A possi-ble explanation is that those samples were automatically collected as part of a network-based monitoring infras-tructure maintained by security researchers. Other were instead first submitted by individual users (for whom we do not have much information) from several differ-ent countries, including US, France, Germany, UK, and Romania. Even more interesting, some were first sub-mitted from DSL home Internet connections. However, we cannot claim that we observed the development phase of these large and popular targeted attacks campaigns as in all cases the samples were already observed in the wild (even though undetected and no one was publicly aware of their existence) before they were submitted to our sandbox. It is important to note that for this exper-iment we considered the entire dataset, without apply-ing any filterapply-ing and clusterapply-ing strategy. In fact, in this case we did not want to spot thedevelopmentof the APT samples, but simply the fact that those samples were sub-mitted and available to researchers long before they were publicly discovered.
We believe the sad message to take away from this ex-periment is that all those samples went unnoticed. As a community, there is a need for some kind of early warn-ing system to report suspicious samples to security re-searches. This could prevent these threats from flying under the radar and could save months (or even years) of damage to the companies targeted by these attacks.
6.2 Case studies
In the rest of this section we describe in more details three development scenarios. While our system identi-fied many more interesting cases, due to space limitation we believe the following brief overview provides a valu-able insight on the different ways in which attackers use (and misuse) public sandboxes. Moreover, it also shows how a security analyst can use the information collected by our system to investigate each case, and reconstruct both the author behavior and his final goal.
In the first example, the malware author introduced an anti-sandbox functionality to a Trojan application. In this case the analyst gathers intelligence information about the modus operandi of the attacker and about all the de-velopment phases.
In the second scenario, we describe a step by step de-velopment in which the attacker tries to collect informa-tion from the sandbox. This informainforma-tion is later used to detect the environment and prevent the execution of a future malware in the sandbox. In the last example,
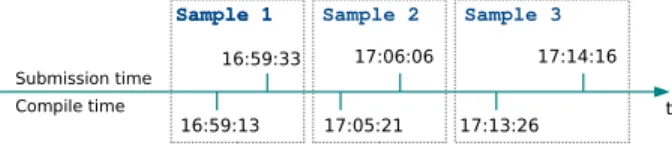
16:59:13 16:59:33 17:05:21 17:06:06 17:13:26 17:14:16 t Submission time Compile time Sample 1
Sample 1 Sample 2 Sample 3
Figure 2: Anti-sandbox check - Timeline we show how an attacker uses the sandbox as a testbed to verify the behavior of the malware. In this case, the author generated the binary using one of the many ded-icated builder applications that can be downloaded from the Internet or bought on the black market.
Example I: Anti-sandbox Malware
The cluster related to this example contains three sam-ples. The timeline (summarized in Figure 2) already sug-gests a possible development. In fact, the difference be-tween thesubmission time and the compile time is
very small.
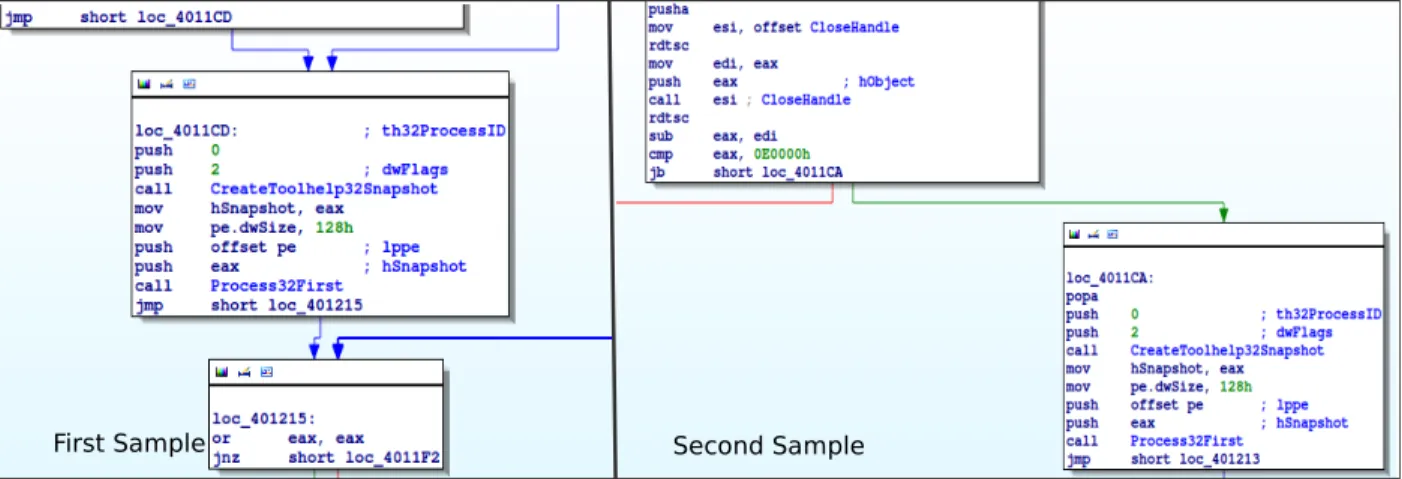
A quick look at the static features of the cluster shows that the three samples are very similar, and share the same strings as well as the same imphash (theimport hash [20, 21] recently introduced also by VirusTotal). However, the first sample is composed of 21 functions, while the last two samples have 22 functions. Our report also shows how the first and the second samples differ for two functions: the author modified the functionstart,
and introduced a new functionCloseHandle. This
in-formation (so far extracted completely automatically by our system) is a good starting point for a closer analysis. We opened the two executables in IDA Pro, and quickly identified the two aforementioned functions (snippet in Figure 3). It was immediately clear that the
start function was modified to add an additional
ba-sic block and a call to the newCloseHandlefunction.
The new basic block uses therdtscx86 instruction to
read the value of the Timestamp Counter Register (TSC), which contains the number of CPU cycles since the last reset. The same snippet of assembly is called two times to check the time difference. After the firstrdtsc
in-struction there is a call toCloseHandle, using the
times-tamp as handler (probably an invalid handler). These two well known tricks are here combined to detect the Anubis Sandbox environment – due to the delay introduced by its checks during program execution. The Anubis Sand-box’s core is slower in looking up the handlers table, and this time discrepancy is the key to detect the analysis en-vironment. In this case the difference has to be less than
0E0000h, or the program would immediately terminate
by calling theExitProcessfunction.
The last sample in the cluster was submitted only to tune the threshold and for this reason there were no im-portant differences with the second sample. Thecontrol
First Sample Second Sample
Figure 3: Anti-sandbox check - Start function comparison
flow graphanalysis performed automatically by our
sys-tem report a very high similarity between the first two samples, in line with the little modifications we found in the disassembled code. Finally, the behavioral features extracted by our system confirm our hypothesis: the first sample was executed until the analysis timeout, but the execution of the second one terminated after only five seconds.
The behavior described so far suggest malicious in-tents. This is also confirmed by other cluster metadata. For instance, while the first sample in the cluster was unknown to VirusTotal, the last one was clearly identi-fied as a commonTrojanapplication. This suggests that
the original sample, without the timing check, has never been used in the wild. Once more, the fact that all three samples have been submitted days before the trojan was first observed in the wild strongly supports the fact that the person who submitted them was indeed the malware author.
Example II: Testing a Trojan Dropper
The second cluster we want to describe is composed of five samples. Our report indicates that the first four are written in Delphi and the last one is written in Visual Basic. This is already a strange fact, since the two pro-gramming languages are quite different and it is unlikely that they could generate similar binaries.
In this case the cluster timeline does not provide use-ful information as all the Delphi samples share exactly the same compilation time: 20th of June, 1992. Only the Visual Basic sample had a compilation time consistent with the submission. On the contrary, the submission times provide an interesting perspective. All the samples have been submitted in few hours and this might indi-cate a possible development. In addition, there are two IP addresses involved: one for the four Delphi samples and one for the final Visual Basic version. The static
fea-tures of the first four samples show very little differences, suggesting that these are likely just small variations of the same program. In average, they share 169 out of 172 functions and 7 out of 8 PE sections. By inspect-ing the changes, we notice that the attacker was addinspect-ing some threads synchronization code to a function respon-sible for injecting code into a different process. The
con-trol flow graphsimilarity reported by our tool was over
98%, confirming the small differences we observed be-tween each versions. Once the author was happy with the result, she submitted one more sample, this time com-pletely different from the previous ones. Despite the ob-vious differences in most of the static analysis features, the fuzzyhash similarity with sample 4 was 100%. A rapid analysis showed that this perfect match was due to the fact that the Visual Basic application literally em-bedded the entire binary of the fourth Delphi program. In addition, the behavior report confirmed that, once ex-ecuted, the Visual Basic Trojan dropped the embedded executable that was later injected inside a target process. None of the Antivirus software used by VirusTotal rec-ognized the first four samples as malicious. However, the last one was flagged by 37 out of 50 AVs as atrojan
droppermalware.
It is important to stress that a clear advantage of our system is that it was able to automatically reconstruct the entire picture despite the fact that not all samples were submitted from the same IP address (even though all lo-cated in the same geographical area). Moreover, we were able to propagate certain metadata extracted by our sys-tem (for example the username of the author extracted from the binary compiled with Visual Studio) from one sample to the others in which that information was miss-ing. This ability to retrieve and propagate metadata be-tween different samples can be very useful during an in-vestigation.
devel-opment is the fact that after the process injection, the pro-gram used a well known dynamic DNS service (no-ip)
to resolve a domain name. The IP address returned by the DNS query pointed exactly to the same machine that was used by the author to submit the sample. This suggests that the attacker was indeed testing his attack before re-leasing it, and this information could be used to locate the attacker machine.
We identified a similarconnect-backbehavior in other 1817 clusters. We also noticed how most of these clus-ters contain samples generated by known trojanbuilders, like Bifrost [8] or PoisonIvy [9]. While this may seem to prove that these are mostly unsophisticated attacks, Fire-Eye [22] recently observed how the Xtremerat builder [7] (which appeared in 28 of our clusters) was used to pre-pare samples used in several targeted attacks.
Example III: Probe Development
In this last example we show an attacker fingerprint-ing the analysis environment and how, at the end, she manages to create her own successful antisandbox check. The cluster consists of two samples, both submitted from France in a time span of 23 hours by the same IP ad-dress. The two samples have the same size, the same number of functions (164), and of sections (4). There is only one function (_start) and two sections (.text
and.rdata) presenting some differences. The two
pro-grams perform the same actions, they create an empty text file and then they retrieve the file attributes through the APIGetFileAttributes. The only differences are
on the API version they use (GetFileAttributesAor GetFileAttributesW) and on the file name to open.
At a first look, this cluster did not seem very inter-esting. However the inter-cluster connections pointed to other six loosely correlated samples submitted by the same author in the same week. As explained in Section 4, these files have not been included in the core cluster be-cause the binary similarity was below our threshold. In this case, these samples were all designed either to col-lect information or to test anti-virtualization/emulation tricks. For instance, one binary implemented all the known techniques based on idt, gdt and ldtto
de-tect a virtual machine monitor [48, 47, 42]. Another one simply retrieved the computer name, and another one was designed to detect the presence of inline hooking. Putting all the pieces together, it is clear that the author was preparing a number of probes to assess various as-pects of the sandbox environment.
This example shows how valuable the inter-clusters edges can be to better understand and link together differ-ent submissions that, while differdiffer-ent between each other at a binary level, are likely part of the same organized “campaign”.
6.3 Malware Samples in the Wild
As we already mentioned at the beginning of the sec-tion, out of 3038 clusters reported as malware develop-ment candidates by our machine learning classifier, 1474 (48%) contained binaries that were detected by the an-tivirus signatures as malicious (according to VirusTotal). A total of 228 of the files contained in these clusters were later detected in the wild by the Symantec’s an-tivirus engine. The average time between the submission to our sandbox and the time the malware was observed in the wild was 135 days – i.e., it took between four and five months for the antivirus company to develop a signa-ture and for the file to appear on the end-users machines. Interestingly, some of these binaries were later detected on more than 1000 different computers in 13 different countries all around the world (obviously a lower bound, based on the alerts triggered on a subset of the Syman-tec’s customers). This proves that, while these may not be very sophisticated malware, they certainly have a neg-ative impact on thousands of normal users.
7 Limitations
We are aware of the fact that once this research is pub-lished, malware authors can react and take countermea-sures to sidestep this type of analysis systems. For in-stance, they may decide to use “private” malware check-ers, and avoid interacting with public sandboxes alto-gether. First of all, this is a problem that applies to many analysis techniques ranging from botnet detection, to in-trusion prevention, to malware analysis. Despite that, we believe that it is important to describe our findings so that other researchers can work in this area and propose more robust methodologies in the future.
Moreover, as we mentioned in the introduction, af-ter we completed our study someone noticed that some known malware development groups were testing their creation on VirusTotal [52, 27]. This confirms that what we have found is not an isolated case but a widespread phenomenon that also affects other online analysis sys-tems. Second, now that the interaction between malware developers and public sandboxes is not a secret anymore, there is no reason that prevents us from publishing our findings as well.
We are aware of the fact that our methodology is not perfect, that it can be evaded, and that cannot catch all de-velopment cases. However, we believe the key message of the paper is that malware authors are abusing public sandboxes to test their code, and at the moment we do not need a very sophisticated analysis to find them. Since this is the first paper that tries to identify these cases, we found that our approach was already sufficient to detect
thousands of them. Certainly more research is needed in this area to develop more precise monitoring and early warning system to analyze the large amounts of data au-tomatically collected by public services on a daily basis.
8 Related Work
While there has been an extensive amount of research on malware analysis and detection, very few works in the literature have studied the datasets collected by public malware dynamic analysis sandboxes. The most compre-hensive study in this direction was conducted by Bayer et al. [24]. The authors looked at two years of Anubis [10] reports and they provided several statistics about mal-ware evolution and about the prevalent types of malicious behaviors observed in their dataset.
Lindorfer et al. [43] conducted the first study in the area of malware development by studying the evolution over time of eleven known malware families. In partic-ular, the authors documented the malware updating pro-cess and the changes in the code for a number of dif-ferent versions of each family. In our study we look at the malware development process from a different angle. Instead of studying different versions of the same well known malware, we try to detect, on a large scale, the au-thors of the malware at the moment in which they interact with the sandbox itself. In a different paper, Lindorfer et al. [44] proposed a technique to detect environment sen-sitive malware. The idea is to execute each malware sam-ple multisam-ple times on several sandboxes equipped with different monitoring implementations and then compare the normalized reports to detect behavior discrepancies.
A similar research area studies the phylogeny [30] of malware by using approaches taken from the biology field. Even if partially related to our work, in our study we were not interested in understanding the relationship between different species of malware, but only to detect suspicious submissions that may be part of a malware development activity.
In a paper closer to our work, Jang et al. [34] studied how to infer the software evolution looking at program binaries. In particular, the authors used both static and dynamic analysis features to recover the software lin-eage. While Jang’s paper focused mostly on benign pro-grams, some experiments were also conducted on 114 malicious software with known lineage extracted from the Cyber Genome Project [12]. Compared to our work, the authors used a smaller set of static and dynamic fea-tures especially designed to infer the software lineage (e.g., the fact that a linear development is characterized by a monotonically increasing file size). Instead, we use a richer set of features to be able to distinguish mal-ware developments from variations of the same samples collected on the wild and not submitted by the author.
While our approaches share some similarities, the goals are clearly different.
Other approaches have been proposed in the litera-ture to detect similarities among binaries. Flake [29] proposed a technique to analyze binaries as graphs of graphs, and we have been inspired by his work for the
control flow analysisdescribed in Section 4. Kruegel et
al. [39] proposed a similar technique in which they ana-lyzed the control flow graphs of a number of worms and they used a graph coloring technique to cope with the graph-isomorphism problem.
Finally, one step of our technique required to cluster together similar malware samples. There are several pa-pers in the area of malware clustering [31, 33, 51, 32]. However, their goal is to cluster together samples belong-ing to the same malware family as fastest as possible and with the highest accuracy. This is a crucial task for all the Antivirus companies. However, our goal is differ-ent as we are interested in clustering samples based only on binary similarity and we do not have any interest in clustering together members of the same family based on their behavior.
9 Conclusion
Public dynamic analysis sandboxes collect thousands of new malware samples every day. Most of these submis-sions belong to well known malware families, or are be-nign files that do not pose any relevant security threat. However, hidden in this large amount of collected data, few samples have something special that distinguishes them from the rest. In this paper, we discussed the im-portance of looking at these samples from an intelligence and threat prevention point of view.
We show that several binaries used in the most fa-mous targeted attack campaigns had been submitted to our sandbox months before the attack was first re-ported. Moreover, we propose a first attempt to mine the database of a popular sandbox, looking for signs of mal-ware development. Our experiments show promising re-sults. We were able to automatically identify thousands of developments, and to show how the authors modify their programs to test their functionalities or to evade de-tections from known sandboxes. Around 1,500 of them were real malware developments – some of which have been later observed on thousands of infected machines around the world.
Acknowledgment
We would like to thank Claudio Guarnieri for the fruitful discussions and insights.
References
[1] Amnpardaz SandBox Jevereg. http://jevereg.amnpardaz. com/.
[2] AV Tracker.http://avtracker.info/.
[3] Comodo Instant Malware Analysis. http://camas.comodo. com/.
[4] ThreatTrack Security Public Sandbox. http: //www.threattracksecurity.com/resources/
sandbox-malware-analysis.aspx. [5] ViCheck.https://www.vicheck.ca.
[6] Xandora - Suspicious File Analyzer. http://www.xandora. net/xangui/.
[7] Xtreme RAT. https://sites.google.com/site/ xxtremerat/.
[8] Bifrost Builder. http://www.megasecurity.org/trojans/ b/bifrost/Bifrost2.0special.html, 2008.
[9] Poison Ivy RAT.http://www.poisonivy-rat.com, 2008. [10] Anubis.http://anubis.iseclab.org, 2009.
[11] A new approach to China. http://googleblog.blogspot. fr/2010/01/new-approach-to-china.html, 2010. [12] Darpa Cyber Genome Project. https://www.
fbo.gov/index?s=opportunity&mode=form&id= c34caee99a41eb14d4ca81949d4f2fde, 2010. [13] Malwr.https://malwr.com, 2010.
[14] ThreatExpert.http://www.threatexpert.com/, 2010. [15] Malbox.http://malbox.xjtu.edu.cn/, 2011.
[16] Virustotal += Behavioural Information. http://blog.virustotal.com/2012/07/
virustotal-behavioural-information.html, 2012. [17] The Red October Campaign - An Advanced Cyber
Espi-onage Network Targeting Diplomatic and Government Agencies. https://www.securelist.com/en/blog/785/, 2013. [18] TotalHash.http://totalhash.com/, 2013.
[19] RDG Tejon Crypter. http://blackshop.freeforums.org/ rdg-tejon-crypter-2014-t743.html, 2014.
[20] Tracking Malware with Import Hash-ing. https://www.mandiant.com/blog/ tracking-malware-import-hashing/, 2014.
[21] VirusTotal += imphash. http://blog.virustotal.com/ 2014/02/virustotal-imphash.html, 2014.
[22] XtremeRAT: Nuisance or Threat? http:// www.fireeye.com/blog/technical/2014/02/
xtremerat-nuisance-or-threat.html, 2014.
[23] BALZAROTTI, D., COVA, M., KARLBERGER, C., KRUEGEL, C., KIRDA, E.,ANDVIGNA, G. Efficient Detection of Split Personalities in Malware. InProceedings of the Network and Distributed System Security Symposium (NDSS)(San Diego, CA, February 2010), NDSS 10.
[24] BAYER, U., HABIBI, I., BALZAROTTI, D., KIRDA, E.,AND KRUEGEL, C. A view on current malware behaviors. InUSENIX workshop on large-scale exploits and emergent threats (LEET) (April 2009), LEET 09.
[25] BILGE, L.,ANDDUMITRAS, T. Before we knew it: An empir-ical study of zero-day attacks in the real world. InProceedings of the 2012 ACM Conference on Computer and Communications Security(New York, NY, USA, 2012), CCS ’12, ACM, pp. 833– 844.
[26] BRUSCHI, D., MARTIGNONI, L.,ANDMONGA, M. Using Code Normalization for Fighting Self-Mutating Malware. In Proceed-ings of the International Symposium of Secure Software Engi-neering (ISSSE)(Mar. 2006), IEEE Computer Society. Arlington, VA, USA.
[27] DIXON, B. Watching attackers through virustotal. http://blog.9bplus.com/ watching-attackers-through-virustotal/, 2014. [28] DUMITRAS, T.,ANDSHOU, D. Toward a standard benchmark
for computer security research: The worldwide intelligence net-work environment (wine). InProceedings of the First Workshop on Building Analysis Datasets and Gathering Experience Returns for Security(2011), BADGERS ’11.
[29] FLAKE, H. Structural comparison of executable objects. In In Proceedings of the IEEE Conference on Detection of Intru-sions and Malware & Vulnerability Assessment (DIMVA(2004), pp. 161–173.
[30] HAYES, M., WALENSTEIN, A.,ANDLAKHOTIA, A. Evalua-tion of malware phylogeny modelling systems using automated variant generation, 2009.
[31] HU, X., BHATKAR, S., GRIFFIN, K., AND SHIN, K. G. Mutantx-s: Scalable malware clustering based on static features. InProceedings of the 2013 USENIX Conference on Annual Tech-nical Conference(Berkeley, CA, USA, 2013), USENIX ATC’13, USENIX Association, pp. 187–198.
[32] JACOB, G., COMPARETTI, P. M., NEUGSCHWANDTNER, M., KRUEGEL, C.,ANDVIGNA, G. A static, packer-agnostic filter to detect similar malware samples. InProceedings of the 9th International Conference on Detection of Intrusions and Mal-ware, and Vulnerability Assessment(Berlin, Heidelberg, 2013), DIMVA’12, Springer-Verlag, pp. 102–122.
[33] JANG, J., BRUMLEY, D.,ANDVENKATARAMAN, S. Bitshred: Feature hashing malware for scalable triage and semantic anal-ysis. InProceedings of the 18th ACM Conference on Computer and Communications Security(New York, NY, USA, 2011), CCS ’11, pp. 309–320.
[34] JANG, J., WOO, M., ANDBRUMLEY, D. Towards automatic software lineage inference. InProceedings of the 22Nd USENIX Conference on Security(Berkeley, CA, USA, 2013), SEC’13, USENIX Association, pp. 81–96.
[35] KASPERSKY GREAT TEAM. Equation: The death star of malware galaxy. http: //securelist.com/blog/research/68750/
equation-the-death-star-of-malware-galaxy/, 2015. [36] KHOO, W. M.,ANDLIO, P. Unity in diversity:
Phylogenetic-inspired techniques for reverse engineering and detection of mal-ware families.SysSec Workshop(2011), 3–10.
[37] KOIVUNEN, T. Sigbuster. http://www.teamfurry.com", 2009.
[38] KORNBLUM, J. Identifying almost identical files using context triggered piecewise hashing.Digital Investigation 3, Supplement, 0 (2006), 91 – 97.
[39] KRUEGEL, C., KIRDA, E., MUTZ, D., ROBERTSON, W.,AND VIGNA, G. Polymorphic worm detection using structural infor-mation of executables. InProceedings of the 8th International Conference on Recent Advances in Intrusion Detection(Berlin, Heidelberg, 2006), RAID’05, Springer-Verlag, pp. 207–226. [40] KURTZ, G. Operation Aurora hit Google, Others.
http://web.archive.org/web/20100327181927/http: //siblog.mcafee.com/cto/operation-%E2%80% 9Caurora%E2%80%9D-hit-google-others, 2010.
[41] LANDWEHR, N., HALL, M.,ANDFRANK, E. Logistic model trees. InMachine Learning: ECML 2003(2003), Springer Berlin Heidelberg, pp. 241–252.
[42] LIGH, M. Using IDT for VMM Detection.http://www.mnin. org/?page=vmmdetect.
[43] LINDORFER, M., DI FEDERICO, A., MAGGI, F., MI -LANICOMPARETTI, P.,ANDZANERO, S. Lines of Malicious Code: Insights Into the Malicious Software Industry. In Proceed-ings of the 28th Annual Computer Security Applications Confer-ence (ACSAC)(2012).
[44] LINDORFER, M., KOLBITSCH, C., AND MILANI COM -PARETTI, P. Detecting Environment-Sensitive Malware. In Pro-ceedings of the 14th International Conference on Recent Ad-vances in Intrusion Detection (RAID)(2011).
[45] MORGAN MARQUIS-BOIRE, CLAUDIO GUARNIERI, AND RYAN GALLAGHER. Secret malware in euro-pean union attack linked to u.s. and british intelligence. https://firstlook.org/theintercept/2014/11/24/ secret-regin-malware-belgacom-nsa-gchq/, 2014. [46] MOSER, A., KRUEGEL, C., ANDKIRDA, E. Exploring
mul-tiple execution paths for malware analysis. InProceedings of the 2007 IEEE Symposium on Security and Privacy(Washington, DC, USA, 2007), SP ’07, IEEE Computer Society, pp. 231–245. [47] QUIST, D., AND SMITH, V. Detecting the Presence of
Vir-tualmachines Using the Local Data Table. http://www. offensivecomputing.net/files/active/0/vm.pdf. [48] RUTKOWSKA, J. Red Pill... or how to detect VMM using
(almost) one CPU instruction. http://web.archive.org/ web/20070911024318/http://invisiblethings.org/ papers/redpill.html, 2004.
[49] SÆBJØRNSEN, A., WILLCOCK, J., PANAS, T., QUINLAN, D., ANDSU, Z. Detecting code clones in binary executables. In Pro-ceedings of the Eighteenth International Symposium on Software Testing and Analysis(2009), ISSTA ’09.
[50] SYMANTECSECURITYRESPONSE. Regin: Top-tier espionage tool enables stealthy surveillance. http://www.symantec. com/content/en/us/enterprise/media/security_ response/whitepapers/regin-analysis.pdf, 2014. [51] WICHERSKI, G. pehash: A novel approach to fast malware
clus-tering. InProceedings of the 2Nd USENIX Conference on Large-scale Exploits and Emergent Threats: Botnets, Spyware, Worms, and More(Berkeley, CA, USA, 2009), LEET’09, USENIX As-sociation, pp. 1–1.
[52] ZETTER, K. A google site meant to protect you is help-ing hackers attack you. http://www.wired.com/2014/09/ how-hackers-use-virustotal/, 2014.
A: File Features
A.1 Filename The original name of the file submitted by the user A.2 File size The size of the file
A.3 MD5 Simple hash used for lookup in other data sources A.4 Fuzzy Hashes Using SSDeep algorithm
B: Timestamps
B.1 Submission time Time in which the sample was submitted to Anubis Sandbox B.2 Compile time Time in which the binary was compiled
B.3 Symantec first Time the sample was first observed in the wild by Symantec B.4 VirusTotal first Time in which the binary was first submitted to VirusTotal
C: AV Features
C.1 AV-Detection Number of AV that flag the samples as malicious (according to VirusTotal) C.2 AV-Labels List of AV labels associated to the sample (according to VirusTotal)
D: User-based Features
D.1 User Agent User agent of the browser used to submit the sample D.2 Languages Languages accepted by the user browser
(according to theaccept-languageHTTP header)
D.3 IP IP address of the user who submitted the file D.4 IP Geolocation Geolocation of the user IP address
D.5 Email address Optional email address specified when the sample was submitted
D.6 Proxy Boolean value used to identify submission through popular anonymization proxies
E: Binary Features
E.1 N.Sections Number of sections in the PE file
E.2 N.Fuctions Number of functions identified by the disassembly
E.3 Code Coverage Fraction of.textsegment covered by the identified functions
E.4 Programming Language Programming language used to develop the binary E.5 Metadata Filenames and username extracted from the PE file
F: Behavioral Features
F.1 Duration Duration in seconds of the analysis F.2 Errors Error raised during the analysis
F.3 Evasion Known anti-sandbox techniques detected by the sandbox itself
F.4 Behavior Bitstring Sequence of 24 boolean flags that characterize the behavior of the sample. (has popups,has udp traffic,has http,has tcp address scan, modified registry keys, . . . )