Bulletin of the Geological Society of Greece
Vol. 47, 2013
Producing landslide susceptibility maps by
applying expert knowledge in a GIS - based
environment.
Tsangaratos P.
National Technical University
of Athens, School of Mining
and Metallurgical
Engineering, Department of
Geological Studies
Rozos D.
National Technical University
of Athens, School of Mining
and Metallurgical
Engineering, Department of
Geological Studies
https://doi.org/10.12681/bgsg.10993
Copyright © 2016 P. Tsangaratos, D. Rozos
Δελτίο της Ελληνικής Γεωλογικής Εταιρίας, τομ. XLVII , 2013 Πρακτικά 13ου Διεθνούς Συνεδρίου, Χανιά, Σεπτ. 2013
Bulletin of the Geological Society of Greece, vol. XLVII 2013 Proceedings of the 13th International Congress, Chania, Sept. 2013
PRODUCING LANDSLIDE SUSCEPTIBILITY MAPS BY
APPLYING EXPERT KNOWLEDGE IN A GIS – BASED
ENVIRONMENT
Tsangaratos P.
1and Rozos D.
11 National Technical University of Athens, School of Mining and Metallurgical Engineering,
Department of Geological Studies, [email protected], [email protected]
Abstract
In this paper two semi - quantative approaches, from the domain of Multi criteria decision analysis, such as Rock Engineering Systems (RES) and Analytic Hierarchi-cal Process (AHP) are implemented for weighting and ranking landslide related fac-tors in an objective manner. Through the use of GIS these approaches provide a highly accurate landslide susceptibility map. For this purpose and in order to auto-mate the process, the Expert Knowledge for Landslide Assessment Tool (EKLATool) was developed as an extension tightly integrated in the ArcMap environment, using ArcObjects and Visual Basic script codes. The EKLATool was implemented in an area of Xanthi Prefecture, Greece, where a spatial database of landslide incidence was available.
Key words:ArcObjects, Landslide Assessments, Multi – Criteria decision analysis,
Rock Engineering Systems, Analytical Hierarchal Process.
Περίληψη
Στην εργασία αυτή εφαρμόζονται δυο ημι – ποσοτικές προσεγγίσεις, από το πεδίο των πολυκριτηριακών μεθόδων ανάλυσης, η Rock Engineering System (RES) και η Ana-lytic Hierarchical Process (AHP), για τον υπολογισμό και την κατάταξη των παραμέρτων που σχετίζονται με το φαινόμενο των κατολισθήσεων. Για το σκοπό αυτό και για την αυτοματοποίηση της διαδικασίας, δημιουργήθηκε ένα υπολογιστικό εργαλείο, το Expert Knowledge for Landslide Assessment Tool (EKLA-Tool) ως δυναμική επέκταση του λογισμικού πακέτου ArcMap. Για την κατασκευή του γράφτηκε σχετικός πηγαίος κώδικας με την βοήθεια της γλώσσας Visual Basic και των εργαλείων ArcObjects που βρίσκονται ενσωματωμένα στο λογισμικό Γεωγραφικών Συστημάτων Πληροφοριών, ArcMap. Η επέκταση εφαρμόστηκε στην περιοχή του νομού Ξάνθης, όπου υπήρχε διαθέσιμη σχετική χωρική βάση δεδομένων με καταγραφές κατολισθητικών φαινομένων. Λέξεις κλειδιά:ArcObjects, Κατολισθητική επιδεκτικότητα, Γεωγραφικά Συστήματα Πληρoφοριών, Πολυκριτηριακές μέθοδοι ανάλυσης.
1.
Introduction
Natural disasters result from the interaction of physical impact and human or environmental vulnerability (Burton et al., 1993). Landslides are identified as geophysical and hydrological disasters referred to as unexpected and unpredictable movement, usually on unstable surface layers,
making them one of the most frequent natural hazards with significant consequences to human life and incalculable social - economic consequences (Schuster, 1996, Aleotti & Chodwdhury, 1999). In most cases the complexity of the causative and triggering factors, their unknown interrelationship and the lack of knowledge, makes the analyses of such phenomena a very demanding task (Gokceoglu et al., 2005). Landslide susceptibility is the likelihood of a landslide occurring in an area on the basis of local terrain conditions (Brabb, 1984). It is the degree to which a terrain can be affected by slope movements, i.e., an estimate of “where” landslides are likely to occur. As reviewed through the literature, there is no agreement on the methods for susceptibility maps production as several qualitative and quantitative methods have been proposed for landslide susceptibility evaluation. Reviews on these techniques and methodologies are given by numerous researchers (Carrara et al., 1995, Aleotti & Chodwdhury, 1999, Guzzetti et al., 1999, Dai et al., 2002, Glade et al., 2005). According to van Westen (1997), a landslide susceptibility analysis involves essentially four main phases: (a) the production of a landslide inventory map, (b) the assessment of event – controlling factors that influence the landslide manifestation, (c) the application of appropriate methods for determining the weights of each factor and (d) the compilation of the landslide susceptibility map using a GIS procedure. Landslide susceptibility and hazard assessments often use Multi criteria decision analysis (MCDA) techniques since in most cases, the types and format of data that are available are qualitative and quantitative, therefore requiring a semi - quantitative method that incorporates both types of data (Ayalew & Yamagishi, 2005). In contrast to conventional MCDA, spatial multi-criteria decision analysis requires data on both criterion values and the geographical locations of alternatives. The data are processed using GIS and MCDA techniques to obtain information for making decisions. The most common approach involves obtaining expert opinion, such as Analytical Hierarchy Process and Rock Engineering System, to assigning weights and then combining weights additively by weighted linear combination (WLC) to produce landslide susceptibility maps (Park et al., 2004, Komac, 2006). These methods have been incorporated into a variety of GIS-based decision making procedures but in only a few GIS programs (e.g. IDRISI and ILWIS) (Eastman et al. 1993, Jankowski, 1995, Lai & Hopkins, 1995, Malczewski, 1999). According to Ozturk & Batuk (2011) although ArcGIS is one of the most widespread GIS software, MCDA procedures has not been fully implemented in the standard GIS functions. The main objective of this article is to present an Expert Knowledge for Landslide Assessment Tool, developed in the ArcGIS 9.3 environment, that utilizes the above referred two semi-quantitative methods, Analytical Hierarchy Process (AHP) and Rock Engineering System (RES) for determining landslide susceptibility.
2.
Materials and Methods
The most essential phase in a landslide susceptibility analysis is to establish a spatial database for landslides in a GIS environment, involving landslide inventory data and the landslide related factors. The use of GIS provides a powerful tool to model the landslide phenomena, since the collection, manipulation and analysis of the related data can be accomplished much more efficiently and cost effectively. All factors that contribute to landslide manifestation are collected and archived from a variety of qualitative or quantitative factors such as topographic characteristics (elevation, slope, aspect, curvature, relief, etc.), hydrological features (river network, hydrographic density, wetness index, etc.), geological settings (lithology, faults, tectonic features, seismicity, etc.), and environmental conditions (precipitation and temperature, land use, land cover and other anthropogenic factors). Following the construction of the GIS database, the analysis continues with the selection of the appropriate method for deriving the weight assigned to each factor. The selection of the appropriate method is based on the availability, quality of the data and desired output. The focus of our study is on MCDA techniques that are introduced for solving the problem of weighting the related landslide factors. Specifically, two semi-quantitative landslide assessment approaches, RES and AHP where applied. These techniques can be considered as an effective expert’s tools for weighting and ranking the chosen parameters in an objectively optimal and simple way (Barthelos et al., 2009, Rozos et al., 2011). In the following sections (2.1, 2.2, 2.3
and 2.4) a brief description of the main tools and methods that were utilized though the developed methodology are presented.
2.1.
Rock Engineering System
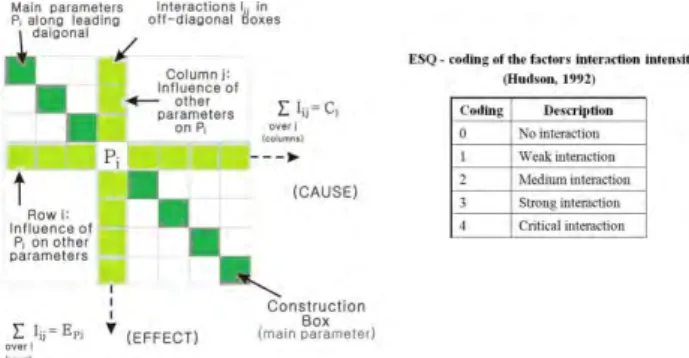
The Rock Engineering System (RES) has been developed in the early 90' as a semi-quantitative technique to approach increasingly complex rock engineering problems (Hudson, 1992). The implementation of RES is achieved through the use of an interaction matrix. The concept of an interaction matrix dates from the 1970s (Leopold et al., 1971) when it was used to evaluate the cause-and-effect relationship between existing (environment/natural) factors and human actions. Since then it has been modified and applied to rock stability problems (Hudson, 1992, Hudson & Harrison, 1992, Mazzoccola & Hudson, 1996), landslide susceptibility and hazard analysis (Pachauri & Pant, 1992, Golceoglu & Aksoy, 1996, Turrini & Visintainer, 1998, Donati & Turrini, 2002, Rozos et al., 2006, 2008), rock engineering (Benardos & Kaliampakos, 2004). Parameter interactions can be evaluated using a matrix display and are presented using a clockwise convention, as they might be path independent as shown in Figure 1 (Hudson, 1992). All factors that influence the studied system are arranged along the main diagonal of the interaction matrix, while the influence of each individual factor on each other corresponds to the off-diagonal values. To quantify the varying importance of the interactions, a coding method is required. Hudson (1992) proposed an expert semi-quantitative (ESQ) method shown in Figure 1.
Figure 1 – The Interaction Matrix and the ESQ coding.
The influence of each parameter on the system (named cause, C) and the influence of the system on each parameter (named effect, E) are presented in an external row and column, respectively. The interactive intensity, which equals the addition of C and E, is transformed into a percentage format acting as weighting coefficients, which express the proportional share of each parameter (as failure causing factor) in slope failure and standardized by dividing with the maximum rating, giving the weight according to Equation 1.
Equation 1 – weighting coefficient % ) ( 4 1 1 1
n i n i i E C E C FwA careful compilation of the interaction matrix optimizes the expert’s judgment and eventually the resulting weighting coefficients are expressing the maximum possible objectivity, which can be revealed from a given experience.
2.2.
Analytical Hierarchy Process
The AHP method is used in this study to systematically assign preferences based on Saaty’s proposal (Saaty, 2000). The AHP reduces the complexity of a decision problem to a sequence of
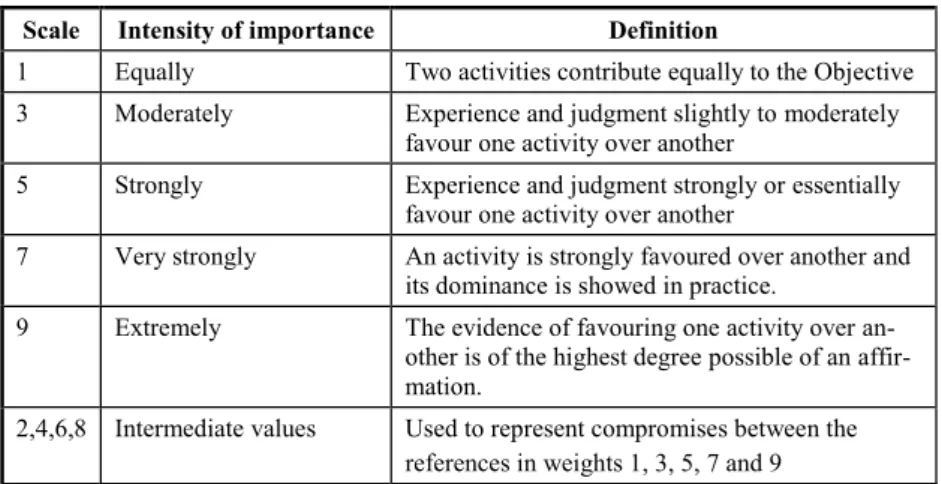
pair-wise comparisons which are synthesized in an interaction matrix. The AHP method constructs a hierarchy of decision criteria and through the pair-wise comparison of each possible criterion pair a relative weight for each decision criterion is produced. Each comparison is a two-part question determining which criterion is more important, and how much more important, using a numerical relational scale (Table 1).
Table 1 - Scale of importance between two parameters in AHP (Saaty, 2000).
Scale Intensity of importance Definition
1 Equally Two activities contribute equally to the Objective 3 Moderately Experience and judgment slightly to moderately
favour one activity over another
5 Strongly Experience and judgment strongly or essentially favour one activity over another
7 Very strongly An activity is strongly favoured over another and its dominance is showed in practice.
9 Extremely The evidence of favouring one activity over an-other is of the highest degree possible of an affir-mation.
2,4,6,8 Intermediate values Used to represent compromises between the references in weights 1, 3, 5, 7 and 9
By applying AHP, one has the ability to evaluate pair-wise rating inconsistency. The eigenvalues enable to quantify a consistency measure which is an indicator of the inconsistencies or intransitivities in a set of pair-wise ratings. Saaty (2000) proved that for a consistent reciprocal matrix, the largest eigenvalue λmax is equal to the number of comparisons n. A measure of
consistency, called consistency index CI, is defined as follows (Equation 2):
Equation 2 – Consistency Index (CI) 1 max n n CI
Saaty (2000) randomly generated reciprocal matrixes using scales 1/9, 1/8,…, 1, …, 8, 9 to evaluate a so called random consistency index RI. Saaty (1977) also introduced a consistency ratio CR, which is a comparison between the consistency index and the random consistency index. Since human judgments can violate the transitivity rule and thus cause an inconsistency, the consistency ratio (CR) is computed to check the consistency of the conducted comparisons (Equation 3).
Equation 3 – Consistency Ration (CR)
RI CI CR
If the value of the consistency ratio is smaller or equal to 10%, the inconsistency is acceptable, otherwise if the consistency ratio is greater than 10%, the subjective judgment needs to be revised (Saaty, 1977). After formatting the matrix, the numerical values must be normalized by diving each entry in a column by the sum of all the entries in that column, so that they output sums up to 1. Following normalization, the values are averaged across the rows, in order to give the relative importance weight for each parameter. Because of its simplicity and robustness in obtaining weights and integrating heterogeneous data, the AHP has been used in a wide variety of applications, including multi-attribute decision making, total quality management, suitability
analysis, resource allocation, conflict management, and design and engineering (Vargas, 1990, Jiang & Eastman, 2000, Vaidya & Kumar, 2004).
2.3.
Estimating the Landslide Susceptibility Index
The next phase is to combine all the weighted factors by using the Weighted Linear Combination (WLC) method in order to produce the landslide susceptibility map. WLC is one of the best known and most commonly used MCDA methods (Malczewski, 1999, Ayalew et al., 2004). In the procedure for MCDA using WLC, it is essential the weights of the factors to have a sum of 1 and also the classes of each factor to be standardized to a common numeric range. The rating of the classes within each factor was based on the relative importance of each class obtained from field and expert knowledge according to the obvious relationship between each conditioning factor and the spatial distribution of the landslides in the research area. To standardize the classes to a uniform susceptibility rating scale, the formula of Equation 4 has been applied.
Equation 4 – standardized rank values
) min( )] ( min( ) [max( ) min( ) max( )) min(
( newRange newRange newRange
oldValue oldValue oldValue oldValue newValue
where, min (newRange) = 0.1, and max (newRange) = 1.0.
By applying the WLC method, the weight value assigned for each factor was multiplied by the standardized rank values given to the classes and numerically added according to Equation 5 in order to produce a Landslide Susceptibility Index (LSI) map. Each pixel of the final landslide
susceptibility map, obtained a value that ranged between 0.1 and 1, whereas 0.1 corresponds to the most stable conditions and 1 corresponds to the most critical value of slope instability.
Equation 5 – Landslide susceptibility index (Lsi) for each pixel Fj k n j j pi Fw c LSi
1where pi the ith pixel, Fw
j the weight of the jth factor and cfj the standardized ratings of class kth of
the jth factor.
To complete the analysis, a validation procedure follows, according to which the actual location of landslides are superimposed on the landslide susceptibility map. The performance of the method is estimated by implementing the simple rule:
IF the actual location of a landslide is within the High and Very High Landslide Susceptibility Zone THENLp = 1 ELSELp = 0
The accuracy the method is calculated through Equation 6 as follows:
Equation 6 –Estimating the accuracy of the method applied % 100 1 x n Lp uracy OverallAcc n i i
where, n is the total number of landslide events in the entire area.
2.4.
The ArcGIS Environment and ArcObjects
The main core of the developed tool is the ESRI's ArcGIS software. ArcGIS, is a Geographic Information System (GIS) for working with maps and geographic data and information. It is used for creating and using maps, compiling geographic data, analyzing mapped information, sharing and discovering geographic information, using maps and geographic data and information in a
range of applications, as well as managing geographic information in a database. The system is based on a common library of shared GIS software components called ArcObjects (Burke, 2003). ArcObjects include “objects” like data frames, layers, features, tables, cartographic symbols, and the pieces that make up these “objects”: points, lines, polygons, records, fields, colors, and so on. They provide a way to integrate GIS with external models and is thought as powerful tool for customizing any application that serves specific needs (Zeiler, 2001).
The Expert Knowledge for Landslide Assessment Tool (EKLATool) extension is tightly integrated in the ArcMap environment. The tool is developed as an ArcMap 9.3 extension, using ArcObjects and Visual Basic script codes. The EKLATool manipulates with raster-based data sets allowing users to input raster layers, execute multi-criteria decision analysis functions, and present the analysis outputs as a layer map in ArcMap environment. EKLATool includes five main proce-dures: (a) reclassify and standardize input layers, (b) choosing the appropriate multi-criteria analysis method, (c) calculate weights, (d) produce the landslide susceptibility map and (e) valida-tion procedures.
3.
Case Study
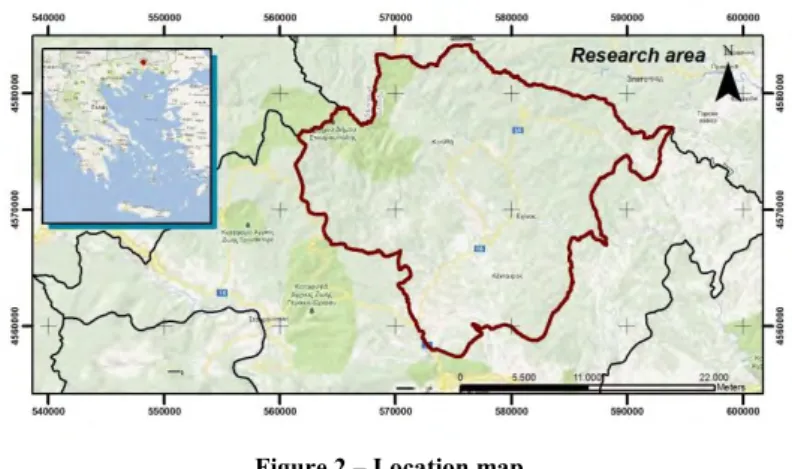
This section presents a case study to determine the landslide susceptibility using the Expert Knowledge for Landslide Assessment Tool. The study area concerns the wider area of the Perfection of Xanthi, bounded to the north by the Greek-Bulgarian borders and extended to the south up to the Neogene Thrace basin (Figure 2).
Figure 2 – Location map.
Regarding the geological structure, the study area consists of four units: (i) a marble unit (marbles and schists), (ii) a gneissic unit (magmatites, gneisses, amphibolites and ultra mafic rocks) of Palaeozoic age, (iii) a Tertiary unit (mollasic formations) and (iv) a unit from igneous rocks. The elevation values of the entire research area, varied between 30 to 1800 m approximately. From a morphological point of view, the area is characterized as mountainous and the dominant drainage pattern is dendritic.
3.1.
Estimating the Landslide Susceptibility Index
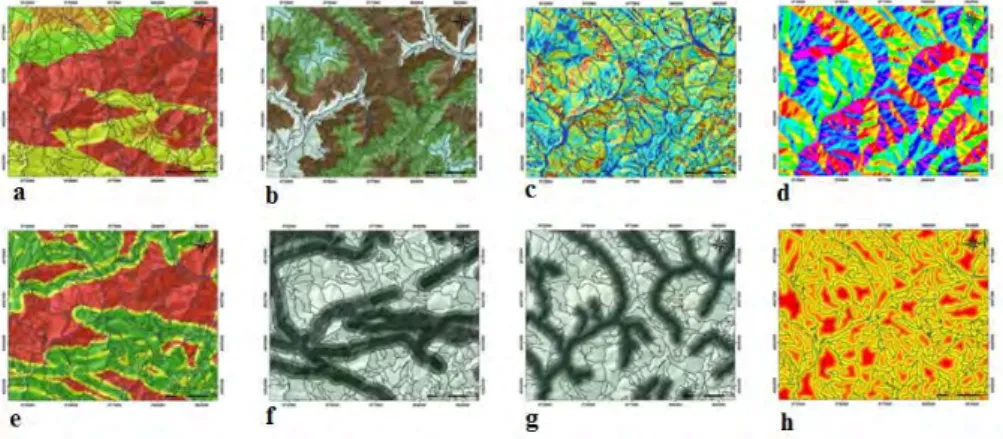
First, the effective factors causing landslide instability problems were evaluated and accordingly eight evaluation factors were taken into account in this study: lithology, elevation, slope, aspect, distance to river network, distance to tectonic characteristics, distance to geological boundary, and distance to road network (Figure 3).
Figure 3 – The causative factors, a. lithology, b. elevation, c. slope, d. aspect, e. distance to geological boundary, f. distance to tectonic characteristics, g. distance to road network, h.
distance to river network.
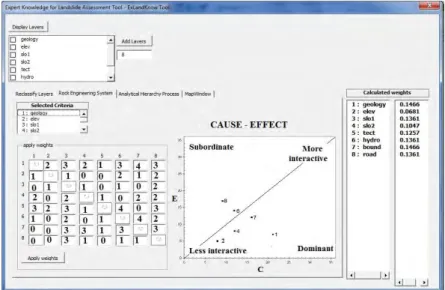
Since the factors greatly differ from each other, a uniform coding technique was adopted. Accordingly, each factor was classified into different categories that represent specific conditions and assigned with a value ranging from 0.1 to 1. The value 0.1 represents stable conditions, while the value 1 unstable conditions. The estimation of weights is made through the two methods RES and AHP, which combine all the relevant variables for the final calculation of landslide susceptibility with the help of the knowledge and experience of experts. Figure 4 and Figure 5 provide the weight coefficients of the eight factors used in the estimation of the landslide susceptibility by using the EKLATool for both of the methods.
Figure 5 – The interaction matrix and the weight coefficients of RES method.
The next phase of the procedure requires the linear correlation of the weight coefficients by applying the WLC method. The result of this procedure is the compilation of the final susceptibility maps as shown in figure 6.
(a) (b)
Figure 6 – The Landslide Susceptibility Maps: (a) AHP and (b) RES method.
The final phase of the procedure requires the evaluation of the performance by applying the simple rule and afterwards calculating the accuracy of the two methods using Equation 6.
4.
Results
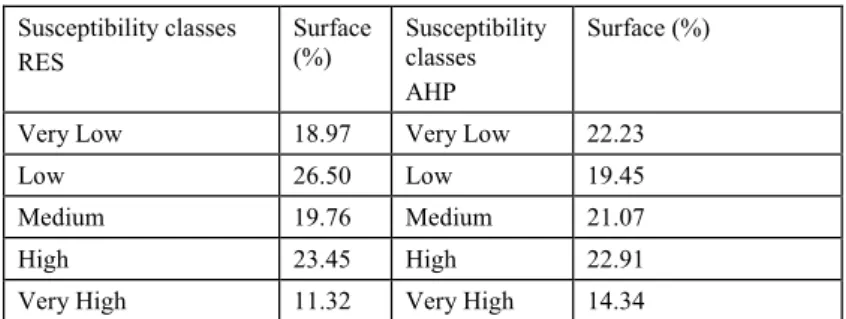
According to the AHP method the percentage of the high and very high landslide susceptibility zone is estimated to be 22.91% and 14.34 %, while according to the RES method the percentage of the same zones is estimated to be 23.34% and 11.32% (Table 2). Table 3 shows the estimated accuracy of the two methods. RES method performs better, as it shows a higher accuracy value than AHP. From a database of 67 previously recorded landslide events the 70.15 % (47 locations)
were correctly classified, as belonging to the high and very high landslide susceptibility zone by the AHP method.
Table 2 – Landslide Susceptibility Index – RES – AHP.
Susceptibility classes
RES Surface (%) Susceptibility classes AHP
Surface (%) Very Low 18.97 Very Low 22.23
Low 26.50 Low 19.45
Medium 19.76 Medium 21.07
High 23.45 High 22.91
Very High 11.32 Very High 14.34
The RES method correctly classified the 79.10 % (53 locations) of the same database. The outcome of the analysis seems to confirm previous studies that compared the performance of the two methods in estimating landslide susceptibility and gave a slight advantage of the RES method against AHP method (Rozos et al., 2011).
Table 3 – Overall accuracy RES – AHP.
Method of analysis n
n i1Lp
i Overall accuracy (%) AHP 67 47 70.15 RES 67 53 79.10From the analysis performed by the RES method it is concluded that the most interactive factor is lithology and the distance from the geological boundaries (W = 0.1466), while the less interactive is the elevation factor (W = 0. 0681). Also, the lithology with the highest cause value (21) is the parameter which dominates the system and the elevation with the lowest cause value (8) is dominated by the system. From the analysis performed by the AHP method it is also concluded that lithology play the most significant role as it receives a higher weight coefficient (W=0.3442), while the less significant appears to be the aspect (W=0.0252).
5.
Conclusion
The presented study focused on developing a tool that integrates Multi Criteria Decision Analysis techniques in a GIS environment for the estimation of landslide susceptibility. This approach was implemented with the usage of Visual Basic script codes in the ArcGIS environment. The tool has a range of multi-criteria evaluation capabilities including, criterion standardization, criterion weighting, decision making analysis and validation procedures. It provides access to functionality not available though the ArcMap interface, allowing the customisation of the interface for the end up users. More analytically, this study presents an application of GIS-based MCDA by applying Expert Knowledge for Landslide Assessment Tool to a real-world problem that involved determining landslide susceptibility in Xanthi Prefecture in Greece, by using two semi-quantitative methods, Analytical Hierarchy Process (AHP) and Rock Engineering System (RES). Both methods, AHP and RES, gave realistic results with an accuracy of 70.15 % and 79.10 %, respectively. The developed tool helped in managing landslide related factors in a much easier and automated manner, maximizing the functionality of GIS environment.
6.
References
Aleotti P. and Chowdury R. 1999. Landslide hazard assessment: summary review and new per-spectives, Bulletin of Engineering Geology and the Environment, 21- 44.
Ayalew L., and Yamagishi H. 2005. The application of GIS-based logistic regression for landslide susceptibility mapping in the Kakuda-Yahiko Mountains, Central Japan, Geomorphology,
65(1–2), 15–31.
Ayalew L., Yamagishi H. and Ugawa N. 2004. Landslide susceptibility mapping using GIS-based weighted linear combination, the case in Tsugawa area of Agano River, Niigata Prefecture, Japan, Landslides, 1, 73–81.
Bathrellos G.D., Kalivas P.D and Skillodimou H.D. 2009. GIS-based landslide susceptibility map-ping models applied to natural and urban planning in Trikala, Central Greece, Estudios Geológicos, 65(1): 49–65.
Benardos Α.G. and Kaliampakos D.C. 2004. A methodology for assessing geotechnical hazards for TBM tunneling - illustrated by the Athens Metro, Greece, International Journal of Rock Mechanics and Mining Sciences, vol. 41, no. 6, 987-999.
Brabb E.E. 1984. Innovative approaches to landslide hazard mapping. Proceedings of IV Interna-tional Symposiumof Landslides, Toronto, 1, 307-324.
Burke R. 2003. Getting to know ArcObjects: Programming ArcGIS with VBA. ESRI Press, Red-lands, CA.
Burton I., Kates R.W. and White G.F. 1993. The Environment as Hazard, 2nd edition, Guilford
Press, New York, 304 pp.
Carrara A., Cardinali M., Guzzetti F. and Reichenbach,P. 1995. GIS-based techniques for mapping landslide hazard, In A. Carrara and F. Guzzetti (eds), Geographical Information Systems in Assessing Natural Hazards, Kluwer Publications, Dordrecht, The Netherlands, 135–176. Dai F.C., Lee C.F. and Ngai Y.Y. 2002. Landslide risk assessment and management: an overview,
Engineering Geology, 64 (1), 65-87.
Donati L. and Turrini M. C. 2002. An objective method to rank the importance of the factors pre-disposing to landslides with the GIS methodology: application to an area of the Apennines (Valnerina; Perugia, Italy), Engineering Geology, 63, 277–289.
Eastman J.R., P.A.K. Kyem, and J. Toledano J. 1993. A procedure for Multi-Objective Decision Making in GIS Under Conditions of Competing Objectives, Proceedings EGIS'93, 438- 447.
Glade T., Anderson M. and Crozier M.J. 2005. Landslide Hazard and Risk, John Wiley & Sons, Ltd., Chichester, England, 802pp.
Gokceoglu C. and Aksoy H. 1996. Landslide susceptibility mapping of the slopes in the residual soils of the Mengen region (Turkey) by deterministic stability analyses and image pro-cessing techniques, Engineering Geology, 44, 147–161,
Gokceoglu C., Sonmez H., Nefeslioglu H.A., Duman T.Y. and Can T. 2005. The 17 March 2005 Kuzulu landslide (Sivas, Turkey) and landslide-susceptibility map of its near vicinity, Engi-neering Geology, 81 (1), 65-83.
Guzzetti F., Carrara A., Cardinali M. and Reichenbach P. 1999. Landslide hazard evaluation: a review of current techniques and their application in a multi-scale study, central Italy, Geo-morphology, 31, 181–216.
Hudson J.A. 1992. Rock engineering systems. Theory and practice, Ellis Horwood series in Civil Engineering, pp. 185.
Hudson J.A. and Harrison J.P. 1992. A new approach to studying complete rock engineering prob-lems, Quarterly Journal of Engineering Geology, 25, 93 – 105.
Jankowski P. 1995. Integrating geographical information systems and multiple criteria decision making methods, International Journal of Geographical Information System, 9(3), 251-273. Jiang H. and Eastman J.R. 2000. Application of Fuzzy Measures in Multi-Criteria Evaluation in
Komac M. 2006. A landslide susceptibility model using the analytical hierarchy process method and multivariate statistics in penialpine Slovenia, Geomorphology, 74(1–4), 17–28. Lai S.-K. and Hopkins L.D. 1995. Can Decision Makers Express Multi attribute Preferences Using
AHP and MUT? An Experiment, Environment and Planning B: Planning and Design, 22 (1), 21-34.
Leopold L.B., Clarke F.E., Manshaw B.B. and Balsley J.R. 1971. A Procedure for Evaluating En-vironmental Impacts, U.S. Geological Survey Circular, No. 645, Government Printing Of-fice, Washington, D.C.
Malczewski J. 1999. GIS and Multicriteria Decision Analysis, (John Wiley and Sons, New York, 1999).
Mazzoccola D.E and Hudson J.A. 1996. A comprehensive method of rock mass characterization for indicating natural slope instability, Quartile Journal Engineering Geology, 29, 37–56. Ozturk D. and Batuk E. 2011. Implementation of GIS-based multicriteria decision analysis with
VB in ArcGIS, International Journal of Information Technology & Decision Making, 10(6), 1023–1042.
Pachauri A.K. and Pant, M. 1992. Landslide hazard mapping based on geological attributes, Engi-neering Geology, 32, 81–100.
Park N.W., Chi K.H. and Kwon B.D. 2004. Application of fuzzy set theory for spatial prediction of landslide hazard, In Proceedings of the Symposium on Geoscience and Remote Sensing, vol. 5, 2988–2990.
Rozos D., Bathrellos G.D. and Skillodimou H.D. 2011. Comparison of the implementation of rock engineering system and analytic hierarchy process methods, upon landslide susceptibility mapping, using GIS: a case study from the Eastern Achaia County of Peloponnesus, Greece, Environmental Earth Sciences, 63(1), 49-63.
Rozos D., Pyrgiotis L., Skias S. and Tsagaratos P. 2008. An implementation of rock engineering system for ranking the instability potential of natural slopes in Greek territory. An applica-tion in Karditsa County, Landslides, 5, 261–270. doi:10.1007/s10346- 008-0117-4. Rozos D., Tsagaratos P., Markantonis K., and Skias S. 2006. An application of rock engineering
system (RES) method for ranking the instability potential of natural slopes in Achaia Coun-ty, Greece, In: Proc. of XIth international congress of the society for mathematical geology,
University of Liege, Belgium, S08-10.
Saaty T.L. 1977. A scaling method for priorities in hierarchical structures, J Math Psychol, 15, 234–281.
Saaty T.L. 2000. Fundamentals of Decision Making and Priority Theory with the Analytic Hierar-chy Process, 2nd Edn., RWS Publications, Pittsburgh, USA.
Schuster R.L. 1996. Socioeconomic significance of landslides, In: A.K. Turner & R.L. Schuster (E ditors), Landslides: Investigation and Mitigation, National Academic Press, Washington, D C, Special Report, 247, pp.12-36.
Turrini M.C. and Visintainer P. 1998. Proposal of a method to define areas of landslide hazard and application to an area of the Dolomites, Italy, Engineering Geology, 50, 255–265. Vaidya O.S. and Kumar S. 2004. Analytic Hierarchy Process: An overview of applications, Europ
ean Journal of Operational Research, Vol. 169, 1, 1–29.
van Westen, C., 1997. Statistical landslide hazard analysis. ILWIS 2.1 for windows application gui de. Enshede, The Netherlands, ITC Publication, N. 15, 73-84.
Vargas L.G. 1990. An overview of the analytic hierarchy process and its applications. European J ournal of Operational Research, 48, 2−8.