University of Huddersfield Repository
Radhi, Hazim Esmaeel Robust multicriteria optimisation of welded joints Original Citation Radhi, Hazim Esmaeel (2014) Robust multicriteria optimisation of welded joints. Doctoral thesis, University of Huddersfield. This version is available at http://eprints.hud.ac.uk/23726/ The University Repository is a digital collection of the research output of the University, available on Open Access. Copyright and Moral Rights for the items on this site are retained by the individual author and/or other copyright owners. Users may access full items free of charge; copies of full text items generally can be reproduced, displayed or performed and given to third parties in any format or medium for personal research or study, educational or notforprofit purposes without prior permission or charge, provided: • The authors, title and full bibliographic details is credited in any copy; • A hyperlink and/or URL is included for the original metadata page; and • The content is not changed in any way. For more information, including our policy and submission procedure, please contact the Repository Team at: E.mailbox@hud.ac.uk. http://eprints.hud.ac.uk/Robust Multi-criteria Optimisation of Welded Joints
HAZIM ESMAEEL RADHI
A Thesis submitted to University of Huddersfield in partial fulfillment of the
requirements for the degree of Doctor of Philosophy
University of Huddersfield
December 2014
HAZIM E. RADHI Page 2 ABSTRACT
Civilisation has depended on welded structures to facilitate production and improve the quality of life. Welds are used to create infrastructure upon which we rely, such as transportation, oil and gas piping, shipbuilding, bridges and buildings, and to produce the equipment that makes all of this happen. In short, the joining of two metals through welding has immensely contributed to our society.
A critical factor in the strength of welded joints is the geometry of the joints, and for this reason a robust optimisation of geometrical parameters of welded joints has been conducted in order to establish the optimum and most robust design in the presence of variation amongst geometrical parameters.
A parametric finite element analysis, using Python script, has been performed with the objective to investigate the effect of the welded joint parameters on the stress concentration factors under tensile and bending load. The results indicate that the parametric model, which is generated by Python script, can be used in a wide range of welded geometry, and has the capacity to reduce the time of computation. Additionally, an experimental study, including the geometrical identification of the welded joints, tensile test, hardness test and fatigue, has also been performed.
In order to select the best optimisation algorithms, different optimisation algorithms and performance metrics with various types of problem were examined in this study. The results from this part show the accuracy of Circumscription Metric (CM) in comparison to Pair wise Metric (PW) - which is used widely in optimisation studies. Furthermore, the results show that the Fast Multi-objective Optimisation Algorithm (FMOGA-II) outperformed other optimisation algorithms used during this study.
In this study, a new methodology for selecting the most robust designs from within the Pareto set has been developed. Finally, a traditional and robust optimisation of a butt welded joint has been performed by establishing a link between an optimisation software package and parametric finite element, the results of which show the ability of this approach to extract the robust optimal designs from the Pareto front.
HAZIM E. RADHI Page 3 DEDICATION
To the spirit of my father and mother who have given me all the support I need to be what I wanted to be and who have been sources of inspiration to me throughout my life;
To my brother and sisters for their encouragement and their support;
To my wife for her personal support, encouragement and great patience during the research period;
Finally, to my beloved children, Ali, Mayar and Hussien, who are the lights of my life;
HAZIM E. RADHI Page 4
ACKNOWLEDGEMENT
First, I would like to express my sincere gratitude to my supervisor, Dr Simon Barrans, for his instruction, encouragement, advice and support throughout my graduate education. Thanks for trusting me and my capabilities.
I would like to acknowledge the financial support given by the Iraqi Ministry of Higher Education and Scientific Research. The efforts made by the Iraqi embassy/cultural attaché to assist with the financial and administration issues of my scholarship are really appreciated.
I am very thankful to Mrs Gwen Wood and Mr Chris Sentance and Mrs Liz Rees at the school research office.
Many thanks to my friends and colleagues at Huddersfield University who supported me in all respects during my PhD research
Finally, my biggest appreciation goes to my family, who have always been the greatest motivation for me to work, study and to live my life.
HAZIM E. RADHI Page 5
Table of Contents
ABSTRACT ... 2 DEDICATION ... 3 ACKNOWLEDGEMENT... 4 TABLE OF CONTENTS ... 5 LIST OF FIGURES ... 9 LIST OF TABLES ... 13LIST OF ABBREVIATIONS AND SYMBOLS ... 15
1- CHAPTER ONE:INTRODUCTION ... 18
1.1 Motivation for the Research ... 18
1.2 Aim of Study... 19
1.3 Objective ... 20
1.4 Contribution to Knowledge ... 20
1.5 Structure of the Thesis ... 20
2- CHAPTER TWO: WELDING AND FATIGUE ... 23
2.1 Historical Background on Welding ... 23
2.2 Welded Joint Parameters... 25
2.2.1 Geometrical parameters of welded joint ... 25
2.2.2 Weld imperfections... 26
2.3 Optimisation of Welded Joints ... 27
2.3.1 Effects of welding parameters on metal properties ... 27
2.3.2 Effects of geometrical parameters on welded joints ... 31
2.4 Introduction to Fatigue ... 31
2.5 Fatigue Failure Stage... 32
2.6 Fatigue Crack Growth Rate ... 34
2.7 Fatigue Loading ... 36
2.8 Fatigue of Welded Joints ... 38
2.9 Conclusion ... 41
3- CHAPTER THREE:OPTIMISATION... 43
3.1 Introduction... 43
3.2 Historical Development ... 43
3.3 Optimisation Engineering Applications ... 45
HAZIM E. RADHI Page 6
3.4.1 Design variables ... 46
3.4.2 Design constraints ... 47
3.4.3 Objective function ... 49
3.5 Population-based Optimisation Methods ... 50
3.5.1 Simulated annealing optimisation... 50
3.5.2 Particle swarm optimisation ... 51
3.5.3 Genetic Algorithm ... 52 3.6 Multi-objective Optimisation ... 55 3.6.1 Problem definition ... 55 3.6.2 Handling Multi-objectives ... 55 3.6.3 Pareto dominance ... 56 3.6.4 Classical methods ... 57
3.6.5 Evolutionary multi-objective optimisation ... 58
3.7 Robust Optimisation... 60
3.7.1 Variability in reality... 60
3.7.2 Robust design ... 61
3.7.3 Robust multi-criteria optimisation ... 62
3.8 Conclusions... 64
4- CHAPTER FOUR:OPTIMISATION STUDY ... 66
4.1 Introduction... 66
4.2 modeFRONTIER Software ... 67
4.3 Initial Population Generation... 69
4.3.1 Design of Experiment (DoE) methods ... 69
4.3.2 Measuring discrepancy... 70
4.3.3 Sobol Design ... 70
4.4 Measurement of Algorithm Performance ... 71
4.4.1 Hit-Rate Metric (HR %) ... 71
4.4.2 Pair Wise Metric (PW) ... 72
4.4.3 Circumscription Metric (CM) ... 72
4.4.4 Performance of distribution metrics ... 74
4.5 Lifting Arm Case Study ... 77
4.5.1 Optimisation problem formulation ... 77
HAZIM E. RADHI Page 7
4.5.3 Optimisation with Genetic Algorithms. ... 86
4.6 Convex and Concave Case Studies ... 94
4.6.1 SCH problem ... 94
4.6.2 FON problem... 94
4.6.3 Results and discussion ... 95
4.7 Conclusion ... 99
5- CHAPTER FIVE:ROBUST OPTIMISATION ... 101
5.1 Introduction... 101
5.2 Case Study 1: Tank Design... 101
5.2.1 Sensitivity analysis ... 103
5.2.2 Optimisation problem parameters ... 104
5.3 Robust Optimisation of Lifting Arm Problem... 111
5.3.1 Approach 1 ... 111
5.3.2 Approach 2: ... 114
5.3.3 Approach 3: ... 115
5.4 Conclusion ... 125
6- CHAPTER SIX:FINITE ELEMENT METHOD... 127
6.1 Fundamentals of the Finite Element Method ... 127
6.1.1 Procedure of FEA ... 127
6.1.2 Abaqus Basics ... 128
6.2 Modelling the Welded Joint... 129
6.2.1 Welded joint parameters... 129
6.2.2 Material properties ... 131
6.2.3 Element Type ... 131
6.2.4 Load and Boundary Condition ... 132
6.2.5 Model development ... 133
6.3 Python Model Development ... 136
6.3.1 Python Programming language ... 136
6.3.2 ABAQUS Scripting Interface ... 136
6.3.3 Parametric model definition... 138
6.3.4 Parametric model test ... 140
6.4 Parametric Model Results ... 142
HAZIM E. RADHI Page 8
7- CHAPTER SEVEN:EXPERIMENTAL WORK ... 151
7.1 Test Specimen Preparation ... 152
7.2 Monotonic Tensile Testing ... 153
7.3 Hardness Test ... 156
7.4 Estimating the Geometrical Parameters of Welded Joints... 158
7.4.1 Estimation of welded Joint geometrical parameters by using dental moulding method ... 158
7.5 Fatigue Test ... 162
7.5.1 Test specimen ... 162
7.5.2 Fatigue testing ... 162
7.6 Conclusion ... 166
8- CHAPTER EIGHT:ROBUST OPTIMIZATION OF WELDED JOINTS ... 168
8.1 Introduction... 168
8.2 Integrating between modeFRONTIER and ABAQUS ... 168
8.2.1 Multi-objective Optimization of Two-bar Truss Problem ... 168
8.2.2 Multi-objective Optimization of Plate with Hole ... 178
8.3 Traditional Optimization of Welded Joints ... 183
8.3.1 Problem Formulation ... 183
8.3.2 Description of the Workflow ... 184
8.3.3 Performing Optimization ... 186
8.4 Robust Optimization of Welded Joints ... 189
8.4.1 The Problem Definition ... 190
8.4.2 Performing Optimization ... 192
8.5 Conclusion ... 196
9- CHAPTER NINE:CONCLUSIONS AND RECOMMENDATIONS FOR FURTHER WORK ... 199
9.1 Introduction... 199
9.1.1 Main conclusions ... 199
9.2 Recommendations for further work ... 200
REFERENCES ... 202
APPENDICES ... 209
APPENDIXA ... 209
APPENDIXB ... 228
HAZIM E. RADHI Page 9
List of Figures
Figure 1-1: M V Kurdistan tank failure (Grawood, 1997). ... 18
Figure 1-2: Disaster of the Alexander Kielland platform (Kristoffer, 2012). ... 19
Figure 1-3: Hydrophone holder welded into tubular bracing of the Alexander Kielland platform (Lotsberg, 2004) ... 19
Figure 2-1: Geometry of a butt weld (American Welding Society, AWS A3.0M/A 3.0:2010 and British Standard Institution BS EN ISO 9692-1:2013) ... 25
Figure 2-2: Defects of a butt welded joint ... 27
Figure 2-3: Fatigue stages on the fracture surface ... 34
Figure 2-4: Typical relationship between the crack growth rate and the range of stress intensity factor. ... 35
Figure 2-5: Nomenclature used in constant-amplitude loading (Wei & Pentti, 2003) ... 36
Figure 2-6: Comparison of R-rations for different loading (Barsom & Rolfe, 1999). ... 37
Figure 2-7: Variable-amplitude loading (Wei & Pentti, 2003) ... 37
Figure 2-8: Local approaches for fatigue assessment of welded joints. ... 38
Figure 2-9: Reinforcement angle influence on fatigue strength of butt welds (Chapetti, 2011) ... 40
Figure 3-1: Constraint surfaces ... 49
Figure 3-2: Genetic algorithm flow chart ... 53
Figure 3-3: Main concept of Pareto dominance in a two objective problem ... 57
Figure 3-4: Block diagram of the Product/Process (Bagchi, 1993). ... 61
Figure 3-5: A robust solution and optimal solution ... 62
Figure 4-1: General modeFRONTIER process of integration and optimisation modeFRONTIER document (2008) ... 68
Figure 4-2: Normalisation and mapping of design variables ... 69
Figure 4-3: Distribution of the scatter plot of (a) random sequence and (b) pseudo-random Sobol sequence in modeFRONTIER. ... 71
Figure 4-4: Comparison of traditional diversity indicators ... 73
Figure 4-5: Case 1: regular distributions of points ... 75
Figure 4-6: Case 2: regular distribution of points with changing the position of red points ... 75
Figure 4-7: Case 3: cluster distribution of points ... 76
Figure 4-8: Case 4: moderate clustering of points in two dimensions. ... 76
Figure 4-9: Case 5: heavy clustering of points in two dimensions. ... 77
Figure 4-10: Schematic diagram of the lifting arm (Ghurbal, 2003). ... 79
Figure 4-11: Variable and objective space for trial points generated by the Sobol sequence. ... 85
Figure 4-12: Definition of input and output design parameters in lifting arm problem. ... 86
HAZIM E. RADHI Page 10 Figure 4-14: Comparison of the Hit-Rate value for 64 sampling points with different
generations. ... 90
Figure 4-15: Comparison of the 5 generations results to the lifting arm problem by MOGA-II, ARMOGA, FMOGA-MOGA-II, NSGA-MOGA-II, MOPSO and MOSA. ... 91
Figure 4-16: Comparison of the 10 generations results to the lifting arm problem by MOGA-II, ARMOGA, FMOGA-MOGA-II, NSGA-MOGA-II, MOPSO and MOSA. ... 92
Figure 4-17: Comparison of the 15 generations results to the lifting arm problem by MOGA-II, ARMOGA, FMOGA-MOGA-II, NSGA-MOGA-II, MOPSO and MOSA. ... 93
Figure 4-18: The evaluated front from MOGA-II, ARMOGA, NSGA-II, FMOGA, MOSA and MOPSO for SCH problem. ... 97
Figure 4-19: The evaluated front from MOGA-II, ARMOGA, NSGA-II, FMOGA, MOSA and MOPSO for SCH problem. ... 98
Figure 5-1: Solution for the tank problem... 103
Figure 5-2: Robust optimisation of the tank problem in modeFRONTIER software ... 105
Figure 5-3: Spatial distribution of design variables in design space ... 106
Figure 5-4: History chart of objective function with 20% tolerance ... 107
Figure 5-5: History chart of objective function with 10% tolerance ... 107
Figure 5-6: History chart of objective function with 5% tolerance ... 108
Figure 5-7: History chart of objective function with 2.5% tolerance ... 108
Figure 5-8: Distribution of robust design table of FMOGA –II 100-10 with 20% tolerance ... 109
Figure 5-9: Distribution of robust design table of FMOGA –II 100-10 with 10% tolerance ... 110
Figure 5-10: Distribution of robust design table of FMOGA –II 100-10 with 5% tolerance ... 110
Figure 5-11: Distribution of robust design table of FMOGA –II 100-10 with 2.5% tolerance ... 111
Figure 5-12: Representation of Pareto front approximation ... 113
Figure 5-13: Pareto front with (+5%,-5%) constraint line ... 113
Figure 5-14: Pareto front with (+20%,-20%) constraint line ... 114
Figure 5-15: Robust optimisation of lifting arm problem in modeFRONTIER software ... 116
Figure 5-16: Distribution of Pareto robust design in design space for cases (1, 2 and 3)... 119
Figure 5-17: Relation between standard deviation of (objective1, objective2) for cases (1, 2 and 3) ... 119
Figure 5-18: Distribution of Pareto robust design in design space for case (4)... 120
Figure 5-19: Relation between standard deviation of (objective1, objective2) for case (4) ... 120
Figure 5-20: Distribution of Pareto robust design in design space for case (5)... 121
Figure 5-21: Relation between standard deviation of (objective1, objective2) for case (5) ... 121
Figure 5-22: Distribution of Pareto robust design in design space for case (6)... 122
HAZIM E. RADHI Page 11
Figure 5-24: Distribution of Pareto robust design in design space for case (7)... 123
Figure 5-25: Relation between standard deviation of (objective1, objective2) for case (7) ... 123
Figure 5-26: Distribution of Pareto robust design in design space for case (8)... 124
Figure 5-27: Relation between standard deviation of (objective1, objective2) for case (8) ... 124
Figure 6-1: Abaqus stages of analysis Abaqus (2008) ... 129
Figure 6-2: Geometry of butt welded joint ... 130
Figure 6-3: Abaqus element naming convention ... 131
Figure 6-4: Welded joint under a) tensile load; and b) bending load ... 133
Figure 6-5: Mesh convergence study of welded joint under tensile loading ... 134
Figure 6-6: Mesh distribution and stress contour plot of joint under tensile loading... 135
Figure 6-7: Mesh distribution and stress contour plot of joint under bending loading ... 135
Figure 6-8: Abaqus scripting flow chart (Abaqus 2010a) ... 137
Figure 6-9: Model generation of butt welded joint in Abaqus (Agarwal, 2011) ... 139
Figure 6-10: Mesh distribution and stress contours of case-1 ... 141
Figure 6-11: Mesh distribution and stress contours of case-2 ... 141
Figure 6-12: Relation between weld toe radius and stress concentration factor (SCF) ... 145
Figure 6-13: Relation between weld toe angle and stress concentration factor (SCF) ... 145
Figure 6-14: Relation between upper, lower reinforcement and stress concentration factor (SCF) ... 146
Figure 6-15: Relation between weld toe radius and stress concentration factor (SCF) ... 148
Figure 6-16: Relation between weld toe angle and stress concentration factor (SCF) ... 148
Figure 6-17: Relation between upper, lower reinforcement and stress concentration factor (SCF) ... 149
Figure 7-1: Layout of experimental work ... 151
Figure 7-2: Location of test specimens for a butt weld in plate ... 152
Figure 7-3: Geometry of tensile test specimen (EN ISO 6892-1:2009) ... 153
Figure 7-4: Instron (3369) tensile testing machine ... 154
Figure 7-5: Mechanical behaviour of steel S355JR... 155
Figure 7-6: Microhardness machine Buehler 1600-6100 (left), and close up of specimen (right). ... 156
Figure 7-7: Hardness profile of butt welded joint ... 157
Figure 7-8: Dimension of butt welded joints: weld height h, weld width w, weld toe radius , and weld toe angle α. ... 158
Figure 7-9: Equipment used in geometrical estimation of welded joints ... 159
Figure 7-10: Dental moulding cement procedure ... 159
HAZIM E. RADHI Page 12
Figure 7-12: Fatigue test specimen ... 162
Figure 7-13: Fatigue testing machine ... 163
Figure 7-14: Characteristic fatigue strength S-N curves. ... 164
Figure 7-15: Examples of failure specimens... 165
Figure 7-16: Examples of fatigue failure stages ... 166
Figure 8-1: A two beam structure with a load F. ... 169
Figure 8-2: Pareto front of the two-bar truss problem... 170
Figure 8-3: Input variable-node Settings, the variable can be set as constant or variable. ... 171
Figure 8-4: Settings for the Input file-node. ... 171
Figure 8-5: Input file-node editor. ... 172
Figure 8-6: DOS-node properties, at the button Edit DOS Batch Script commands are written. ... 173
Figure 8-7: Abaqus-node properties. ... 174
Figure 8-8: Odb-file Introspection at the Abaqus-node. ... 175
Figure 8-9: Objective-node properties. ... 176
Figure 8-10: Pareto front of the two-bar truss problem... 177
Figure 8-11: Three Pareto optimal solutions provided by modeFRONTIER. ... 177
Figure 8-12: Dimension of the plate. ... 178
Figure 8-13: modeFRONTIER workflow for plate with hole problem ... 179
Figure 8-14: Three- case study according to the mesh size ... 180
Figure 8-15: Pareto frontier of case 1 with (1117 elements) ... 181
Figure 8-16: Pareto frontier of case 2 with (2253 elements) ... 181
Figure 8-17: Pareto frontier of case 3 with (3113 elements). ... 182
Figure 8-18: Geometry of welded joint. ... 183
Figure 8-19: Workflow modeFRONTIER of welded joint problem. ... 185
Figure 8-20: Constraint node setting. ... 186
Figure 8-21: Tensile stress vs. bending stress. ... 188
Figure 8-22: Representation of Pareto front with different levels of constraints. ... 189
Figure 8-23: The multi-objective robust design optimization work flow. ... 190
Figure 8-24: The scheduler node properties. ... 191
Figure 8-25: Radar chart for Case-1 ... 195
Figure 8-26: Radar chart for Case-2 ... 195
HAZIM E. RADHI Page 13
List of Tables
Table 2-1: A brief history of welding ... 23
Table 3-1: Basic concepts of Simulated Annealing... 50
Table 3-2: Nomenclature of Particle Swarm Optimisation ... 52
Table 4-1: Results of comparison between Circumscription and Pair-wise Metrics ... 75
Table 4-2: Optimisation routine output for 16 trial points generated by Sobol ... 82
Table 4-3: Performance measures of MOGA-II, ARMOGA, NSGA-II, MOSA, FMOGA-II and MOPSO algorithms for lifting arm problem showing the values of Hit-Rate (HR%) Pair-Wise (PW) and Circumscription (CM) Metrics ... 89
Table 4-4: Performance measures of MOGA-II, ARMOGA, NSGA-II, FMOGA-II, MOSA and MOPSO for SCH and FON problems showing the values of Hit-Rate (HR %) and Circumscription (CM) Metric ... 96
Table 5-1: General parameters of tank problem ... 105
Table 5-2: Results of tank problem ... 106
Table 5-3: Traditional optimisation of lifting arm problem parameters ... 112
Table 5-4: Robust optimisation of lifting arm problem parameters ... 112
Table 5-5: Approximation of Pareto front and constraint lines ... 112
Table 5-6: Robust optimisation results for the first and second approach ... 117
Table 5-7: Robust optimisation results for the third approach ... 118
Table 6-1: Geometrical parameters of butt welded joint... 130
Table 6-2: Material properties of steel S355JR ... 131
Table 6-3: Equation for extracting x and y coordinates of welded joint geometry ... 139
Table 6-4: Range of geometric parameters ... 142
Table 6-5: Geometric parameters of welded joint under tensile load ... 144
Table 6-6: Geometric parameters of welded joint under bending load ... 147
Table 7-1: Dimension of 3 tensile test specimens (EN ISO 6892-1:2009). ... 154
Table 7-2: Mechanical properties of steel S355JR ... 155
Table 7-3: Micro hardness results of butt welded joint ... 157
Table 7-4: Estimation results of 11 welded joints ... 161
Table 7-5: Fatigue test results ... 164
Table 8-1: Input and output variables name in modeFRONTIER software ... 185
HAZIM E. RADHI Page 14
Table 8-3: Initial and optimized design parameters ... 187
Table 8-4: Pareto front with constraint... 189
Table 8-5: Input design parameters of three cases... 193
Table 8-6: Robust design parameters of three cases... 194
HAZIM E. RADHI Page 15
List of abbreviations and symbols
ANNs Artificial neural networks
ARMOGA Adaptive range Multi-objective Genetic Algorithm ASTM American Society for Testing and Materials AWS American welding society
BS British Standard
C m
Crack growth rate coefficient
CM Circumscription metric
DoE Design of experiment
E Modulus of elasticity
FCG Fatigue crack growth
FCG Fatigue crack growth
FE Finite element
FEA Finite element analysis
FEM Finite element method
FMOGA-II Fast Multi-objective Genetic Algorithm FSW Friction stir welding
GA Genetic Algorithm
GMA Gas metal arc welding
GTAW Gas tungsten arc welding
HAZ Heat affected zone
HV, HB Vickers and Brinell hardness IIW International institute of welding LEFM Linear elastic fracture mechanics MOGA-II Multi-objective Genetic Algorithm
MOPSO Multi-objective Particle Swarm Optimisation MOSA Multi-objective Simulated Annealing
PM Parent material
PW Pair wise metric
R Stress ratio
SCF Stress concentration factor
HAZIM E. RADHI Page 16
t Plate thickness
TIG Tungsten inert gas
WM Weld metal
α Weld toe angle
ν Poisson’s ration
ρ Weld toe radius
σ a Stress amplitude
σ m Mean stress
σ max Maximum stress
σ min Minimum stress
σ y Yield stress
∆K Range of stress intensity factor
Chapter 1
HAZIM E. RADHI Page 18 1- Chapter One: Introduction
1.1 Motivation for the Research
Welding is the most dominant joining method involved in the manufacturing process of all components of structures, such as pressure vessels for nuclear power plants, oil and gas pipelines, submarines, and rocket engines in the aerospace industry; it is also the main source of failure occurring in components.
The assessment of welded joints is the most important problem seen to arise in the industrial field because the weld is the governing factor in the life expectancy of structures. Welded joints are the source of weakness in structures, and therefore need to be fully investigated in order to improve the service life of the structures.
The critical problem in the assessment of welded joints is the difficulty associated with specifying the weld geometry in a manner that is sufficiently simple for industrial use but sufficiently precise for analysis.
Importantly, the failure of welded joints can have several consequences, both human and economical. One such example, which occurred on March 15, 1979, involved the British motor tanker Kurdistan, which broke in two, en route from Nova Scotia to Quebec. The defective butt weld in the port bilge keel was the origin of the crack (see Figure 1-1). There was a lack of penetration in the butt weld and where the bulb plate overlapped the underside of the ground bar.
HAZIM E. RADHI Page 19 The collapse of the off-shore platform Alexander Kielland was the second famous accident, as shown in Figure 1-2. The hydrophone holder welded into tubular bracing- which is known to represent the important structural member of Alexander Kielland- is one example of welded pipe penetration where fatigue failure became catastrophic for the platform.
The investigation showed that a fatigue crack had propagated from the double fillet weld near the hydrophone mounted to the tubular bracing (see Figure 1-3). Lotsberg, I. (2004)
Figure 1-2: Disaster of the Alexander Kielland platform (Kristoffer, 2012).
Figure 1-3: Hydrophone holder welded into tubular bracing of the Alexander Kielland platform (Lotsberg, 2004)
1.2 Aim of Study
Product performance is, now more than ever, a critical requirement for success in manufacturing and production; however, significant uncertainty exists in geometrical parameters of welded
HAZIM E. RADHI Page 20 joints, such as weld toe radius, weld toe angle, upper and lower reinforcement and plate thickness which are critical to system performance.
The aim of this project is to create a robust design of welded joints which is good in terms of performance, and which is insensitive to design parameter variations under different types of loads (tensile and bending).
A few experimental results and the finite element model gave further insight into the factors affecting the fatigue life of welded joints.
1.3 Objective
The aim of this work was to produce a methodology for the robust design of butt welded joints. This has been broken down into the following objectives:
To determine the current state-of-the-art weld geometry optimisation approaches. To identify the most appropriate tool for multi-criteria structural optimisation.
To implement a method of embedding finite element analysis within an optimisation tool. To devise a method of identifying robust designs from within the Pareto set for
multi-criteria problems.
1.4 Contribution to Knowledge
The major contributions to knowledge described in this thesis are:
The development of a new methodology for selecting the most robust designs from within the Pareto set so as to ensure the design is both robust and optimum
Evidence to indicate that the Circumscription Metric (CM) is superior to the Pair Wise metric (PW), particularly for optimisation carried out using genetic algorithms.
1.5 Structure of the Thesis
This thesis presents the detailed results of the author’s work over a PhD research programme, which was aimed towards achieving the objective of the research. It includes a detailed literature review of the research project, a numerical simulation and an experimental study. The thesis is divided into the following nine chapters.
HAZIM E. RADHI Page 21 Chapter One: Presents the motivation behind the research problem, along with the objectives and structure of the thesis.
Chapter Two: Provides a general background to welding, welded joint parameters, optimisation of welded joints, fatigue, fatigue loading and the fatigue of welded joints
Chapter Three: Presents a detailed description of the optimisation method, which includes introduction, historical development and engineering applications. It will also describe the mathematical formulation of single and multi-criteria optimisation. This chapter will present different methods of optimisation, which includes classical methods and population-based evolutionary algorithms. Additionally, a mathematical formulation and description of a robust optimisation method will be presented in this chapter.
Chapter Four: Presents the optimisation software with initial population generation methods. Different assessment metrics are given in order to evaluate the performance of the optimisation algorithms that exist in the optimisation software. Two different types of problem are evaluated in this chapter with genetic algorithms.
Chapter Five: Introduces the philosophy of the robust optimisation with two application problems, the first one with single objective optimisation and the second with multi-criteria robust optimisation.
Chapter Six: Presents the finite element parametric study carried out to investigate the effects of several geometrical parameters on stress concentration factors in welded joints. A Python script of a welded joint model is developed in this chapter.
Chapter Seven: Introduces the experimental work, and comprises the monotonic tensile test, hardness test, geometrical estimation of the welded joints and the fatigue test.
Chapter Eight: The first part of this chapter presents the integration of the ABAQUS software and optimisation software with two detailed examples. The second part includes the traditional and robust multi-criteria optimisation of welded joints based on the model developed in Chapter Six and the values of geometrical parameters identified in Chapter Seven.
Chapter Nine: This chapter presents the conclusions of the research and makes suggestions for further work.
HAZIM E. RADHI Page 22
Chapter 2
HAZIM E. RADHI Page 23 2- Chapter Two: welding and Fatigue
2.1 Historical Background on Welding
Welding refers to the processes whereby metal parts are joined together. It is an essential process used in the manufacture of many different products made of metals. In fact, welding is well-known for its cost efficiency and long lasting results. Although welding can be used for all kinds of metals, there are some metals that are difficult to weld. This difficulty depends on the natural properties of metal materials. However, the process of welding has increasingly grown and developed because of its wide range of effective applications in industry (Cray, 1979). New welding methods have been invented while the earlier processes are still employed. Iron forge welding and diffusion bonding, for instance, are still reliable techniques of welding. In addition, the cold pressure welding method, which is currently applied in some aspects of modern industry, dates from the Bronze Age
.
A brief history of welding is indicated in Table 2-1.Table 2-1: A brief history of welding
In the mid-1800
The foundation of modern welding was laid by Sir Humphrey Davies of England with two discoveries:
1- Acetylene
2- The production of an arc between two electrodes of carbon From 1877
to 1903
A great number of inventions and discoveries, such as gas welding and cutting, arc welding, resistance welding
1905
In 1905, Pirani was first to use electron beams for fusion tests with metals (Schiller S. 1977). This technology used a beam of electrons that are accelerated by a high voltage and can so be used as a tool for treatment of materials such as in welding
1916
Oxyacetylene appeared as a more efficient welding method for copper, aluminium and steel. Howard B. C. (1998)
In 1920
In 1920, gas-shielded metal-arc welding (GMAW) was introduced to allow continuous welding with its inherently greater productivity, but was limited, especially in positional welding, by its lack of slag. (Nasir A. 2005).
HAZIM E. RADHI Page 24 1930
First appearance of gas tungsten arc welding (GTAW) in the USA in the late 1930s, where it was used for welding aluminium airframes. It was an extension of the carbon arc process, with tungsten replacing the carbon electrode. (Nasir A. 2005).
From 1943
The development of welding methods took on a quicker pace in the industries where metal products are manufactured (Lancaster, 1987).
1950
In the early 1950s, the first demonstration of ultrasonic metal welding process. It was found that ultrasonic vibrations were capable of creating a weld in metal parts without the need for melting the base metals. Howard B. C. (1998)
By 1953
Carbon dioxide was used by Lyubavski and Novoshilov to provide a shield gas for consumable electrodes welding. This method was widely used but it required high currents of electricity
1954-1957
Attempts to refine CO2 welding did not stop and new advances were made. In addition to the gas emitted from the wire, an external shield of gas was applied to yield a better method of welding called the dual shield. This method was originally invented by Bernard in 1954, but it was not used until 1957 that the method gained publicity.
1960
In 1960, DuPont filed the first internationally recognized patent on explosion welding technology (EXW), Cowan G. R. et al (1964). There was extensive research During the ensuing 20 years concerning this technology. In 1962 DuPont commercialized the explosion cladding industry, with the first major application being production of tri-layer coinage for the US government.
1970
Thus laser welding was announced almost simultaneously by three different suppliers of laser equipment who were seeking to expand their markets (Locke E. V. et al. 1972). Most laser beam welding is conducted by the output of either the neodymium-doped yttrium aluminium garnet (Nd:YAG) laser or carbon dioxide laser or both of these lasers, depending on the electrical excitation circuitry, can emit their output either continuously, as a single pulse, or as a repetitive series of pulses.
HAZIM E. RADHI Page 25 1991
In 1991 friction stir welding (FSW) was invented by Wayne Thomas at (The Welding Institute), and the first patent applications were filed in the UK in December 1991, and found high-quality application all over the world.
During the 1990s and continuing today, rapid changes are evolving in the welding industry as engineers devise more advanced filler metal formulas to improve arc performance and weld, it has shown that advancements are inevitable and will continue, such as state-of-the-art electrodes, exotic multiple gas mixes, hybrid processes, robotic welding and onboard computers. Ibrahim, K. (2007)
2.2 Welded Joint Parameters
The main factors that affect and control the fatigue strength of welded joints are weld profiles and weld imperfections.
2.2.1 Geometrical parameters of welded joint
The main parts of butt and fillet welded joints are indicated in Figure 2.1.
Figure 2-1: Geometry of a butt weld (American Welding Society,AWS A3.0M/A 3.0:2010 and British Standard InstitutionBS EN ISO 9692-1:2013)
HAZIM E. RADHI Page 26 The junction between the base metal and the face of the weld is called the weld toe, while the intersection between the parent metal and the back of the weld is called the weld root.
Ideally, the straight line between the weld toes forms the face of the weld. The throat thickness ‘a’ is the minimum distance between the weld root and the weld face. The portion of weld from the root to the toe is known as the leg or size of the weld
The heat affected zone (HAZ) is the part of the base metal which is below melting point but undergoes a high rate of heating and cooling during the welding process. This part can become brittle because it is subject to a hardening treatment.
The heat affected zone (HAZ) and fusion zone of welded joints can show very different material properties from base metal as well as between themselves. For example, the heat affected zone can exhibit a heat treated structure involving re-crystallisation, phase transform and grain growth while the fusion zone exhibits a typical cast structure.
2.2.2 Weld imperfections
Figure 2.2 shows a sketch of a cross section through a butt welded joint. Some defects which determine the weld quality are indicated. These and other defects can be summarised as follows (Shinagawa and Ku, 2011).
Cracks: This imperfection may arise from the effect of stresses or cooling. Due to their geometry, which produces a high stress concentration at the crack tip, cracks are the most critical imperfections. They can be classified according to their location
(longitudinal and transversel crack), or according to their nature (hot and cold crack). Porosities: May be either due to shrinkage during solidification or gas cavities due to
entrapment of gas.
A lack of fusion and penetration: This imperfection is the result of improper penetration of the weld materials, improper welding techniques or improper joint design.
Imperfect dimension and shape: The first form of this type of imperfection is the
HAZIM E. RADHI Page 27 techniques, or both. It is located at the junction of the base and weld metals. Other
similar types of imperfection are: misalignment, irregular width overlap, excess penetration and excess weld metal.
Solid inclusions: An imperfection caused by a solid foreign substance entrapped in the weld metal (flux, slag, oxide and metallic inclusions).
Miscellaneous imperfections: Excessive reinforcement, concave and convex fillet weld, undercut, under fill, overlap and incomplete fusion.
Figure 2-2: Defects of a butt welded joint
2.3 Optimisation of Welded Joints
2.3.1 Effects of welding parameters on metal properties
Each type of metal has certain mechanical properties. Such properties are responsible for giving the metal materials different levels of hardness, resistance to wear, etc. In the welding process, the amount of heat applied to the Heat Affected Zone (HAZ) should be, therefore, proportional to the capability of metals to handle such stress. However, the mechanical properties of the weld and HAZ differ from the general properties of the base metal. This difference may impact upon the quality of the weld.
HAZIM E. RADHI Page 28 Cracks often occur in metals during the welding process. Therefore, Scotti and Albuquerque Rosa (1997) conducted research to find out the best ways to enhance metal properties before welding. A number of tests were performed on the metals welded through the automatic flux cored arc method. The experiments carried out statistically measured the effects of the welding parameters on metal properties. The findings revealed that the size of the oscillation (transverse movement of welding torch) amplitude and the amount of preheating are the prime factors behind crack control. The probability of cracking can be minimised by maximising pre-heating and reducing oscillation amplitude. Moreover, the experiments found that the problem of weld cracking can be controlled without any negative effect on hardness.
Plastically deformed steel bars produced by a forging process was the focus of a study made by Sahin and Erol Akata (2003) to investigate the effect of welding parameters of friction welding. In their research, steel bars with similar and dissimilar diameters were welded while welding parameters were measured statistically. It was observed that there is an inverse relationship between the tensile strength of the weld and its width. Plastic deformation of steel bars did not affect the welding zone because of the high temperature in the welding process. The research concluded that friction welding is one of the most appropriate methods to weld plastically deformed steels. However, to guarantee successful results, parameters of the welding process including friction pressure, pressure time, upset pressure, upset time and rotational speed need to be carefully controlled.
The mechanical properties and geometry of titanium alloy Ti6Al4V weld bead created using a CO2 laser beam were examined by Caizzo, Curcio and Daurelio (2004). Additionally, Helium and Argon gas shields with different gas pressures, weld covering gas nozzles and characteristics of the weld joint were employed in the experiment so as to investigate the effects of such gases on the properties of the welded materials. No significant difference in weld bead geometry was observed. However, variations of micro-hardness were detected between the base metal and the Heat Affected Zone: the micro-hardness value at the HAZ was twice its counterpart at the base metal. Furthermore, the researchers conducted tensile tests on Bead on Plate (BoP) and butt welds to investigate the effect of edge alignment prior to the welding process. The results showed that there were no differences between the base metal and BoP with regard to strength. However, the stress-strain diagram revealed a failure in the butt welds starting from the bead foot regardless of different thicknesses. This weakness of the butt joints is concluded as a result of
HAZIM E. RADHI Page 29 two factors: the misalignment of the edges and an increased air gap. Helium gas should be used to protect the lower sides of the joints.
Three different back-propagation neural network models were investigated in a study conducted by Sterjovski, Nolan and Carpenter (2005) to predict (i) hot ductility (reduction of area) and strength (ii) toughness and (iii) hardness of the heat affected zone of steel parts after welding. The models proved successful in anticipating the mechanical properties of the welds. In doing so, the models can save the costs and time required for conducting experiments dedicated to investigating the parameters that produce an optimised welding process.
Hurtier et al. (2006) took the investigation of friction stir welding (FSW) methods further but with a focus on the mechanical and thermal history of the welded metal. The micro-hardness of the welded joints was examined along with the temperatures in the welding process. The study concluded that the quality of the welds can be increased if the average temperature of weld zone is reduced. In addition, the properties of the fusion area should be studied prior to welding in order to identify the proper parameters for better micro-hardness. The presence of oxide in the weld weakens its structure; additionally this model is also used to indicate the presence of a weakened zone in the weld.
Friction welding was the prime concern of Yoon, Kong and Kim (2006) who made attempts to optimise the process. The researchers used reduced activation ferritic steel (JLF-1), stainless steel (SUS304) and acoustic emission (AE) to evaluate the real-time weld quality. In friction welding a strong plastic deformation occurs until friction welding process completion, and then prominence of acoustic emission occurs during formation of flash, and it was confirmed that real time cumulative total AE counts could be measured. The properties of models were tested against the welding technique parameters and acoustic emission was confirmed as a successful tool for evaluating the quality of the weld.
From the literature, there were many studies carried out to using Genetic algorithms for the study of effect of welding process parameters either on the welded joint strength or on weld bead geometry for various welding process these studies are discussed in the following sections:
Kim, Rhee and Park (2002) illustrate the use of a genetic algorithm and a response surface methodology in the modelling and optimisation of gas metal arc (GMA) welding process parameters. Welding processes are complex procedures whose quality outcomes are mostly
HAZIM E. RADHI Page 30 based on a trial and error method. The trial and error method adversely affects the production quality and thereby affects an institution and organisation in terms of costs and time. They argue that response surface methodology and genetic algorithms can be utilised and employed to optimise welding processes and procedures. The researchers utilised genetic algorithms to determine near optimal conditions to minimise a number of preliminary experiments for welding processes while the response surface methodology was utilised and employed to determine the optimal conditions during the welding process. The optimum results were judged based on a desirability function. In this study the desirability function approach was used to optimize three bead geometry variables (bead width, bead height and penetration). In other words, they used a weighted criteria method, a technique which has some fundamental flaws as explained in the next chapter.
Ersel Canyurt (2005) attempted to predict the strength value of welds by developing a Genetic Algorithm Welding Strength Estimation Model. Experiments were carried out on brass joints with five different parameters (gap between the parts, torch angle, quantity of shielding gases, pulse frequencies and the electrode tip angle during welding). The resultant data indicated that changing the distance between welded parts from 0 to 0.5 mm leads to a 4.4 times decrease in the strength value of the welded parts. Moreover, the quantity of gas used in the gas shield and the pulse frequencies contribute to the tensile strength of the welds. The developed models were validated with experimental data. However, this study was restricted to the welding of one particular metal alloy
Two attempt have been made to correlate welding process parameters with bead geometry the first one by Vasudevan et al. (2007) and the second one by Sudhakaran et al. (2011).
In the first study, The development of methodology for optimizing a tungsten inert gas (TIG) welding process parameters ( current, voltage, torch speed, and arc gap) using genetic algorithm to achieve the target weld bead geometry (bead width, depth of penetration and reinforcement height ) for welding 304LN and 316LN stainless steel was done. Whilst in the second study, the direct effect and interactive effect of parameters like welding current, welding speed, shielding gas flow rate and welding gun angle on bead dimension has been investigated during this study. They compared the results from this model with experimental results and they found that the developed model was able to predict bead dimension with reasonable accuracy.
HAZIM E. RADHI Page 31 From these studies, it can be inferred that: all the previous studies investigated the effect of the welding process either on welded joint strength or welded joint geometry and in many cases, this has been aided by GA’s with experimental data used to validate the results. However, no work has been reported studying the combined effect of all geometrical parameters on the strength of welded joints. In addition, within this field there has been no comparison of the different GA’s available
2.3.2 Effects of geometrical parameters on welded joints
Another research study that sheds light on the reasons as to why welded joints can be weak and of poor quality was conducted and carried out by Fricke in 2003. He argued that welded joints are not perfect and of high quality because they contain pores, cavities and inclusions. These factors contribute to the weakness of a welded joint. In addition, Fricke noted that the shape of a welded joint on high stress concentration features. This makes welded joints susceptible to fatigue failure.
According to Benyounis and Olabi (2008), the quality of a welded joint is positively related to the welding input parameters. This implies and signifies the materials and components that are utilised and employed during a welding process will in effect determine the strength and quality of a welded joint. In addition, they argue that a welding joint is defined and described in terms of its properties, i.e. the welded joint’s mechanical and physical properties, distortion and weld-bead geometry.
2.4 Introduction to Fatigue
Fatigue is defined as:“The process of progressive localized permanent structural change occurring in a material subjected to conditions that produce fluctuating stresses and strains at some point or points and that may culminate in cracks or complete fracture after a sufficient number of fluctuations” (ASTM E-1823, 2000).
When a material is exposed to cyclic stress below its ultimate tensile strength, localised hardening or softening occurs due to plastic deformation. The location(s) of plastic deformation might be at points of stress concentration or even in the absence of a stress raiser as in the case of persistent slip bands where crack initiation could be due to extrusion formation. After the application of a number of cyclic stresses, cracks can appear in a structural member due to localised structural change. In this process, fatigue loading is the term used to describe the
HAZIM E. RADHI Page 32 applied loading, and fatigue failure is used to describe the resultant fracture. The fatigue life of a component is the term used to describe the amount of time during which the member can endure the cyclic load before fracture occurs. This fatigue life might also refer to the number of load cycles used to cause fracture.
Fatigue failure of metals occurs in almost all engineering fields. It has been assessed that up to ninety percent of common mechanical failures are a result of fatigue failure (Stephens, Fatemi, Stephens & Fuchs, 2001). It is also believed that such failures occur unexpectedly. Fatigue failure of the metal structures occur in every field of engineering such as the electrical, thermal, mechanical, civil, aeronautical, biomedical, chemical and nuclear fields.
Furthermore, fatigue failures can be found in problems of simpler items such as paper clips that crack after a number of bending actions; door springs that crack after repeated moving actions; electric light bulbs that stop working due to failure in the electric circuit; tennis racquets, tooth brushes, etc. Additionally, fatigue failure can be observed in complex components and structures like steering linkage of automobiles, connecting rods of engines, propeller shafts of ships, landing gears and fuselages of airplanes and even in implanted organs in human bodies, vehicles, vessels, airplanes, ships and humans are subject to this kind of failure
In fact, cracks and fractures represent an original threat to engineering structures. A crack becomes a serious threat leading to fatigue failure when its size is bigger than a critical size. Despite the fact that not all cracks are critical, structural failure can still occur when subcritical cracks are developed by fatigue loading. This development of cracks is referred to as fatigue crack growth (FCG). Since in some cases it is difficult to stop the growth or development of subcritical cracks in almost all structures, a concept of crack sensitivity (damage tolerant design) has been developed for structures subject to complete fatigue failure.
The concept of Fatigue Crack Growth has been utilised by design engineers in order to produce designs for long fatigue lives.
2.5 Fatigue Failure Stage
A metal goes through three main stages before finally reaching complete failure. These stages are called the stages of fatigue failure. The first stage is called the crack nucleation. This stage or process is essentially influenced by voids or inclusions. It is believed that local stress and strain concentrations are the factors that control this process of nucleation which is attributed to cyclic
HAZIM E. RADHI Page 33 slip. The second stage in a metal fatigue life is called micro-crack growth. This stage is used to describe the development of slip bands, voids or inclusions in a metal up to 20 µm, so this stage is usually known as a small-crack growth process. There is much interest in this stage which is concerned with the behaviour of small cracks because it has been found by Schijve, (1979) that small cracks of 100 µm consume from 60 to 80 percent of fatigue life in a pure and polished metal's surface and studies by Newman (Newman & Edwareds, 1988) and Newman et al. (Newman, Wu, Venneri & Li, 1994) showed that up to 90 percent of a metal's fatigue life is consumed in crack growth from 10 µm to failure. The final stage that precedes fatigue failure is the macro-crack growth. In the regions of macro-crack growth, it is usually easy to predict the growth of fracture leading to fatigue failure.
The three general phases of fatigue life are shown in Figure 2.3. These stages in the figure are representative of the kind of fracture that occurs on the surface of metals. The application of repeated loads is noticeably the one thing in common between the first and the second stages. The nature of the applied load could be either mechanical, as in the crank shaft of a combustion engine, thermal, as in heat exchangers and boilers, or it could be represented in repeated pressures as in an aircraft's interior, fuselage or wing fixations.
Because of the great significance of the first two stages and their greater impact on the development of fatigue fracture, the total sums of all cycles that occur in these stages represents the fatigue life of a member.
The fatigue life of a component, i.e. the total number to failure, is the sum of cycles at the first and second stages:
𝑁
𝑓= 𝑁
𝑖+ 𝑁
𝑝(2.1)
Where
Nf = The total number of cycles leading to eventual fracture.
Ni = The total number of cycles responsible for the initiation of a crack. Np = The total number of cycles responsible for the propagation of a crack.
It has been found that the value of Ni can be high when the stresses are mostly elastic in high cycle fatigue (Schijve, 1979). In low cycle fatigue, the value of the metal's yield strength is lower
HAZIM E. RADHI Page 34 than the applied stress levels and bulk plasticity is present. Np becomes dominant and Ni goes down when the stress level is increased.
Figure 2-3: Fatigue stages on the fracture surface
2.6 Fatigue Crack Growth Rate
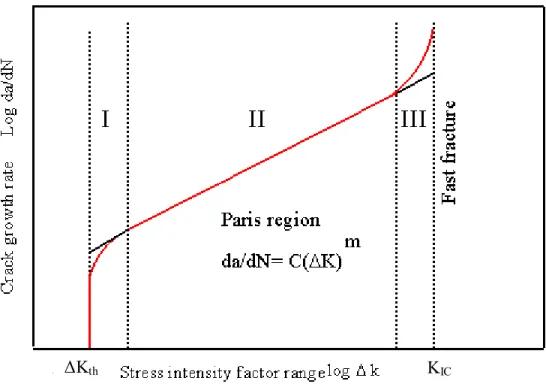
Crack growth rate is defined as crack extension per cycle (da/dN), Consider a crack that is propagating in the presence of a constant amplitude cyclic stress intensity factor (Δk), Where Δk=Kmax-Kmain, The rate of fatigue crack growth per cycle (da/dN) is governed by stress intensity factor range (ΔK), a plot of log (da/dN) versus log (ΔK) is shown in Figure 2.4.
As shown in Figure 2.4, the growth process of a fatigue crack has three general stages represented in the figure by three different areas that divide the growth curve (Molent, Jones, Barter & Pitt, 2006). Each of these areas or regions has its own properties and characteristics. The first region represents the threshold value of ΔKth that is considered the initial development of a crack. All values that fall below ΔKth are considered as notable growth and as non-propagating cracks. It is believed that this region has a strong link to the crack slow development of a crack under low ranges of stress. It is also argued that this region is responsible for a great proportion of a metal's fatigue life.
The second area or region is characterised by stability of crack development. This region has been extensively studied for its technical significance and it is usually called the Paris region
Stage III
Stage II
HAZIM E. RADHI Page 35 (Huang & Moan, 2007). The importance of this region lies in the fact that it is the region where the Paris law (Paris & Erdogan, 1960) can be applied. This law defines a linear relationship between log │da/dN│ and log │ΔK│:
𝑑𝑎
𝑑𝑁
⁄
= 𝐶(∆𝐾)
𝑚 (2.2)Where m is the slope of the line generated by the equation and the coefficient C is generated when the straight line is extended to ΔK =1 MPa √m. The values of C and m are constant. This stage lasts for a certain period of time until the third stage initiates and the final fatigue failure occurs in a material i.e. KIC is reached.
The development of the fatigue crack in the third region has its highest rates. Development continues rapidly towards a state of instability. This stage takes a small proportion of a material's fatigue life. The factor that predominately controls this region is the metal's KIC (fracture toughness).
Figure 2-4: Typical relationship between the crack growth rate and the range of stress intensity factor.
KIC ΔKth
HAZIM E. RADHI Page 36
2.7 Fatigue Loading
There are two types of load history in fatigue design. The first is the constant-amplitude cyclic load. This type of loading normally occurs in the laboratory during fatigue testing.
Figure 2-5: Nomenclature used in constant-amplitude loading (Wei & Pentti, 2003)
The main parameters of constant-amplitude loading are (Figure 2.5): Stress range: the difference between maximum and minimum stress
∆𝜎 = 𝜎
𝑚𝑎𝑥− 𝜎
𝑚𝑖𝑛 (2.3) Stress amplitude: half the stress range
𝜎
𝑎=
∆𝜎2=
𝜎𝑚𝑎𝑥−𝜎𝑚𝑖𝑛2 (2.4)
Mean stress: the algebraic mean of maximum and minimum stress
σ
m=
σmax+σmin2 (2.5)
Stress ratio: the relative magnitude of the minimum and maximum stress.
R =
σminHAZIM E. RADHI Page 37 Values of R for different load cases are indicated in Figure 2.6
Fully reversed load Zero to full tensile load Tensile load
Figure 2-6: Comparison of R-rations for different loading (Barsom & Rolfe, 1999). The second type of loading is called variable–amplitude loading. This is more complex and it is difficult to represent with an analytical function (see Figure 2.7). According to the statistical data, 80% of structural fatigue failure is caused by this load Wei & Pentti, 2003. For example, rotating shaft, reciprocating springs, bearings, airplane structures and ships are mostly fractured under random loads. Actually there are several techniques used to idealised this load closer to laboratory load, such as short time Fourier transform and wavelet methods.
HAZIM E. RADHI Page 38
2.8 Fatigue of Welded Joints
The durability and safety of welded structures become an important issue, because the failure of such systems may cause many injuries, environmental damage and financial losses.
The design of welded joints against fatigue is mainly based on different local approaches which are reviewed by Radaj (1996). The importance of the application of local approaches is justified by the fact that the fatigue process cannot be well defined by global stresses and it has a local character. The local approaches can be divided into the following three groups (Figure 2.8): the elastic structural stress or strain approach, the notch stress or strain approach and the fracture mechanics approach.
A literature review on the fatigue analysis of welded joints was conducted by Fricke (2003) and included mainly papers and books published during the past 10-15 years. An extensive selection of nominal stress, structural stress, notch stress, and notch strain and crack propagation approaches were included in this study.
Figure 2-8: Local approaches for fatigue assessment of welded joints.
A detailed in-depth description of the fatigue assessment of welded joints by local approaches considering the state of the art research work is provided by Radaj, Sonsino and Fricke (2006).
Different formalisms have been examined by Boukharouba, Gilgert, and Pluvinage (1999) by calculating the stress concentration factor according to the weld toe radius and weld toe angle. A comparison between these results and those stemming from finite element methods has been
HAZIM E. RADHI Page 39 conducted. The results indicate that the stress concentration factor is related to weld geometry; this leads to a decrease in the fatigue life of welded joints which is more significant than the role played by residual stress.
Nguyen and Wahab (1998) developed a mathematical model to predict the fatigue behaviour of butt welded joints, taking into account various weld geometry parameters such as weld toe radius, weld toe under cut, plate thickness and weld toe angle by using the concept of linear elastic fracture mechanics (LEFM) and finite element analysis (FEA). They have found that the effect of weld toe undercut is very significant in comparison with the other butt weld geometry parameters.
In the study of Teng, Fung and Chang (2002) a finite element analysis (FEA) was conducted on butt welded joints to obtain the local stress and residual stress distribution, taking into account the geometrical parameters such as weld toe radius, weld flank angle and plate thickness. The results from this study indicate that modifying weld geometry by increasing the weld toe radius led to an improvement in the fatigue life of butt welded joints.
In order to evaluate the influence of the factors of stress concentration at both the weld toe and internal defects on the fatigue strength of the high strength steel MOMEX 600 CD for SSAB, a fatigue study was performed by Costa, Ferreira and Abreu (2010). Three different welding conditions were investigated in the course of this study. They concluded that the stress concentration at weld toe and initial defects are the main factors responsible for the fatigue strength of the welded joints.
Cerit, Kokumer and Genel (2010) investigated the stress distribution of welded joints with different values of reinforcement metal under uni-axial tension. A parametric two-dimensional finite element analysis was carried out. They found that a low reinforcement angle and weld toe radius cause higher values of stress concentration factors. Consequently, this value will reduce the load carrying capacity of these joints.
Chapetti and Jaureguizahar (2011) attempted to predict the fatigue strength of welded joints by using a fracture mechanics approach. A comparison between finite element analyses of butt welded specimen and experimental results from the literature were carried out considering the influence of plate thickness and reinforcement angle. The comparison indicates that the reduction
HAZIM E. RADHI Page 40 in the reinforcement angle will reduce the scatter observed. This is due to the high stress gradients near the weld toe with small values of reinforcement angle (α), see Figure 2.9.
Figure 2-9: Reinforcement angle influence on fatigue strength of butt welds (Chapetti, 2011)
Pyttel, Grawenhof and Berger (2012) studied the influence of different welding geometries and welding procedures on the fatigue life of rotating components. Numerical and experimental investigations with different concepts such as nominal stress, hot spot stress, elastic notch stress and fracture mechanics were carried out. They found that most of the experimental results on the basis of nominal and hot spot stress concepts were conservative in comparison to the International Institute of Welding (IIW) recommendations and that the fatigue life of a laser-welded flat specimen was higher than that of the (tungsten inert gas) TIG weld specimen.
Radaj, Sonsino and Fricke (2009) review recent developments in the local approaches to the fatigue assessment of welded joints. A novel notch stress intensity factor (NSIF) and crack propagation approach for spot welds was reviewed. In this method the elastic stress intensity factor of the V-notch at the weld toe or at the weld root is determined and compared with durability values represented by a stress intensity – life curve.
HAZIM E. RADHI Page 41
2.9 Conclusion
The geometrical parameters of welded joints such as weld toe radius, weld toe angle, weld reinforcement and weld width play a very important role in the fatigue strength of welded joints.
Stress concentration generally occurs at the weld toe, which behaves as a pre-existing crack, and can be considered as a critical area for crack initiation with subsequent crack propagation leading to failure.
All the research reviewed either investigates the effect of one or two geometrical parameters on the strength of welded joints or studies the welding parameters such as voltage, current and welding speed. However there is no comprehensive study taking in to account the effect of all geometrical parameters (weld toe radius, weld toe angle, weld reinforcement and plate thickness) on the strength of welded joints.
HAZIM E. RADHI Page 42
Chapter 3
HAZIM E. RADHI Page 43 3- Chapter Three: Optimisation
3.1 Introduction
One of the simplest definitions for optimization is “doing the most with the least” (Gomez, et al. p. 301, 2006). Lockhart and Johnson (1996) define optimization as “the process of finding the most effective or favorable value or condition” (p. 610). However, optimisation can be defined as the process of finding the conditions that achieve the maximum or minimum value of a function (Rao, 2009).
Optimisation problems are either scalar or vector optimisation problems. Scalar optimisation problems use a single objective function f and can mathematically be defined as “min/max f(x)”, whilst vector optimisation problems use several objective functions. The major categories of scalar optimisation are linear optimisation, quadratic optimisation, nonlinear optimisation, simplex method and quasi-Newton method. (Rao, 2009)
Moreover, the optimal seeking techniques are identified as mathematical programming tech-niques and are commonly considered as a component of operations research. Operations research is defined as the branch of mathematics which involves the application of scientific or systematic approaches and techniques to decision making problems as well as setting up the highest or optimal solutions.
Mathematical programming techniques are practical methods applied in order to obtain the lowest of a function of a number of variables governed by an arranged group of constraints.
3.2 Historical Development
The first emergence of optimisation methods dates back to the time of Newton, LaGrange, and Cauchy. It was possible to make the advancement of differential calculus methods of optimisation due to the contributions made by Newton and Leibnitz to calculus. Bernoulli, Euler, LaGrange and Weirstrass established the basics of variations calculus, which involves the reduction of functions. As for the method of optimisation for constrained problems, which is concerned with the addition of unknown multipliers, it is named after its inventor, LaGrange. Cauchy developed the earliest practice of the sharpest descent method in order to solve unrestricted minimisation problems. Regardless of these early contributions, no great advances were achieved until high-speed digital computers brought about the execution of optimisation
HAZIM E. RADHI Page 44 methods and motivated more updated research on new techniques in the m