All rights reserved
Average Volume, Patterns of Drinking, and Mortality Rehm et al.
Average Volume of Alcohol Consumption, Patterns of Drinking, and All-Cause
Mortality: Results from the US National Alcohol Survey
Jürgen Rehm,1–4Thomas K. Greenfield,5,6and John D. Rogers5
The objective of this study was to investigate the effects of an average volume of alcohol consumption and drinking patterns on all-cause mortality. The sample (n = 5,072) was drawn from the 1984 National Alcohol Survey, representative of the US population living in households. Follow-up time was until the end of 1995, with 532 people deceased during this period. The authors found a significant influence of drinking alcohol on mortality with a J-shaped association for males and an insignificant relation of the same shape for females. When the largest categories of equivalent average volume of consumption were divided into people with and without heavy drinking occasions, serving as an indicator of drinking pattern, this differentiation proved important in predicting mortality. Light to moderate drinkers had higher mortality risks when they reported heavy drinking occasions (defined by either eight drinks per occasion or getting drunk at least monthly). Similarly, when the category of exdrinkers was divided into people who did or did not report heavy drinking occasions in the past, people with heavy drinking occasions had a higher mortality risk. Finally, indicating alcohol problems in the past was related to higher mortality risk. Results emphasized the importance of routinely including measures of drinking patterns into future epidemiologic studies on alcohol-related mortality.Am J Epidemiol 2001;153:64–71.
alcohol drinking; data collection; drinking; drinking behavior; follow-up studies; mortality
Received for publication December 8, 1999, and accepted for publication April 10, 2000.
1Public Health Sciences, University of Applied Sciences, Hamburg, Germany.
2World Health Organization, Geneva, Switzerland. 3Centre for Addiction and Mental Health, Toronto, Canada. 4Public Health Sciences, University of Toronto, Toronto, Canada. 5Alcohol Research Group, Public Health Institute, Berkeley, CA. 6Department of Psychiatry, University of California, San Francisco, CA.
Reprint requests to Dr. Jürgen Rehm, Addiction Research Institute, Konradstr. 32, CH 80031 Zurich, Switzerland (e-mail: [email protected]).
Starting with the classic study by Pearl (1), epidemiologic evidence on alcohol and all-cause mortality in cohorts of individuals older than 40 years of age can be summarized in a J-shaped curve (2). This hypothesis states that light to moderate consumers have a lower mortality risk compared with abstainers, while the risk for heavy drinkers is higher than that for both moderate drinkers and abstainers. Although the level of minimal risk differs for both sexes (2, 3) and also seems to differ in different cultures (4), the basic J-shape of the curve has been confirmed in the vast majority of studies (5).
The J-shape persisted after the major alternative explana-tions brought forward were empirically tested in more recent studies. The most prominent alternative explanation was the sick quitter hypothesis (6–8), which postulates that, in established market economies with high proportions of drinkers, drinkers often quit only after having experienced medical problems as a consequence of drinking. Thus, the J-shape would disappear if lifetime abstainers were chosen as
the reference category instead of the mixed group of all abstainers. Other alternative explanations given concerned diet (9) or social isolation (10). Rehm and Sempos (11, 12) provide just one example of persistence of the J-shape after controlling for former drinkers and, for body mass index and cholesterol level as indicators for diet, Murray et al. (13) provide an example for controlling for social isolation.
However, almost all studies on alcohol and mortality are based on simple measures of alcohol consumption, often as part of a food frequency measure (14, 15). Even though such measures show sufficient test-retest reliability and concur-rent validity (16–19), they tend to concentrate on overall average volume and disregard patterns of drinking (20, 21). “Patterns” here is defined in terms of intermittently drinking heavy quantities or to intoxication, which is related to the variability of drinking per drinking occasion (22, 23). For example, within the same average volume of two drinks per day, one could drink each day two drinks without any vari-ation, or one could drink seven drinks each Friday and Saturday.
It has been shown that alcohol-related mortality, espe-cially accidents and injuries but also cardiovascular heart disease, is considerably related to patterns of drinking irre-spective of volume (24, 25). In addition, pattern-related assessment measures of alcohol consumption have been shown to be more substantially associated with mortality and other forms of alcohol-related harm than pure volume measures (26). Thus, alcohol epidemiologists have repeat-edly made a case for the inclusion of pattern in epidemio-logic cohort studies involving alcohol as a risk factor (21, 27).
The 1984 National Alcohol Survey offered a unique opportunity to examine the relation between alcohol con-sumption and all-cause mortality, including measures of pat-terns of consumption in addition to usual volume measures. The National Alcohol Survey was a specialized alcohol sur-vey with a multistage probability sample of the adult US national household population. The survey included a whole variety of measures of present and past alcohol consumption (28). This survey was combined with a mortality study in order to determine how patterns of drinking would influence the J-shaped curve.
MATERIALS AND METHODS Study design and sample
The Institute for Survey Research of Temple University conducted fieldwork for the 1984 National Alcohol Survey. The stratified national household probability sample con-sisted of 110 primary sampling units within the 48 contigu-ous US states. African-American and Hispanic respondents were oversampled. Adult respondents (aged 18 years and older) were interviewed face to face and were paid for their participation. The total number of interviews completed was 5,221, with a response rate of 74 percent. Consistent with the aims specified above, this article excludes persons of ethnicity other than White, Black, or Hispanic (n44) and with missing information on age, sex, or volume of alcohol consumption (an additional n 105 or 2.0 percent of the eligible sample). The remaining sample for the main analy-sis was thus 5,072. All-cause mortality served as an end-point in all analyses.
Mortality information was obtained through a search of the National Death Index. Respondent information was sub-mitted to the National Death Index by the fieldwork con-tractor and shielded from inappropriate linkage with survey data by a proxy identification system. After initial screening of likely matching records in the National Death Index search, death certificates were obtained from all but one state in the sample (New York State, 18 records; however, 20 records for New York City were obtained separately), and the information was used as a further check on the accu-racy of each decedent. Precoded cause-of-death information was also obtained through the National Death Index, but the overall sample size did not allow for specific analyses. Some tentative analyses are presented in the Discussion below. The number of respondents identified as having died during the study period in our sample (1984–1995) was 532 or 10.5 percent. The number of days from the original inter-view in the 1984 National Alcohol Survey to either December 31, 1995, or the date of death was retained for use in Cox proportional hazards regression analyses. The aver-age follow-up time was 11.33 (standard deviation, 0.08) years for the nondeceased and 6.21 (standard deviation, 3.15) years for the deceased.
Independent variables
Alcohol consumption. The estimated frequency of drinking was determined from a self-administered booklet,
administered during the interview, to increase confidential-ity and encourage candor. This booklet presented four ver-sions of the question, “How often do you usually have (wine/beer/drinks containing whiskey or liquor/any alco-holic beverage)?” Eleven answer categories were provided, ranging from “three or more times a day,” “two times a day,” and “once a day,” down to “never” for each beverage as well as for all alcoholic beverages. Respondents who reported drinking more often than “less than once a year” were coded as current drinkers. The average volume of alcohol con-sumed was estimated with successive questions about the proportion of drinking occasions on which five or six, three or four, and one or two drinks of wine, beer, and spirits were consumed. The estimated proportions were multiplied by the implied number of drinking days for each level, and the levels were summed for a measure of total volume (29). To give two examples: If a respondent indicated an intake of seven drinks of alcohol each Friday (i.e., once a week), his average would be one drink a day, the same as the average of a respondent who drinks one drink with dinner each day. A set of mutually exclusive categories for average volume was derived from this measure, including 1) lifetime abstainers, 2) former drinkers, 3) >0–1 drink on average per day, 4) >1–2 drinks on average per day, 5) >2–4 drinks on average per day, 6) >4–6 drinks on average per day, and 7) >6 drinks on average per day. For females for most analy-ses, the two highest categories had to be collapsed into one (>4 drinks) because of small sample size, especially for deaths (see table 2). For males the two lowest drinking cat-egories were collapsed into one for most analyses (>0–2 drinks/day) to allow for pattern analysis within the same volume category.
Different variables were used to measure patterns of drinking (e.g., a heavy drinking rate measures the indexing variability of present and past drinking). These variables were used to divide the large categories of light and moder-ate drinkers as well as the former drinker cmoder-ategory. For males, the lowest drinking category (>0–2 drinks/day) was divided into two groups: 1) drinkers who neither were drunk nor had ≥8 drinks on at least a monthly basis during the year preceding the baseline interview (n984) and 2) drinkers who qualified according to at least one of those criteria (n
118). For females, the drinking volume category up to one drink per day was divided the same way. This resulted in 1,276 females without heavy occasional drinking and 43 females with such a pattern. In previous research, the con-sumption of ≥8 drinks on one occasion has been shown to be a good predictor of alcohol problems (30).
Former drinkers of both sexes were similarly divided into persons ever having had ≥5 drinks (males: n 120; females: n 62) and persons who never exceeded this amount (males: n 163; females: n469). The criterion of five drinks on one occasion has emerged as the most uti-lized single lifetime indicator of drinking patterns in the United States (31) that may betoken alcohol-related prob-lems. We had to use a different measure for present and past drinking because of limitations in the available data set.
Other volume categories could not be divided by pattern because their overall size and/or the number of deaths did
not allow for further division (see table 2). In addition, although the average volume and the pattern indicators used here correlate only moderately (e.g., the overall correlation between the average volume and the ≥8 indicator is about 0.5), there is high overlap in the heavy drinking categories. For instance, in the category of having >6 drinks per day on average, the pattern of having at least eight drinks on one occasion monthly is quite common (73 percent).
For separate analyses, past alcohol problems were opera-tionalized by respondent reports of either having ≥5 drinks on a weekly basis or by having felt that their drinking was no longer under control in any year between 1973 and 1983, the year before the baseline assessment.
Covariates. Based on the literature, the following vari-ables were controlled, to avoid confounding:
• income as a proxy for social class (32, 33): dichotomized with 1 referring to the upper third of the income distribution;
• marital status (34): dichotomized with 1 referring to married individuals; and
• smoking status (2): dichotomized with 1 referring to smokers. No data were available on the average dose of smoking.
Other potential confounders such as diet (e.g., the healthy diet indicator (35)) or physical activity (34, 36) could not be included, as there were no suitable variables assessed in the National Alcohol Survey.
Statistical analyses
The Cox proportional hazard model was applied as the main tool of analysis (37). The assumption of proportional hazards was examined by visual inspection for the different sex, ethnicity, and volume categories (38). Because previous research strongly suggests a difference in risk curves for males and females (2, 3), analyses were conducted sepa-rately by sex. Ethnicity had a significant main effect only in females but was retained in all final models for both sexes. Interactions between alcohol consumption and ethnicity were not significant and thus dropped from the final models. All analyses were adjusted for age as a linear term in the regression equation. This adjustment was chosen after age, the exponential value of age, and age-squared were com-pared with regard to their influence on mortality, and for both sexes the linear age term had a better fit than a squared or exponential age term. The addition of squared age did not add significantly to models with age alone, as indicated by the maximum likelihood ratio test.
Unweighted analyses were used based on the Groves (39) argument distinguishing between analytical and etiologic research, where no weights should be applied, and descrip-tive research, where weighting is appropriate. Following this distinction, the prevalence rates of risk factors and con-founding factors are provided as weighted percentages.
RESULTS
Table 1 provides an overview of the population distribu-tion of the variables by sex. As expected, high volume
drinking categories, past problems with alcohol, smoking, and also higher income were more prevalent in males than in females.
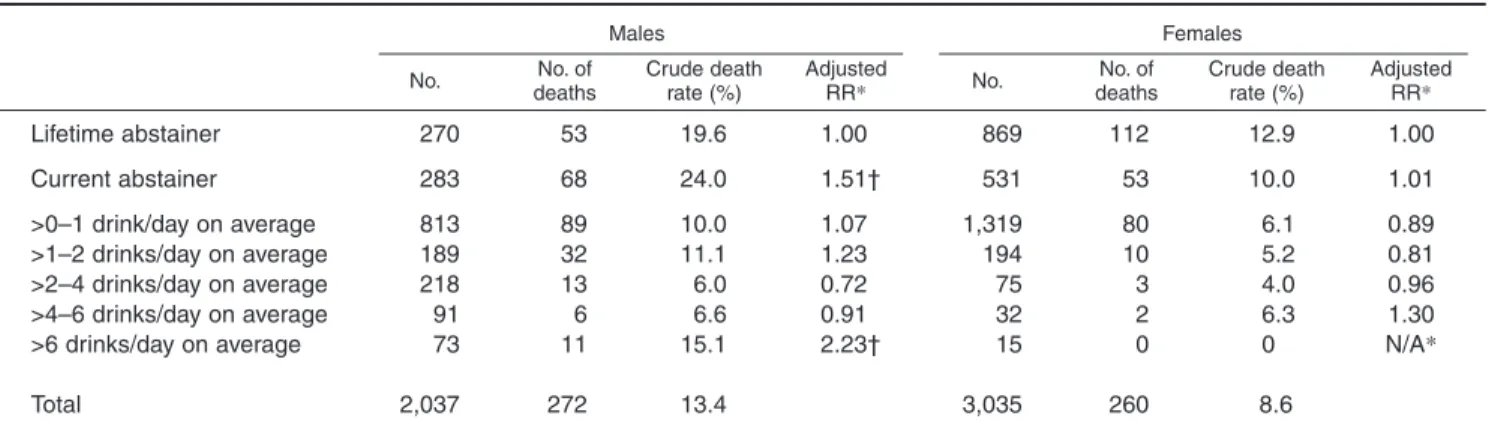
Table 2 provides the numbers of males and females in dif-ferent (average) volume categories, associated crude death rates, and age- and ethnicity-adjusted relative mortality risks. As indicated above, because of small numbers, high volume drinking categories could not be used separately for females for further analyses.
The reference category for all relative risk and percentage comparisons in this article was lifetime abstainers. Table 3 shows the relative risks for different drinking categories for males adjusted either for age and ethnicity only or for all covariates. Overall, alcohol had a significant relation on all-cause mortality in both models. As predicted, when consid-ering the average volume alone, independent of pattern, the form of the relation between the volume of drinking and mortality resembled a J-shape, with the following relative risks: lifetime abstainer: 1; >0–2 drinks: 1.10; >2–4 drinks: 0.73; >4–6 drinks: 0.93; >6 drinks: 2.29; in addition to the J-shape for volume: exdrinker: 1.50. The relative risks for exdrinker and >0–2 drinks were not shown in table 3, where data for these drinking categories were divided by pattern. Two drinking categories had smaller risks than that for life-time abstainers, with heavy drinking constituting the highest mortality risk.
However, the most striking feature of table 3, which includes the pattern indicators, was the influence of those patterns on mortality in the two relevant groups. Both for the group of former drinkers and for the light to moderate drink-ing category, there were substantial differences when respondent categories were divided by occasional heavy drinking status, for example, if they reported consuming alcohol regularly only in moderate quantities or if they had spikes of heavy drinking occasions. For males, in groups with occasional high quantity drinking, the risks were more than 70 percentage points above the risks for peers at the same volume but without this pattern of occasional high quantity drinking (all percentage points relative to lifetime abstainers).
In the model adjusted for potential confounders (table 3), the picture did not change substantially. As expected, because of the correlation between heavy drinking and smoking, the relative risks for the heavy average volume and heavy occasional drinking categories decreased little compared with the model adjusted for age and ethnicity only. The potential confounding factors themselves showed the expected relations: higher income and being married were related to lower risks for mortality (data on marital status not shown; see below), whereas smoking was related to a higher mortality risk. In both sexes, the relation between marital status and mortality did not achieve signif-icance, and this variable was therefore dropped for the final models.
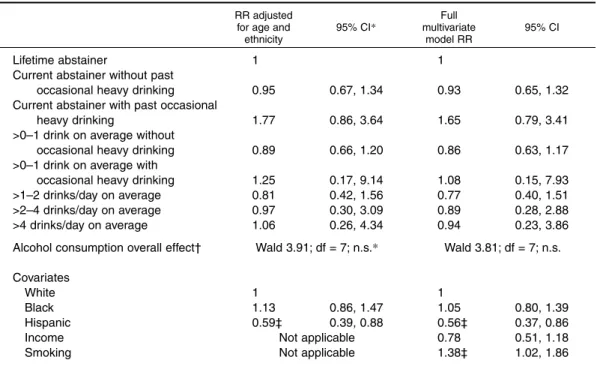
In females, we see approximately the same pattern of results as in males, but differences between drinking cate-gories were much weaker, and neither the effect of overall consumption nor any comparisons with lifetime abstention approached significance (table 4). Besides the expected
effect for age as an adjustment factor, only the difference between White females and Hispanic females was signifi-cant. With the known problems of correctly identifying Hispanic names in National Death Index searches and the fact that a substantial number of Hispanics move back to the countries of their origin after a period of working in the United States, this effect may well be due to methodological problems. The methods used for finding Hispanic deaths were restricted to US sources (40).
Multivariate analyses showed small changes in the same direction as for males but did not change the picture. The only bigger difference was the fact that income was related to mortality to a lesser degree than in males.
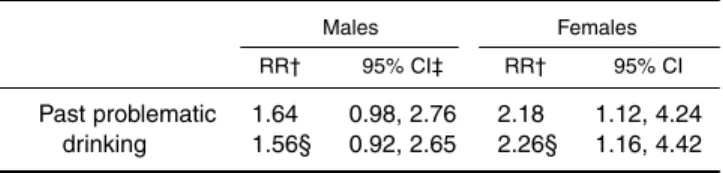
In separate analyses, past problems with drinking were also related significantly to higher mortality for both males and females (table 5). This relation remained stable after adjusting for the volume of drinking at baseline. For females, the relative risk associated with past problems with
TABLE 1. Descriptive statistics of exposures at baseline assessment, National Alcohol Survey, 1984–1985*
Drinking categories at baseline Lifetime abstainer Current abstainer >0–1 drink/day on average >1–2 drinks/day on average >2–4 drinks/day on average >4–6 drinks/day on average >6 drinks/day on average Eight drinks or more per
occasion at least monthly Eight drinks or more at least
once during last year Drunk at least once a month
(past year)
Past problematic drinking (1973–1983)
Other exposures or control variables White Black Hispanic Married High income Smoking 270 283 813 290 218 91 73 226 589 209 184 737 707 593 1,196 731 938 13.3 13.9 39.9 14.2 10.7 4.5 3.6 11.1 28.9 10.3 9.0 36.2 34.7 29.1 58.7 35.9 46.0 No.
*Based on sample with full information on ethnicity, age, gender, alcohol consumption, and mortality status (n= 3,035 for females and n= 2,037 for males).
Males Females % Weighted % No. % Weighted % 12.2 13.1 41.6 15.7 10.4 3.7 3.3 9.1 28.5 10.1 8.8 35.3 35.5 29.2 59.0 41.8 48.1 869 531 1,319 194 75 32 15 72 272 83 108 1,017 1,186 832 1,362 759 940 28.6 17.5 43.5 6.4 2.5 1.1 0.5 2.4 9.0 2.7 3.6 33.5 39.1 27.4 44.9 25.0 31.0 24.1 17.7 48.1 5.9 2.8 1.0 0.4 2.0 9.1 2.4 3.6 33.8 38.9 27.3 51.5 31.9 29.2
TABLE 2. Drinking categories and numbers of deaths, National Alcohol Survey, 1984–1985
Lifetime abstainer Current abstainer >0–1 drink/day on average >1–2 drinks/day on average >2–4 drinks/day on average >4–6 drinks/day on average >6 drinks/day on average Total 270 283 813 189 218 91 73 2,037 53 68 89 32 13 6 11 272 No.
*RR, relative risk, adjusted for age and ethnicity; N/A, not applicable. † RR differs significantly from lifetime abstainers.
Males Females No. of deaths Crude death rate (%) Adjusted RR* 19.6 24.0 10.0 11.1 6.0 6.6 15.1 13.4 1.00 1.51† 1.07 1.23 0.72 0.91 2.23† 869 531 1,319 194 75 32 15 3,035 112 53 80 10 3 2 0 260 No. No. of deaths Crude death rate (%) Adjusted RR* 12.9 10.0 6.1 5.2 4.0 6.3 0 8.6 1.00 1.01 0.89 0.81 0.96 1.30 N/A*
TABLE 3. Relative mortality risk (RR) for different drinking categories adjusted for other risk and pro-tective factors, males, National Alcohol Survey, 1984–1985
Lifetime abstainer
Current abstainer without past occasional heavy drinking Current abstainer with past occasional
heavy drinking
>0–2 drinks/day on average without occasional heavy drinking >0–2 drinks/day on average with
occasional heavy drinking >2–4 drinks/day on average >4–6 drinks/day on average >6 drinks/day on average
Alcohol consumption overall effect‡
Covariates White Black Hispanic Income Smoking 1 1.24 0.80, 1.90 1.96† 1.26, 3.05 1.07 0.76, 1.51 1.84† 0.98, 3.44 0.73 0.39, 1.37 0.93 0.39, 2.21 2.29† 1.17, 4.48 Wald 21.64; df = 7 p< 0.01 1 1.19 0.91, 1.57 0.91 0.65, 1.27 Not applicable Not applicable
*CI, confidence interval.
† At least marginally significantly different from the reference group.
‡ The Wald test indicates if there are any significant differences between different categories of alcohol con-sumption with respect to mortality.
RR adjusted for age and
ethnicity Full multivariate model RR 95% CI* 1 1.22 0.78, 1.89 1.93† 1.23, 3.02 1.08 0.76, 1.53 1.62 0.86, 3.07 0.78 0.41, 1.47 0.90 0.38, 2.14 2.14† 1.08, 4.23 Wald 17.8; df = 7 p< 0.05 1 0.99 0.75, 1.31 0.76 0.54, 1.08 0.48† 0.34, 0.68 1.26† 0.97, 1.62 95% CI
TABLE 4. Relative mortality risk (RR) for different drinking categories adjusted for other risk and pro-tective factors, females, National Alcohol Survey, 1984–1985
Lifetime abstainer
Current abstainer without past occasional heavy drinking Current abstainer with past occasional
heavy drinking
>0–1 drink on average without occasional heavy drinking >0–1 drink on average with
occasional heavy drinking >1–2 drinks/day on average >2–4 drinks/day on average >4 drinks/day on average
Alcohol consumption overall effect†
Covariates White Black Hispanic Income Smoking 1 0.95 0.67, 1.34 1.77 0.86, 3.64 0.89 0.66, 1.20 1.25 0.17, 9.14 0.81 0.42, 1.56 0.97 0.30, 3.09 1.06 0.26, 4.34 Wald 3.91; df = 7; n.s.* 1 1.13 0.86, 1.47 0.59‡ 0.39, 0.88 Not applicable Not applicable
*CI, confidence interval; n.s., not significant.
† The Wald test indicates if there are any significant differences between different categories of alcohol con-sumption with respect to mortality.
‡ At least marginally significantly different from the reference group. ` RR adjusted
for age and ethnicity Full multivariate model RR 95% CI* 1 0.93 0.65, 1.32 1.65 0.79, 3.41 0.86 0.63, 1.17 1.08 0.15, 7.93 0.77 0.40, 1.51 0.89 0.28, 2.88 0.94 0.23, 3.86 Wald 3.81; df = 7; n.s. 1 1.05 0.80, 1.39 0.56‡ 0.37, 0.86 0.78 0.51, 1.18 1.38‡ 1.02, 1.86 95% CI
alcohol was around 2.2 and larger than for males (relative risk 1.6).
DISCUSSION
Results confirmed those in the existing literature but addi-tionally point a way to go beyond current knowledge. The volume of drinking and mortality showed a curvilinear rela-tion for both sexes even though this relarela-tion was not signifi-cant for females. Neither choosing lifetime abstainers as a reference category nor adjusting for social class, smoking, or marital status altered the basic J-shaped relation. Thus, the use of more sophisticated assessment methods for the volume of alcohol consumption alone did not yield different results from previous epidemiologic work based on simple food fre-quencies. Overall, the J-shaped curve seems to be remarkably stable and independent of assessment measures (41).
However, including measures assessing patterns of drink-ing at baseline and for past drinkdrink-ing revealed new insights into the relations between alcohol and all-cause mortality. Even within the same category of volume of drinking, a divi-sion based on patterns yielded different results. Indications of monthly heavy drinking (≥8 drinks or intoxication) in light to moderate drinkers or of any heavy drinking in exdrinkers (≥5 drinks) were associated with about 70 percent higher relative risks compared with no heavy drinking at all in the same cat-egories. For female former drinkers, the effect amounted to an 80 percent increase, and there was a difference of about 35 percent for female light drinkers (up to one drink a day on average). However, it must be noted that the overall effect of alcohol consumption on all-cause mortality was not signifi-cant for females. Looking into the causes of death by sex in our sample, there were no overall significant differences when the causes of death were divided into neoplastic, car-diovascular, cerebrovascular, accidental, and other cate-gories. The largest difference in categories was for acciden-tal causes of death (7 percent for males vs. 4 percent for females; odds ratio 1.81, 95 percent confidence interval: 0.85, 3.85). Together with the relatively small sample sizes for the heavy average and heavy drinking pattern categories in females, this difference may have contributed to the fact that, for this gender, no significant relation emerged.
The effect of patterns within the low to moderate volume category of drinking found here cannot be explained by the correlation between volume and pattern as suggested by
Mäkelä (42) in discussing the results of drinking patterns on social problems. First, the within-category correlation is not that high (0.2–0.3 correlation between volume and pattern within the categories used), and second, the curve for all-cause mortality is not linear as in many social problems; in this instance, a higher average volume does not automati-cally lead to higher risks of mortality. Consequently, the cat-egory with the lowest mortality risk for males here was drinking >2–4 drinks and for females, >1–2 drinks.
Thus, investigating pattern effects allows consideration of a new dimension of drinking that is, at least for the lower drinking categories, independent of volume and that appears to influence mortality independently of volume (43, 44). In this sense, including drinking patterns in assessments of alcohol consumption in mortality studies is necessary to capture this independent dimension. Based on the present results, the main contribution of pattern measures is not to improve volume estimates, which seems to be the main thrust of recent publications on the topic of improved alco-hol measures (19, 45), but to contribute independently to explaining the outcome. In the data presented, for example, males drinking up to two drinks a day had a risk relative to that of lifetime abstainers of 1.07 without monthly heavy drinking occasions but a risk of 1.84 when they had such heavy drinking occasions (table 3). Thus, within the same range of average volume of consumption, the risks of all-cause mortality associated with the pattern of obtaining that volume differed quite substantially.
The reason for the relation of drinking patterns to overall mortality may be that certain patterns of drinking, especially frequent heavy drinking/intoxication, more closely relate to acute causes of death. Instances of occasional heavy drink-ing of people who on average are drinkdrink-ing lightly to moder-ately on average are one aspect of the prevention paradox in alcohol epidemiology (46, 47). Risk function analyses among survivors have found that, at low volumes, risks of injuries (48), driving while drinking (49), and even alcohol dependence symptoms (50) are largely limited to those who at least occasionally drink heavy quantities. Therefore there are several plausible mechanisms for excess mortality with this pattern of consumption.
Given our overall sample size, the cause of death data col-lected did not allow for detailed analysis of causes of death by sex and drinking pattern, controlling for such other vari-ables as age. However, among the 31 people who died an accidental death, there was a more than 10 percent higher proportion of people with ≥5 drinks on any occasion during the last year and a 6 percent higher proportion of people with ≥8 drinks on any occasion during the last year com-pared with the general population. This can serve only as a preliminary indication because of the small sample involved. However, taken together with the emerging litera-ture on patterns, it is recommended that all fulitera-ture epidemi-ologic studies involving alcohol should include patterns of drinking measures, such as the graduated frequency approach (26), and that these patterns should be analyzed as an additional dimension to volume (51).
The results also indicate that past problem drinking was also related to higher mortality. This finding underlined
TABLE 5. Relative risks (RRs)*for past problematic drinking by sex, adjusted for other protective and risk factors, National Alcohol Survey, 1984–1985
Past problematic drinking
1.64 1.56§
*Relative risks are compared with lifetime abstention. † Adjusted by age and ethnicity.
‡ CI, confidence interval.
§ Model adjusted for volume of drinking. Males RR† Females 0.98, 2.76 0.92, 2.65 95% CI‡ RR† 95% CI 2.18 2.26§ 1.12, 4.24 1.16, 4.42
again the importance of making the distinction between life-time and current abstainers (exdrinkers), some of the latter group being past problem drinkers (6, 7). In many epidemi-ologic studies, even recent ones, this distinction was not made, leading to an overestimation of the protective effect of moderate drinking on mortality (52). It is also important to explore this effect further. How long does it persist? Under what conditions does the mortality risk of ex-problem drinkers reverse to normal, for example, to the risk level of lifetime abstainers or moderate drinkers? Such questions are important for planning public health remedies. They can be addressed only if future alcohol epidemiology is based on measures capturing drinking patterns, reliable and valid measures of past consumption or problems, and improved research designs incorporating repeated measures to track changes in drinking and to relate them to mortality (8).
ACKNOWLEDGMENTS
This work was supported by grant R01 AA10960 (Alcohol and Mortality—Ethnic and Social Influences) and Center grant P50 AA05595 from the National Institute on Alcohol Abuse and Alcoholism to the Alcohol Research Group, Public Health Institute.
The authors thank Dr. Gerhard Gmel for his suggestions to improve an earlier version of this text.
An earlier version of this paper was presented at the 25th Annual Alcohol Epidemiology Symposium of the Kettil Bruun Society for Social and Epidemiological Research on Alcohol, Montreal, Canada, May 31–June 4, 1999.
REFERENCES
1. Pearl R. Alcohol and longevity. New York, NY: Knopf, 1926. 2. English DR, Holman CDJ, Milne E, et al. The quantification of
drug-caused morbidity and mortality in Australia, 1992. Canberra, Australia: Commonwealth Department of Human Services and Health, 1995.
3. White I. The level of alcohol consumption at which all-cause mortality is least. J Clin Epidemiol 1999;52:967–75.
4. Rehm J, Bondy S. Alcohol and all-cause mortality: an overview. In: Chadwick DJ, Goode JA, eds. Alcohol and car-diovascular diseases. Chichester, UK: Wiley, 1998:223–32. 5. Rehm J. Alcohol consumption and mortality. What do we
know and where should we go? Addiction 2000;95:989–95. 6. Shaper AG. Alcohol and mortality: a review of prospective
studies. Br J Addict 1990;85:837–47.
7. Shaper AG. A response to commentaries: the effects of self-selection. Br J Addict 1990;85:859–61.
8. Shaper AG, Wannamethee G, Walker M. Alcohol and mortal-ity in British men: explaining the U-shaped curve. Lancet 1988;2:1267–73.
9. Artaud-Wild SM, Connor SL, Sexton G, et al. Differences in coronary mortality can be explained by differences in choles-terol and saturated fat intake in 40 countries but not in France and Finland: a paradox. Circulation 1993;88:2271–9. 10. Skog O-J. Public health consequences of the J-curve
hypothe-sis of alcohol problems. Addiction 1996;91:325–37.
11. Rehm J, Sempos CT. Alcohol consumption and all-cause mor-tality—questions about causality, confounding, and
methodol-ogy. Addiction 1995;90:493–8.
12. Rehm J, Sempos CT. Alcohol consumption and all-cause mor-tality. Addiction 1995;90:471–80.
13. Murray RF, Rehm J, Shaten J, et al. Does social integration confound the relation between alcohol consumption and mor-tality in the Multiple Risk Factor Intervention Trial (MRFIT)? J Stud Alcohol 1999;60:740–5.
14. Willett WC, Sampson L, Browne ML, et al. The use of a self-administered questionnaire to assess diet four years in the past. Am J Epidemiol 1988;27:188–99.
15. Willett W. Nutritional epidemiology. New York, NY: Oxford University Press, 1990.
16. Willett WC, Sampson L, Stampfer MJ, et al. Reproducibility and validity of a semiquantitative food frequency question-naire. Am J Epidemiol 1985;122:51–65.
17. Willett WC, Reynolds RD, Cottrell-Hoehner C, et al. Validation of a semi-quantitative food-frequency question-naire: comparison with a 1-year diet record. J Am Diet Assoc 1987;87:43–7.
18. Rimm EB, Giovannucci EL, Stampfer MJ, et al. Reproducibility and validity of an expanded self-administered semiquantitative food frequency questionnaire among male health professionals. Am J Epidemiol 1992;135:1114–26. 19. Feunekes GI, van’t Veer P, van Staveren SW, et al. Alcohol
intake assessment: the sober facts. Am J Epidemiol 1999;150: 105–12.
20. Rehm J, Ashley MJ, Room R, et al. Drinking patterns and their consequences: report from an international meeting. Addiction 1996;91:1615–21.
21. Rehm J. Re: “Alcohol intake assessment: the sober facts.” Am J Epidemiol 2000;151:436–8.
22. Greenfield TK. Evaluating competing models of alcohol-related harm. Alcohol Clin Exp Res 1998;22(suppl):52S–62S. 23. Rehm J. Measuring quantity, frequency, and volume of
drink-ing. Alcohol Clin Exp Res 1998;22(suppl):4S–14S.
24. Puddey IB, Rakic V, Dimmitt SB, et al. Influence of pattern of drinking on cardiovascular disease and cardiovascular risk fac-tors—a review. Addiction 1999;94:649–63.
25. Greenfield TK. Individual risk of alcohol-related disease and problems. In: Heather N, Peters TJ, Stockwell T, eds. International handbook of alcohol problems and dependence. Chap 21. Chichester, UK: Wiley, in press.
26. Rehm J, Greenfield TK, Walsh G, et al. Assessment methods for alcohol consumption, prevalence of high risk drinking, and harm: a sensitivity analysis. Int J Epidemiol 1999;28:219–24. 27. Chadwick DJ, Goode JA, eds. Alcohol and cardiovascular
dis-eases. Chichester, UK: Wiley, 1998.
28. Clark WB, Hilton M. Alcohol in America: drinking practices and problems. Albany, NY: State University of New York Press, 1991.
29. Room R. Measuring alcohol consumption in the United States: methods and rationales. Res Adv Alcohol Drug Probl 1990;10:39–80.
30. Knupfer G. The risks of drunkenness (or, ebrietas resurrecta): a comparison of frequent intoxication indices and of population sub-groups as to problem risks. Br J Addict 1984;79:361–73. 31. Taj N, Devera-Sales A, Vinson DC. Screening for problem
drinking: does a single question work? J Fam Pract 1998; 46:328–35.
32. Mäkelä P, Valkonen T, Martelin T. Contribution of deaths related to alcohol use of socioeconomic variation in mortality: register-based follow-up study. BMJ 1997;315:211–16. 33. Schrijvers CT, Stronks K, van de Mheen HD, et al. Explaining
educational differences in mortality: the role of behavioral and material factors. Am J Public Health 1999;89:535–40. 34. Rehm J, Fichter MM, Elton M. Effects on mortality of alcohol
consumption, smoking, physical activity, and close personal relationships. Addiction 1993;88:101–12.
35. Huibregts P, Feskens E, Rasanen L, et al. Dietary patterns and 20 year mortality in elderly men in Finland, Italy, and the Netherlands: longitudinal cohort study. BMJ 1997;315:13–17. 36. Pafferbarger RS, Lee IM. Intensity of physical activity related to incidence of hypertension and all-cause mortality: an
epi-demiologic view. Blood Press Monit 1997;2:115–23.
37. Cox DR. Regression models and life tables. J R Stat Soc (B) 1972;34:187–202.
38. Kalbfleisch J, Prentice RL. The statistical analysis of failure time data. New York, NY: Wiley, 1980.
39. Groves RM. Survey errors and survey costs. New York, NY: Wiley, 1989.
40. US Department of Health and Human Services. National Death Index user’s manual. Washington, DC: National Center for Health Statistics, 1990.
41. Gaziano JM, Buring JE. Alcohol intake, lipids, and the risks of myocardial infarction (with discussion). In: Chadwick DJ, Goode JA, eds. Alcohol and cardiovascular diseases. Chichester, UK: Wiley, 1998:86–110.
42. Mäkelä K. How to describe the domains of drinking and con-sequences. Addiction 1996;91:1447–9.
43. Kauhanen J, Kaplan GA, Goldberg DE, et al. Frequent hang-overs and cardiovascular mortality in middle-aged men. Epidemiology 1997;8:310–14.
44. Kauhanen J, Kaplan GA, Goldberg DE, et al. Beer binging and mortality: results from the Kuopio Ischemic Heart Disease Risk Factor Study, a prospective population-based study. BMJ 1997;315:846–51.
45. McCann SE, Marshall JR, Trevisan M, et al. Recent alcohol intake as estimated by the Health Habits and History Questionnaire, the Harvard Semiquantitative Food Frequency Questionnaire, and a more detailed alcohol intake question-naire. Am J Epidemiol 1999;150:334–40.
46. Kreitman N. Alcohol consumption and the preventive paradox. Br J Addict 1986;81:353–63.
47. Skog O-J. The prevention paradox revisited. Addiction 1999;94:743–9.
48. Cherpitel C, Tam T, Midanik L, et al. Alcohol in non-fatal injury in the U.S. general population: a risk function analysis. Accid Anal Prev 1995;27:651–61.
49. Midanik LT, Tam TW, Greenfield TK, et al. Risk functions for alcohol-related problems in a 1988 US national sample. Addiction 1996;91:1427–37.
50. Caetano R, Tam T, Greenfield T, et al. DSM-IV alcohol depen-dence and drinking in the US population: a risk analysis. Ann Epidemiol 1997;7:542–9.
51. Rehm J, Gmel G. Gaps and needs in international alcohol epi-demiology. J Subst Use 2000;5:6–13.
52. Renaud S, Guégen R, Schenker J, et al. Alcohol and mortality in middle-aged men from eastern France. Epidemiology 1998; 9:184–8.