Journal of Information Technology Management
ISSN #1042-1319
A Publication of the Association of Management
A CASE STUDY OF TESTING A WEB-BASED APPLICATION USING
AN OPEN-SOURCE TESTING TOOL
SON BUI
UNIVERSITY OF MEMPHIS
[email protected]MANISH SHRIVASTAVA
UNIVERSITY OF MEMPHIS
[email protected]EUNTAE “TED” LEE
UNIVERSITY OF MEMPHIS
[email protected]JASBIR DHALIWAL
UNIVERSITY OF MEMPHIS
[email protected]ABSTRACT
Software testing in general is a very difficult task and testing web-based applications can be even harder due to the market pressure and short time response to a larger scale of users. We present a case study that demonstrates how to test a complex web-based application system by using a low-cost open-source testing tool in order to conduct performance testing and load testing. The open-source testing tool we chose greatly helped us evaluate the different performance levels of a complex Transportation Management System (TMS) and identify two critical performance issues before the actual deployment. This tool turned out to be very cost-effective and useful to identify the potential performance problems before actual production or implementation.
Keywords: Software testing, Web-based application testing, Open-source testing software.
INTRODUCTION
Software testing is a very difficult task and testing web-based applications can be even harder due to the market pressure and short time response to a larger scale of users. Indeed, recently Hieatt and Mee [4] argue that web-based application testing is very
time-consuming, lacks of direct pay-off, and often is neglected by software testers. Testing a web-based application is often pushed back to the last phase of the development when the pressure soars, and it typically requires significant amount of resources to commit. This article examines how to resolve the issue of resource commitment for web-based application testing. The important issue on hand is to decide how much time and
effort are needed to avoid common testing casualty. For the companies those have limited budget on IT resources, resource commitment is a critical question that every testing team needs to answer before launching on any project to test a web-based application.
Given the importance of testing web-based applications with limited IT resources, it is necessary for organizations to implement a feasible strategy to reduce cost and respond to fast-paced market while meeting, or even exceeding the requirements to produce a product with high quality. To address this dilemma, we present a case study from a multi-national firm that struggled to maintain the quality of web-based application testing with limited IT resources. The solutions will require rigorous understanding of IT business procedures, and willingness of the testing team to experiment innovative approaches to discover “the sweet spot” to increase productivity of the web-based application testing. The testing team needs to explore the following issues: 1) how can a web-based application team develop a new and efficient way to test web-based application? 2) when should the new approach be used? 3) and what kind of technologies will be needed to implement this new approach? To address these issues, we conduct a case study and will demonstrate that it can be a viable strategy to use an open- source tool in order to better manage and negotiate with stakeholders by still testing a web-based application system and managing to deliver it with the high quality, especially when there is a constraint of tight or limited budget.
We start with the discussion of testing activities for web-based applications and move on to the alternative
approach to testing a web-based application by using an open-source testing tool, called Grinder. Based on the testing objectives and historical data, we then develop optimal testing strategies by using four different types of testing scenarios. Next, we present the testing results and interpretations/implications of the testing results. Finally, we end our paper with the summary and conclusion.
TESTING ACTIVITIES FOR
WEB-BASED APPLICATIONS
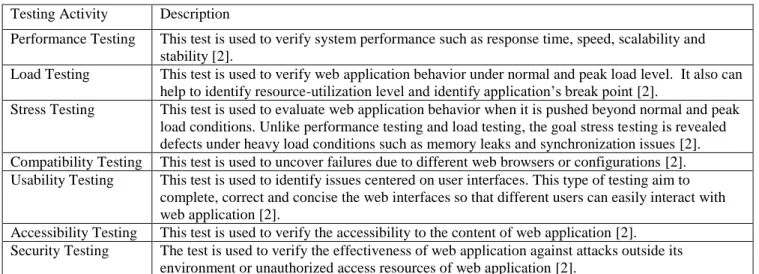
There are a number of ways to test web-based applications and each testing activity could provide different results regarding the expectation of software testers. Because numerous factors can affect the based application and the running environment, the web-based application testing needs to be considered from two different perspectives: the functional requirement and the non-functional requirement. Both of these testing perspectives are complementary and crucial to web-based application testing. The functional requirement testing can be applied to the traditional testing procedures in software testing. On the other hand, the non-functional requirement testing is unique in testing a web-based application due to its dynamic environment that the web application interacts with. Thus, our study is to focus more on the non-functional requirement testing. Table 1 summarizes seven different testing activities that are commonly used in non-functional requirement testing:
Table 1: Activities Involved in Non-Functional Requirement Testing
Testing Activity DescriptionPerformance Testing This test is used to verify system performance such as response time, speed, scalability and stability [2].
Load Testing This test is used to verify web application behavior under normal and peak load level. It also can help to identify resource-utilization level and identify application’s break point [2].
Stress Testing This test is used to evaluate web application behavior when it is pushed beyond normal and peak load conditions. Unlike performance testing and load testing, the goal stress testing is revealed defects under heavy load conditions such as memory leaks and synchronization issues [2]. Compatibility Testing This test is used to uncover failures due to different web browsers or configurations [2]. Usability Testing This test is used to identify issues centered on user interfaces. This type of testing aim to
complete, correct and concise the web interfaces so that different users can easily interact with web application [2].
Accessibility Testing This test is used to verify the accessibility to the content of web application [2]. Security Testing The test is used to verify the effectiveness of web application against attacks outside its
environment or unauthorized access resources of web application [2].
Among those seven types of testing, performance testing and load testing are probably the two most common for large web- based applications. Most systems are tested for functionality (i.e. compatibility testing, usability testing etc.), but not performance testing [3]. Indeed, both performance testing and load testing could identify potential problem areas causing poor performance when a web application runs at the normal load conditions. If the system does not perform well, it could hurt the reputation and credibility of the application and the project leader [3]. In this article, we present a case study that demonstrates how to test complex web-based application systems by using open-source testing software to conduct performance testing and load testing.
USING AN OPEN SOURCE
TESTING SOFTWARE AS AN
ALTERNATIVE APPROACH
As an alternative approach, open source testing software can be used to reduce the cost of web-based application testing. Open source software is a free software that is given to the users to use and modify, and often depends on the heart of the open source software community to develop. It is common nowadays that many open source software, such as Apache, are widely used and supported by several giant IT industry companies such as IBM and Apple.
In order to demonstrate the benefits of using open source web-based application for software testing, we adopt Grinder to test web-based application to assess the different performance levels of web-based application. Grinder is an open-source Java load testing framework that enables to run web testing by using multiple load injector machines. Because Grinder is free, it can reduce IT spending in terms of licensing cost compared to proprietary software testing. Common proprietary testing software like LoadRunner and NeoLoad typically
consume a big chunk of IT spending depending on the number of users and supported features.
Other benefits of Grinder are customizability and code reusability. Just like other open source software, Grinder provides testers with more freedom to customize software, and ability to reuse its code without being bothered by license terms. Users can freely modify Grinder to fit into their needs, and reuse its code as they wish. Those features are totally different from those features available in proprietary web-based application testing software.
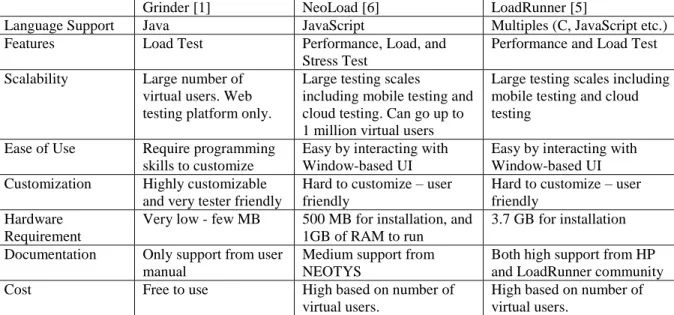
Along with software customization and code reusability of open-source software, Grinder can be also fast deployed in terms of ease of installment and simplicity in running test cases, and provides load test independency for testers. These two features are very crucial in testing web-based applications. Typically, many proprietary web testing software such as LoadRunner and NeoLoad require extensive understanding of how to run and install the software. The installation and script running of the testing software also consume tremendous computer resources due to the heavy supporting features. On the other hand, Grinder is scripted by Jython, a Java implementation of the Python programming language, and is relatively small and easy to set up for web-based application testing compared to other proprietary web testing software. Secondly, instead of simply presenting response times of a web-based application under the load test, Grinder provides detailed information about running test cases and flexible customization for testers to test. In many cases, testers often delay load testing to other groups such as QA teams, and tend to skip the scalability testing for web-based application components. Grinder is more suitable for testers who want to test the interior of their web-based application and not just the response time via the user interface. Table 2 below summarizes the main features of Grinder in comparison to LoadRunner and NeoLoad.
Table 2: Comparison of Grinder with Other Common Web-based application Testing Software
Grinder [1] NeoLoad [6] LoadRunner [5]
Language Support Java JavaScript Multiples (C, JavaScript etc.) Features Load Test Performance, Load, and
Stress Test
Performance and Load Test Scalability Large number of
virtual users. Web testing platform only.
Large testing scales
including mobile testing and cloud testing. Can go up to 1 million virtual users
Large testing scales including mobile testing and cloud testing
Ease of Use Require programming skills to customize
Easy by interacting with Window-based UI
Easy by interacting with Window-based UI Customization Highly customizable
and very tester friendly
Hard to customize – user friendly
Hard to customize – user friendly
Hardware Requirement
Very low - few MB 500 MB for installation, and 1GB of RAM to run
3.7 GB for installation Documentation Only support from user
manual
Medium support from NEOTYS
Both high support from HP and LoadRunner community
Cost Free to use High based on number of
virtual users.
High based on number of virtual users.
DEVELOPING OPTIMAL TESTING
STRATEGIES BASED ON TESTING
OBJECTIVES
Testing web-based application could be very stressful due to market pressure and limited time to run the test. Web-based application testers often feel overwhelmed and are unable to complete their tasks if there is no clear testing strategy developed before the actual testing job starts. One of the effective testing strategies we used is to develop optimal testing strategies based on the confirmed objectives of the testing with our stakeholders. The step of optimizing testing strategies often requires both 1) good understanding of the web-based application systems and testing requirements, and 2) IT planning strategy to accomplish the required tasks.
The first step to develop optimal testing strategies is to understand the web-based application system to be tested and the objectives of testing. In our case, we use Grinder to evaluate the different performance levels of a very complex Transportation Management System (TMS) which is a multi-tier web based application system consisting of application systems, web servers, and database systems. The core functionalities of TMS are to provide transportation planning, transportation execution, tracking and tracing, and freight payment to several customers in North America using a Software-As-A-Service model. Because of repetitive performance issues and concerns of
customers, the Information Technology (IT) management has suggested an upgrade to the hardware and software of the application to the latest version of TMS. Before an actual upgrade is implemented, the IT team set up a prototype testing environment to conduct system load testing and performance testing on the new application system. The objective of this testing is to build a confidence between business customers and the IT management to demonstrate that this new TMS will meet or exceed the performance expectations of its customers under a variety of load conditions. The CPU utilization of the web-based application system is also captured to provide a broader picture on how the increase in processing load would impact the CPU usage and system resources.
In order to effectively achieve the objectives of the testing, historical data is used to create optimal testing strategies. First, we identified the most common and important functional steps that are expected to be performed on the TMS application. We then categorized these core functional steps into four testing strategies. The first of these strategies was Type 1 testing which included 17 test cases. The remaining three strategies used 6 test cases in varying percentages of functional steps to simulate the Load Planning Center user (Type 2) the Visibility User (Type 3) and the combination of both users (Type 4). The numbers of test cases used in all four test strategies are based on the most common and general functions that the TMS must strategically and tactically provide for the logistic firm.
By using Grinder, we created virtual users and virtual scripts to perform each test case scenario as if it were done by users in a real system. Virtual users performed certain tasks identified in the test cases listed below.
Type 1: Simple Test
Each of 17 functional test cases performed one at a time with three different user levels, 1 user, 50 users and 100 users, by doing the same steps simultaneously. These three levels of different users for this testing are based on past experiment and judgment of various factors including typical user base of the system, need of testing and investment that we wanted to make on this testing. Table 3 shows descriptions of 17 test cases.
Type 2: Load Planning Center User Test
For all of the tests, the system was loaded with integration transactions to bring it closer to the real world. This arrangement could allow TMS to process inbound and outbound integrations from/to various systems.
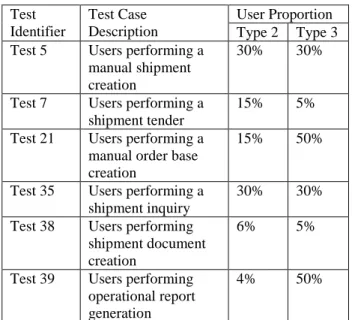
In this scenario, we simulated a combination of tests by keeping dominating load on the planning related functional steps. We used only one user level of 50 users in this testing in order to simulate users doing different tasks in the proportion of percentage specified for each test case Table 2. Similar to Type 1, the number of users chosen based on various factors such as user bases, testing needs, and the amount of investment we committed in the test. The percentages of users for six test cases were based on our historical data of the company and prediction of top managers about the future growth of the company. For example, our data analysis showed that approximately 25% of users perform shipment inquiry. Thus, we chose 30% to indicate future need of that function. In addition, this testing focuses on organizational planning functions too. We increased the load for any transactional processing test cases related to planning (i.e. shipment tender and shipment inquiry).
Type 3: Visibility Users Test
In this scenario, we simulated a combination of tests by keeping dominating load on the visibility functionality. As in Type 2, we also used only one user level of 50 users in this testing in order to simulate users doing different tasks in the proportion of percentage specified for each test case in Table 3. The number of users chosen based on internal judgments such as the need of testing and user bases. Similarly, the percentages of users for six test cases were based on our historical data and top manager’s prediction. In this testing, we,
however, increased the amount of operational report generation functions because this testing primarily focused on creating report or searching data from the system.
Table 3: Type 2 and Type 3 Test Case Scenarios
Test Identifier Test Case Description User Proportion Type 2 Type 3 Test 5 Users performing amanual shipment creation
30% 30%
Test 7 Users performing a shipment tender
15% 5% Test 21 Users performing a
manual order base creation
15% 50%
Test 35 Users performing a shipment inquiry
30% 30% Test 38 Users performing
shipment document creation
6% 5%
Test 39 Users performing operational report generation
4% 50%
Type 4: Mixed Environment
This last testing scenario had five complete runs of 50, 100, 200, 300, and 400 users. These test cases included simulating both Visibility Users and Load Planning Center Users. The purpose of this testing was to observe the performance for each major category. This is a test with mixed scenarios that include loads from both previous two tests, Type 2 and Type 3, so that we can simulate closer to daily transactions load for the systems. We used the same proportion of users as it was used in Type 2 and Type 3 on simultaneous basis.
TESTING RESULTS AND
INTERPRETATIONS
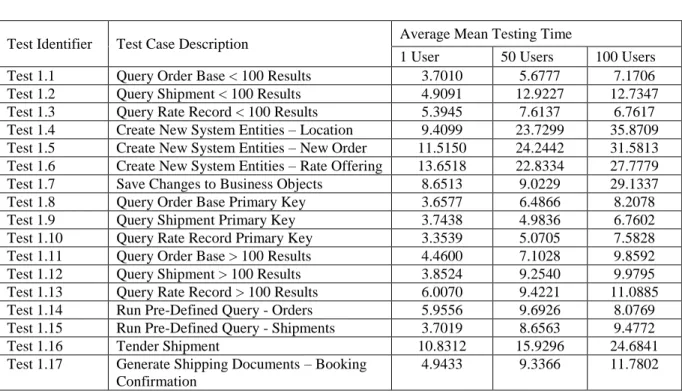
Type 1: Simple Test
The average testing time indicates the average of time to run each test after running the test multiple times. In general, the average mean testing time significantly increased when we tested with 1 user comparing when we test with 50 users and 100 users. In contrast, the average testing time moderately increased when we tested with 50 users comparing when we tested 100 users. The three test cases, Test 1.2, Test 1.3, and Test 1.14, are the only test
cases the server processed faster with 100 users than with 50 users. Some of the test cases experienced (e.g., Tender Shipment, Create New System Entities –Rate Offering)
more average testing time than the others. This indicates that some cases require significantly more CPU usage than the others.
Table 4: Type 1 Test Results
Test Identifier Test Case Description Average Mean Testing Time
1 User 50 Users 100 Users Test 1.1 Query Order Base < 100 Results 3.7010 5.6777 7.1706 Test 1.2 Query Shipment < 100 Results 4.9091 12.9227 12.7347 Test 1.3 Query Rate Record < 100 Results 5.3945 7.6137 6.7617 Test 1.4 Create New System Entities – Location 9.4099 23.7299 35.8709 Test 1.5 Create New System Entities – New Order 11.5150 24.2442 31.5813 Test 1.6 Create New System Entities – Rate Offering 13.6518 22.8334 27.7779 Test 1.7 Save Changes to Business Objects 8.6513 9.0229 29.1337
Test 1.8 Query Order Base Primary Key 3.6577 6.4866 8.2078
Test 1.9 Query Shipment Primary Key 3.7438 4.9836 6.7602
Test 1.10 Query Rate Record Primary Key 3.3539 5.0705 7.5828
Test 1.11 Query Order Base > 100 Results 4.4600 7.1028 9.8592 Test 1.12 Query Shipment > 100 Results 3.8524 9.2540 9.9795 Test 1.13 Query Rate Record > 100 Results 6.0070 9.4221 11.0885 Test 1.14 Run Pre-Defined Query - Orders 5.9556 9.6926 8.0769 Test 1.15 Run Pre-Defined Query - Shipments 3.7019 8.6563 9.4772
Test 1.16 Tender Shipment 10.8312 15.9296 24.6841
Test 1.17 Generate Shipping Documents – Booking Confirmation
4.9433 9.3366 11.7802
Type 2 and Type 3: Load Planning Center
User Test and Visibility User Test
Figure 1 indicates that each of the servers was lightly tasked with the exception of the Veritas Cluster Server (VCS) cluster server 1 seeing all the activity and VCS cluster server 2 basically idle.
Figure 1 also shows the Web Servers experiencing the same load as in the previous Type 2 test with the Application Servers experiencing a larger impact (almost doubled). Again, the second database server cluster is idle with the first VCS taking the entire load.
Type 4: Mixed Environment
This last scenario had five complete runs of 50, 100, 200, 300, and 400 users. These tests runs included simulating both Visibility Users and Load Planning Center Users. The data collected from these tests revealed some configuration limitations regarding the Connection Pool for the Web Servers.
CPU Usages for Application, Web, and
Database Servers
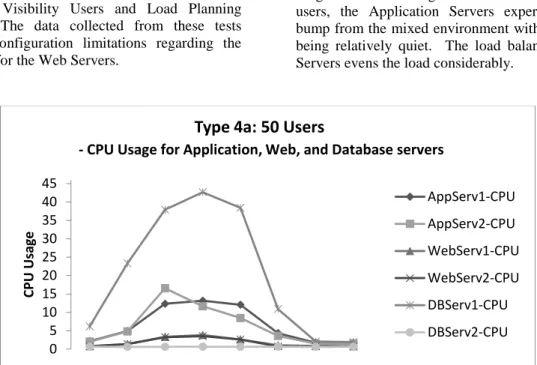
Each run is represented by a graph of the CPU usage as shown in Figure 2. For the testing run with 50 users, the Application Servers experienced a modest bump from the mixed environment with the Web Servers being relatively quiet. The load balancing on the Web Servers evens the load considerably.
Figure 2: Type 4a Test Result
For testing run with 100 users (as shown in Figure 3), the Web Servers started to experience a modest increase in the larger load but the Application Servers were relatively unfazed by the increase in users. The
Database Server had increased above 50% usage on the CPU with still no sign of impact on the second Database Server.
Figure 3: Type 4b Test Result
0 5 10 15 20 25 30 35 40 45 CPU Usag e
Type 4a: 50 Users
- CPU Usage for Application, Web, and Database servers
AppServ1-CPU AppServ2-CPU WebServ1-CPU WebServ2-CPU DBServ1-CPU DBServ2-CPU 0 5 10 15 20 25 30 35 40 45 50 55 CP U Us ag e
Type 4b: 100 Users
- CPU Usage for Application, Web, and Database servers
AppServ1-CPU AppServ2-CPU WebServ1-CPU WebServ2-CPU DBServ1-CPU DBServ2-CPU
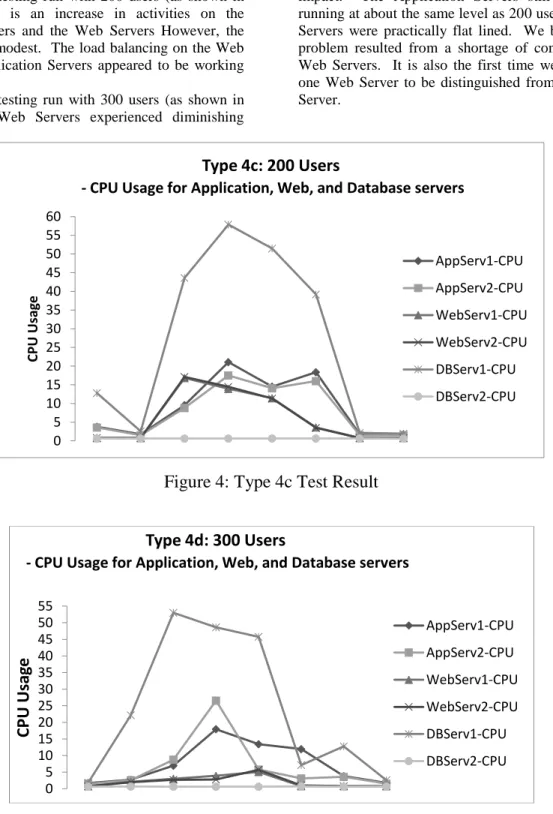
For the testing run with 200 users (as shown in Figure 4), there is an increase in activities on the Application Servers and the Web Servers However, the impact was still modest. The load balancing on the Web Servers and Application Servers appeared to be working very well.
For the testing run with 300 users (as shown in Figure 5), the Web Servers experienced diminishing
impact. The Application Servers still seemed to be running at about the same level as 200 users, but the Web Servers were practically flat lined. We believe that this problem resulted from a shortage of connections to the Web Servers. It is also the first time we could observe one Web Server to be distinguished from the other Web Server.
Figure 4: Type 4c Test Result
Figure 5: Type 4d Test Result
0 5 10 15 20 25 30 35 40 45 50 55 60 CPU Usag e
Type 4c: 200 Users
- CPU Usage for Application, Web, and Database servers
AppServ1-CPU AppServ2-CPU WebServ1-CPU WebServ2-CPU DBServ1-CPU DBServ2-CPU 0 5 10 15 20 25 30 35 40 45 50 55
CPU
Usa
ge
Type 4d: 300 Users
- CPU Usage for Application, Web, and Database servers
AppServ1-CPU AppServ2-CPU WebServ1-CPU WebServ2-CPU DBServ1-CPU DBServ2-CPU
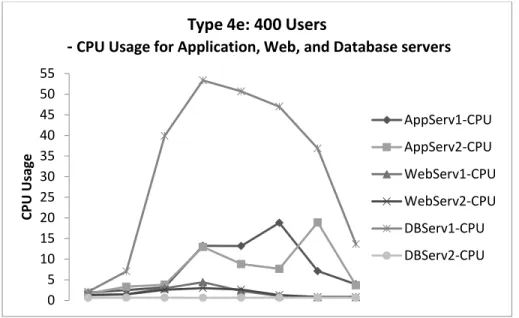
For the testing run with 400 users (as shown in Figure 6), the Database Server still experienced heavy load with approximately 53% of CPU usage. The Application Server 1 showed two signs of CPU usage overload. For this time, the Application Server 1 experienced significant work load than the first time.
Similarly to the Application Server 1, the Application Server 2 occurred CPU usage overload almost twice. However, it seems that the CPU usage load at the first time moderately decreased and then suddenly reached to the climax of the CPU usage load at the second time.
Figure 6: Type 4e Test Results
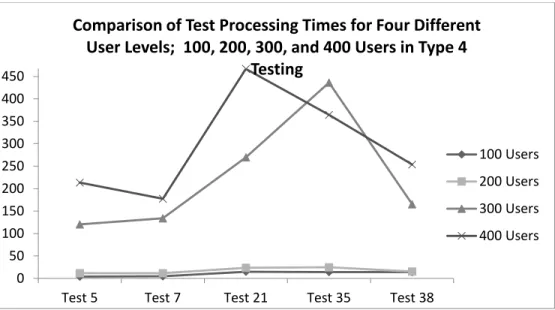
Comparison of Test Processing Times for
Four Different User Levels
The test processing time indicates the average of waiting time when we repeated the test multiple times. The increase in the test processing time from 100 users to 200 users was relatively small. The load of 200 users seemed to be the ideal for the out of the box settings.
On the other hand, the increase in the processing time from 200 users to 300 users suggested a greater delay in the time the Web Server was responding to the user. This is most likely due to a limited number of
connections to the Web Server as will be evidenced in Figure 5 for the CPU usages of Web Server for different user levels in the next subsection.
Regarding the increase in the processing time from 300 users to 400 users in Figure 4, Test 35 had a shorter wait time for 400 users than for 300 users. It seems that the task of “Tendering Shipments” requires more on the part of the Application Server than on the Web Server; once a connection is established there isn’t a great deal of interaction required at the Web Interface level. 0 5 10 15 20 25 30 35 40 45 50 55 CPU Usag e
Type 4e: 400 Users
-
CPU Usage for Application, Web, and Database servers
AppServ1-CPU AppServ2-CPU WebServ1-CPU WebServ2-CPU DBServ1-CPU DBServ2-CPU
Figure 7: Comparison of Test Processing Time
Closer look at the CPU usages of Web and
Application Servers
Figure 8 shows the activity for the Web Servers was practically non-existent especially for 50, 300, and 400 user levels while the Application Servers was active, but not overstressed. It makes sense to have a low CPU usage activity of Web Server for 50 users, but this represents a bottle-neck issue in the process. In addition, the CPU usage for Web Server has an interesting pattern. It would seem that the activity on the Web Server 1 significantly dropped off after 200 users. The 300 and 400
user levels for the Web Server appear to be at the same level as the user level of 50. As mentioned earlier, this would be most likely due to a limited number of connections to the Web Server.
On the other hand, CPU usages of the Application Server for five different user levels do not present any problematic patterns or issues. Yet, the 400 user level seems attenuated, that is, the requests didn’t seem to hit the server as quickly as with the user levels of 100 or 200.
Figure 8: Web Server and Application Server Usage Comparison
0 50 100 150 200 250 300 350 400 450
Test 5 Test 7 Test 21 Test 35 Test 38
Comparison of Test Processing Times for Four Different
User Levels; 100, 200, 300, and 400 Users in Type 4
Testing
100 Users 200 Users 300 Users 400 Users
IMPLICATIONS OF THE TESTING
RESULTS
We closely monitored 1) CPU utilization of Web Servers, Application Servers and Database Servers, and 2) the test processing time of various test scenarios with different virtual user levels for most common processes such as shipment tender, manual shipment creation, manual order base creation, shipment inquiry, shipment document creation, and operational report generation.
During the process of executing the four testing strategies, we observed two critical performance issues. The first issue has to do with the Web Server connections to the Application Servers. When the loading on the Web Server was increased to 300 and 400 users, CPU utilization went downwards instead of going upward (as demonstrated in the Figure 5). This pattern helped us diagnose the connection issue between the Web Servers and Application Servers. On the other hand, the Application Servers seems fully capable in handling the extra load. The second issue seems to be with the Database Servers. The second Database Server didn’t appear to be online as demonstrated in all the graphs for the CPU usages in the previous section. In all of the five CPU usage graphs, no activity of the second Database Server was observed. With the shift away from the Web Servers being a bottle-neck, the Database Servers might in fact become the new constraint, although at the heaviest loads the servers didn’t seem to extend far beyond 50 percent.
SUMMARY AND CONCLUSION
We used a case study from a multi-national firm to demonstrate how to successfully test a complex web-based application in order to deliver the application with the high quality web-based application even when only limited IT resource is available to the testing team. The results show that it can be a viable strategy to use an open source web source application testing tool to better manage and negotiate with stakeholders by still testing a web-based application and managing to deliver it with the high quality, especially when there is a constraint of tight or limited budget.
The benefits of using open-source software include low cost, software customization and code reusability. The open source testing tool we used for this study is Grinder, which facilitates fast deployment in terms of ease of installment and simplicity in running test cases, and provides load test independency for testers. These two features seem to be very crucial to test
web-based applications. Typically, many commercial web testing software such as LoadRunner and NeoLoad require extensive understanding of how to run and install the software, and are more expensive to deploy in a web-based application testing environment. In this case study, Grinder turns out to be very cost-effective and useful to identify the potential performance problems before actual production or implementation. Only the downside of using this tool was to hire consulting service for initial set-up and configuration as in any other open-source software. This can be very minimal considering the purchasing price of proprietary software testing tools.
We developed our optimal testing strategies based on the confirmed objectives of the testing with our stakeholders. Four testing strategies were developed by using our historical data to identify core functions of TMS: 1) a simple scenario with 17 typical tasks, 2) a test scenario for Load Planning Center users with 50 virtual users assigned to 6 different typical tasks, 3) a test scenario for Visual Functionality users with assigned to 6 different typical tasks, and 4) a mixed scenario for both Load Planning and Virtual functionality users with five different user levels: 50, 100, 200, 300, and 400.
In order to interpret our results, we compared multiple scenarios to find the limitations of web-based applications. We found two important and critical performance issues from the execution of these testing strategies: 1) the bottle-necked activities in the Web Server because of the connection issue between the Web Server and Application Server; and 2) no activation of the second Database Server. This case study greatly helped us identify these two important and critical performance issues before the actual implementation of the new TMS system. We fixed the Web Server connection issue and also improved application configuration. After these two improvements, the new TMS system was prepared to be hosted in real time. The prototype to the execution was approved into application deployment plan by the management.
This study helped the testing team to obtain confidence from business customers and the IT management. The study not only proved that the new web-based application will work on our real environment, but also provided a projection on actual CPU utilization of various load circumstances on all tiers of the application usage.
This study also demonstrates how the performance and load testing can be conducted for a very complex web-based application even with limited IT resources by using an open-source testing tool. We hope that our study can help those who want to evaluate web-based application systems on a tight budget with short window of time frame by using our four testing strategies.
REFERENCES
[1] Aston, P., "The Grinder, a Java Load Testing Framework", http://grinder.sourceforge.net/, August 2014.
[2] Di Lucca, G.A. and Fasolino, A.R., "Testing Web-based Applications: The State of the Art and Future Trends", Information and Software Technology, Volume 48, Number 12, 2006, pp.1172-1186. [3] Grossman, D., McCabe, M.C., Staton, C., Bailey,
B., Frieder, O. and Roberts, D.C., "Performance Testing a Large Finance Application", IEEE Software, Volume 13, Number 5, 1996, pp.50-54. [4] Hieatt, E. and Mee, R., "Going Faster: Testing the
Web Application", IEEE Software, Volume 19, Number 2, 2002, pp.60-65.
[5] HP, "LoadRunner",
http://www8.hp.com/us/en/software-solutions/loadrunner-load-testing/, August 2014.
[6] Neotys, "NeoLoad Key Features",
http://www.neotys.com/product/neoload-features.html, August 2014.
AUTHOR BIOGRAPHIES
Son Bui is a Ph.D. student of Management Information Systems at the University of Memphis. He holds undergrad and master degree in MIS from Brigham Young University. His research interests include economics of information systems, strategic alignment and business analytics.
Manish Shrivastava is a Business Analyst at Ingersoll Rand in Memphis TN. Manish is responsible for business applications such as ERP, WMS and TMS for a global distribution center. Manish has 14 years of work experience in all phases of SDLC including Software testing. Manish has worked with numerous fortune500 companies as an IT consultant in his previous consulting assignments. Manish’s special interest includes Supply Chain Systems and Technology, Enterprise Systems Integrations, Project Management and software testing. Manish holds an Executive MBA degree from University of Memphis and Project Management certification through Project Management Institute.
Euntae “Ted” Lee is currently an Associate Professor in the Department of Management Information Systems at the University of Memphis. He received his Ph.D. in Management Information Systems from University of Nebraska and MS in Computer Science from The Pennsylvania State University. His primary research interests are knowledge engineering and
management, business rule managements systems, database systems, software development/testing, and strategic use of organizational information systems. His work has been published in various journals and conference proceedings in IS and other related areas.
Jasbir Dhaliwal is Professor of Information Systems and Interim Dean of the Graduate at the University of Memphis. He is also a director of the Systems Testing Excellence Program at the FedEx Institute of Technology in the University of Memphis. He has a Ph.D. from the University of British Columbia, Canada and has published over fifty research papers in journals such as Information Systems Research, Information & Management, IEEE Transactions on Engineering Management, International Journal of Production Economics, European Journal of Information Systems, and in numerous conference proceedings of IS and related areas.