Abstract—This document presents a problem of knowledge
conflict appearing in Business Intelligence systems. The struc-ture of such class system in context of knowledge creating is presented in the first part of article. Next, the formal definition of knowledge structure of Business Intelligence, which is neces-sary to comparing these knowledge, was elaborated. The char-acteristic, sources and examples of knowledge conflicts is pre-sented in the final part of article. The detecting and resolving of this type of conflicts is necessary, because this allows receiving by user, from the system, the proper reports as a results of analyses. On the basis of these reports the user can takes the decision that lead to satisfying benefits.
I. INTRODUCTION
ONTEMPORARY social and economic environment makes quick and accurate decision-making crucial for the competitiveness of a company. Economy forces com-pany managers to make complex operational, tactical, yet most of all, strategic decisions that influence the future of the organization. Those who actually make decisions in a company, are usually exposed to risk and uncertainty, be-cause they cannot foresee the consequences of their deci-sions or their predictions have very low probability. There-fore, the entire decision-making process is very complicated.
C
Nowadays, decision making processes employ deci-sion-making support computer systems, as well as Business Intelligence (BI) class systems which are being used more and more often. They are used to support business decision making through smart use of data resources already avail-able in companies [8]. The purpose of Business Intelligence systems is to enable easy and safe access to information in a company, operation of its analysis and distribution of reports within the company and among its business partners, which in turn enables quick and flexible decision making. This al-lows the company to reach a higher level of flexibility and competitiveness. Because of the necessity to fully integrate business processes in a company, BI systems should cur-rently operate within a sub-system of an integrated manage-ment computer system. [2].
However, it often occurs that a BI system generates conflicts of different kinds, especially conflicts of knowledge gener-ated from various types of analyses. Conflicts of knowledge result from the fact that the system may offer different anal -ysis results or solutions of a single problem to the user. In
other words, conflict of knowledge occurs when the same objects in the world and the features are given different val -ues [7]. This mainly results from using different methods for business processes analysis. If a conflict of knowledge oc-curs in the system, the system will not be able to generate a satisfactory decision for the user and, consequently, the de-cision maker will find it hard to conduct the dede-cision-mak- decision-mak-ing process properly. The decision maker will then be forced to make a decision with no help from the system, which is time-consuming, requires much work and can lead to a deci-sion that is out-of-date (belated) and made with incomplete information. This situation has obviously negative influence on the work of the entire organization.
Therefore, the key element of BI systems’ operation is to de-tect and, consequently, properly resolve conflicts of edge. This article presented a formal definition of knowl-edge structure in BI system, as well as sources and charac-teristics of conflicts of knowledge regarding BI class sys-tems
II. THESTRUCTUREOF BUSINESSINTELLIGENCESYSTEMS At present, companies incur significant losses due to im-proper use of knowledge. Losses resulting from incorrect operation of knowledge management processes are very high and often constitute the main reason for companies go-ing bankrupt. Symptoms for improper use of knowledge in a company are as follows [6]:
• overdue reaction to changes in market environ-ment - the company does not keep up with com-petition and market needs,
• lack of knowledge at each level of organization -when the quality of work decreases,
• slow performance of tasks - occurs when it takes employees too long to locate the necessary knowledge,
• the problem of production quality - when the adaptation of production process do quality re-quirements drastically extends the process, • long sales cycles - when the response time of the
seller to the customer's needs extends.
The decisive factor that affects the use of knowledge as intangible resource of a company is efficient management. The essential purpose of knowledge resources management
Knowledge conflicts in Business Intelligence systems
Marcin Hernes
Wrocław University of Economics
ul. Komandorska 118/120, 53-345 Wrocław, Poland Email: [email protected]
Kamal Matouk
Wrocław University of Economics ul. Komandorska 118/120, 53-345 Wrocław,
Poland
Email: [email protected] Computer Science and Information Systems pp. 1241–1246
is to provide information for managers, which is then used for planning, control and decision making. Access to infor-mation needed for efficient management should be enabled by Business Intelligence system, because it has the ability to transform 'raw' (not processed) data into useful information that helps make more accurate decisions in a short time, with operational conditions constantly changing for the company in its environment, which evokes high risk and uncertainty.
Bi systems are often offered by various computer system producers as a complete system that supports a certain busi-ness area. Currently, the tools used in BI systems usually in-clude the following technologies:
• ETL - Extraction, Transformation and Loading, • DW - Data Warehouse,
• OLAP - OnLine Analytical Processing (multi-di-mensional real-time data analysis tool),
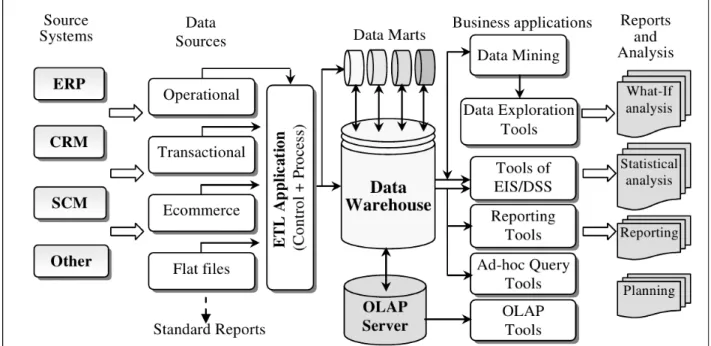
• DM - Data Mining, software for safe presenta-tion of informapresenta-tion (analyses, reports) on the net. All elements mentioned above are aimed at meeting the needs of different groups of users, such as managers that use pre-defined reports on a daily basis or analysts that design reports individually and prepare various business analyses. Most elements presented use Data Warehouse as one of the potential sources of information (see pic. 1).
The main source of data for Business Intelligence systems are transaction systems such as ERP, CRM, SCM or call center. Sometimes data is also extracted from text files, Ex-cel, Access, e-mail software or websites. All data should be gathered in one place (e.g. data warehouse) so that reports and analyses based on the data are complete. Data gathered in warehouses usually come from many different sources that store particular values in different ways and for that rea-son they must first undergo the process of ETL
'standardiza-tion' (Extraction, Transformation and Loading) [12]. ETL programs transform data. The process begins with extraction which consists in selective mining and loading data from transaction systems and other data sets. Next phase is trans-formation, i.e. necessary modification of data. For instance, transformation of numerical values signs, conversion of dates or currencies (e.g. dates being converted from English format into polish format, PLN currency into EUR). Last phase is upload of 'refined' data into the warehouse.
Fig 1 clearly shows that BI system uses advanced analyti-cal tools for real-time data analysis, including OLAP or data mining.
OLAP is a tool that allows to perform multi-dimensional analyses and display the results in approximately real time. There are two common groups of OLAP whose main differ-ence is the type of server used to build them. The first group includes all solutions based on ROLAP (Relation OLAP) data base, whilst the second group is built based on special-ized MOLAP (MultiDimensional OLAP) servers, also known as MD-OLAP.
Both techniques have their own pros and cons. ROLAP solutions are characterized by the ability to store large vol-umes of data, relatively easy data modification (resulting from the software used and data structure), but they also have their own disadvantages, such as: data structure com-plexity (resulting from the necessity to represent multi-di-mensional relations in a relation-like manner) as well as per-formance problems the result from lack of adaptation of re-lation structures to multi-dimensional analysis [2].
Whereas, MOLAP do have much smaller capabilities of data storage and find it difficult to modify data (it often oc-curs that data modification leads to rebuilding multi-dimen-sional structure), but they are also characterized by high per-formance of multi-dimensional analysis and natural repre-sentation of multi-dimensional structures.
Fig. 1 The overall structure of BI system and its cooperation with other information systems in the enterprise Source: own work.
A combination of both technologies may ensure a solu-tion that will unite the ability to store large amounts of data and effective multi-dimensional analysis. It will consist in employing a relation data base as data warehouse containing the entire set of elementary data, and MOLAP systems as Data Mart.
A user of OLAP analytical solutions has the ability to per-form analysis on available multi-dimensional base (the so-called ROLAP or MOLAP block) or use ready-made re-ports, defined with the block. Each block has dimensions, also known as perspectives, hierarchies and measures. Data analysis in many dimensions is very intuitive. For instance, while searching for sales figures for a product or a group of products, we are not only interested in general sales figures, but also sales figures categorized by customers and divided into particular periods of time. The area, the customer and time are the dimensions of the analysis and the sales figures are the measures [13].
Reports defined with the OLAP block are being updated while they are generated, therefore they contain current data as accurate as possible until the multi-dimensional block is refreshed again.
ROLAP or MOLAP block analysis consists in performing the following operations: [2]:
• change in detail of data(drill-down, drill-up), • change in section of analyzed data (slice and
dice),
• search for extreme values (exceptions), • presenting results in the form of graphs,
• contextual switching to detailed data (drill-through).
The ‘drill-through’ enables the user to proceed within a certain business area and then to switch to other areas with filters engaged beforehand (e.g. time, customer or product dimension). Consequently, it is possible to begin with an-other multi-dimensional analysis or a pre-defined report or to proceed to ‘ad hoc’ query environment.
Whereas, Data Mining is an analysis of business data (usually available from data warehouse) in order to detect any rules, relations, patterns and trends contained in them or to set forecasts that may prove useful when making deci-sions. Therefore, the methods allow to transform data into knowledge.
Data Mining is often considered a contemporary candi-date for Artificial Intelligence (Data Mining widely uses neural networks or decision trees). Most often, however, Data Mining employs statistical methods, such as regression, association or classification analysis. The methods are grounds for creating models used to analyze large amounts of data or samples for the existence of certain regularities, hidden relations and similar connections [10]. There are two distinct types of Data Mining [13]:
• hypothesis verification – used when there is a supposition about a significant relation among certain pieces of data and we want to verify it,
• knowledge discovery – used when we want to check if there are connections between pieces of data that man is unable to detect.
The most common use of Data Mining is, for instance, precise segmentation of customers and setting an optimal ‘customer basket’. Data Mining allows to know customers better, with their habits, preferences and the risk resulting from customer service. Thus, the company is able to offer proper products or services and gain customers’ loyalty.
Using different methods of data analysis enables the sys-tem to generate new knowledge, mostly about business pro-cesses performed in the company. However, the variety of analyses and the fact that they can be performed with infor-mation from heterogeneous sources [8] often leads to a situ-ation where a conflict of generated knowledge occurs. Auto-mated diagnostics and resolving conflicts of such nature by the system is essential, mainly for the sake of proper opera-tion of BI systems, which in turn influences the quickness and accuracy of decisions made by decision makers. How-ever, conducting diagnostic and resolving a conflict of knowledge is only possible when the knowledge is repre-sented as unitary structure, whose definition is will be given in this article.
III. KNOWLEDGESTRUCTUREOF BUSINESS INTELLIGENCE In order to determine the sources and characteristics of knowledge conflicts in BI it is necessary to formally define the structure of the knowledge gathered in the system. The literature of the subject contains, admittedly, the issues re-lated to this issue, however, they concern only one slice of BI, for example the OLAP cubes [4]. This article presents, the general definition of knowledge structure taking into ac-count the BI as whole.
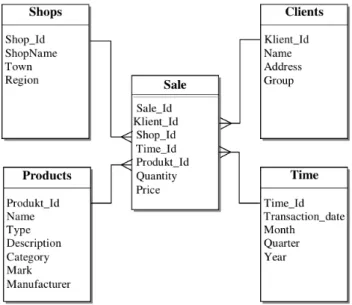
Assume that the database structure is represented in the form as shown in Figure 2:
Fig 2. Structure of Data Warehouse Source: own work.
Accumulation of large amounts of data describing the ac-tivities of the company. According to presented the structure of the database, in the long run makes it possible to carry out a detailed analysis of this activity, detection of certain appli-cations, depending on the draw and what further proceed-ings. For example, company executives may be interested in the implementation of the following analyses:
1. A value for the sales of products by increasing the lev-els of aggregation: from the city, state and country brand for different time periods.
2. Examine the profit from the sale of goods for individual producers in the designated months. Arrange the months according to the increasing value of the profit. 3. If the deviations contained in the average transaction of
individual months are important?
Answering this type of question is made, using the tools to multidimensional data analysis in real time - OLAP. With these types of activities takes over that [9]:
1. Analyzed data resides in databases (operating databases, in data warehouses or data stores), where the volume can be very diverse and reach from mega to multiple terabytes. In maintaining and processing such databases the conventional capabilities of database servers are used.
2. The analytical multidimensional processing, requires the presentation of data using a multidimensional model, where there are terms such as: a table of facts, aggregate functions, dimensions, dimension members, cells, and cell block.
3. The formulation of multidimensional query lan-guage-oriented requires multidimensional data query languages. Multidimensional data, as well as the results of the analysis of these data are very clear, when they are visualized graphically.
On the basis of characteristic of BI system, the structure of knowledge is defined as follows:
Definition 1.
The structure of knowledge in BI systems is called fol-lowing sequence:
WBI
=〈{
F
}
,
{
WYM
}
,
{
AN
}
,
{
R
}
,
ϑ
, SP , DT
〉
where: 1) F=〈{
f1, t1, m11, m12,…, m1n}
,{
f2, t2, m12, m22,…, m2n}
,……
{
f
k, t
k, m
k1, m
k2,
…
, m
nk}
〉
, where:{
f
1, f
2,
…
, f
k}
- denote the set of facts,{
t
1,t
2,
…
,t
k}
- denote the set of the date of the facts,{
m
11, m
xy,
…
, m
kk}
- denote the set of measuresas-signed another facts
{
f
1, f
2,
…
, f
k}
(
y
∈[
1
…
k
]
, x
∈[
1
…
n
])
,2)
WYM
=
{
w
1, w
2,
…
, w
i}
- denote set of dimensions,3)
AN
=
{
a
1, a
2,
…
, a
j}
- denote the set of types of analysis,4)
R
=
{
r
1, r
2,
…
, r
h}
- denote the set of types of re-ports,5)
ϑ
:
F
×
WYM
×
AN
→
R
- is at least partially a func-tion of knowledge, that mirrors elements of the Cartesian productF
×
WYM
×
AN
in elements ofR
set. Functionϑ
will be partially, when only selected elements of the Cartesian productF
×
WYM
×
AN
will be as its arguments,6)
SP
- denote the degree of certainty of reports,7)
DT
- denote the date of reports made on the basis of the analysis.The example of BI structure of knowledge is as follows: Set of facts ( F ):
Fact1 - On 06-04-2013 sold 10 pieces of the product X – the value of sales 100 EUR.
Fact2: On 07-04-2013 sold 6 pieces of the product Y – value of sales 300 EUR.
Fact3: On 10-04-2013 sold 20 pieces of the product Z – value of sales 200 EUR.
Dimensions (WYM):
Time={06-04-2013 … 10-04-2013}, Product={X, Y, Z}
Territory={Wielkopolskie: Client1, Client2, Dolnośląskie: Client3, Client4},
Client={Client 1: value of sales:100 EUR, Client 2: value of sales: lack of data, Client3: value of sales: lack of data, Client4: value of sales: 200 EUR}.
Set of types of analyses (AN):
Analysis1 - The total value of sales of individual products in the period: 01-04-2013 to 30-04-2013.
Analysis2 - The total value of sales by territory and individ-ual clients in the period: 01-04-2013 to 30-04-2013.
Reports (R):
The report presents the results of the analysis, grouped ac-cording to the criteria specified by the with the ability to use pivot tables.
Report1
ϑ(Fact1…FactN,{Time,Product},Analisys1,Report)= Time period=01-04-2013…30-04-2013, Value of sales: ProductX=100;ProductY=300,Product=200, The total value of sales: 600EUR;
Report2
ϑ(Fact1…FactN,{Territory,Client},Analysis2,Report)= Time period=01-04-2013…30-04-2013, Value of sales: Dol-nośląskie Voivodeship – Client1=100, Client2=???,
Wielkopolskie Voivodeship – Client3=???; Client4=200, The total value of sales: 300 EUR;
There are two reports showing the value of sales grouped according to the given criteria (specified in the function ar-guments). It can be seen, that although the sales summary should be the same on both reports, however it differ. This may result, for example, of incorrectly entered data or
re-strictions related to the methods of analysis. Therefore, the conflict of knowledge was appeared. It should be clearly pointed out that at the time of the generation of results of analyses as a reports, the user of the system (deci-sion-maker) do not think, why these values differ, because in the turbulently environment decisions must be taken very quickly. It is not a time, for example, to correction by an em-ployee, wrongly entered data (of course, this correction at a later stage should be made, however, this fact may not pause the decision-making process).
So if, as in this example, the structures of knowledge in BI system differ the quantity or the value of the attributes, then the knowledge conflicts appear in this system. These conflicts have been characterized in the later part of the arti-cle.
IV. THE KNOWLEDGECONFLICTS
Conflicts of knowledge in BI systems result from incon-sistency or contradictions in knowledge contained in the sys-tem. Inconsistency occurs when one side of the conflict (for instance, one method of analysis) claims that a given at-tribute (feature) of the world occurs or does not occur in a given period of time, while the other side of the conflict does not have any information or is unable to assess the at-tribute. Contradiction occurs when one side of the conflict claims that a given attribute of the world occurs in a given period of time, while the other side of the conflict claims that the same attribute does not occur, or the values of the same attribute differ [3,5]. Therefore, conflicts of knowledge when the same objects of the world are given different tributes by different sides of the conflict or the same at-tributes (features) are given different values by different sides [11]. Obviously, an assumption is made at this point, that the knowledge is represented in a structure, elaborated in this article.
The [8] defined sources of knowledge conflicts, as fol-lows:
1. The fight for managing specific resources. A conflict appears, when first side of the conflict is considered, that the second side of conflict should not has knowl-edge about a given resource, instead the second side of conflict is considered, that it such knowledge should has.
2. Ideological conflict. It occurs when the parties to the conflict have different beliefs on the subject. These be-liefs may arise, for example, with the kind of environ-ment of system works or with adopted algorithms. 3. Requiring the integration of various elements of the
sys-tem. If there is a need to integrate some elements of the system in one unit, it's naturally a conflict occurs (i.e. different structures of knowledge, different types of knowledge representation).
4. Conflicts resulting from direct knowledge management system. A conflict occurs when each party considers, that it should manage the knowledge accumulated in the system, because it has the current and consistent status of this knowledge.
The last two sources of conflicts of knowledge are most common in BI systems. They are connected with integrating facts, dimensions and analyses into one unit, in order to ob-tain coherent reports; they are also connected with differ-ences in the system’s knowledge represented in structures that differ from one another.
It is worth noting that conflicts of knowledge mainly ap-ply to the difference in amount or value of attributes in structures of knowledge in BI. The situation can be easily il-lustrated with the following example:
One of the users of the system needs a report on the anal-ysis o sales figures of product X in a given period of time, while another user needs a report on the analysis o sales figures of the same product in the same period of time, catego -rized by particular characteristics of the product (e.g. the color). It may occur, that the employed method of analysis does not enable performing analysis with categorization by a given attribute (color). Thus, the first user will obtain a spec-ified amount of sales (for instance, 10,000) while the other user will obtain sales at 0. This generates a conflict of knowledge, because the structures of knowledge differ in number of attributes (for example, the ‘color’ attribute will not occur in the first analysis, but it will occur in the second analysis) and in values of attributes (sales figures will be dif-ferent in each report).
Another example may be the analysis of settlement of ac-counts with contractors. We assume that the user needs a re-port on the analysis of settlement of accounts with cus-tomers, categorized by particular products, based on balance of accounts. Next, the user will require a report on the same analysis, but in this case, categorized by particular cus-tomers. It may occur that total amounts in both analyses will differ, because, for example, some customers have not been assigned a particular product. This also generates a conflict of knowledge.
A separate problem is generating reports on forecasts by BI system. In this case, structures of knowledge may differ in attributes for many reasons. For instance, different meth-ods of analysis (or different parameters) may generate dif-ferent figures of predicted sales in the future, even when based on the same range of data. Additionally, even using the same method of analysis, but with detailed categoriza-tion by different dimensions, may generate varied values of attributes in each report (for example, if an analysis is per-formed on the forecasted sales referring to the future, cate-gorized by particular customers and then another analysis is performed in the forecasted sales in the same period of time, but categorized by particular products, then each report may contain a different total amount of forecasted sales).
One must remember that one cannot ignore conflicts of knowledge that occur in BI systems nor uproot them. The conflicts must be located and resolved. Only then the system can perform analyses properly and present reports to the user, and only then can the system do its job.
Knowledge conflict resolving can be carried out using various methods, such as:
a) negotiation methods;
- game theory, - classical mechanics, - operational studies,
- behavioral and social sciences, - choice,
- consensus.
The negotiation methods guarantee the desired compro-mise, however, this is realized at the expense of increased communication between the nodes of the system, which of course adversely affect its performance. While the methods of deductive-computing group do not affect to a great extent on the speed of operation of the system, they, except the consensus methods, does not guarantee the achievement of a good compromise. Decision-maker, instead, requires a good system performance (often working near the real time) and efficient knowledge conflicts resolving, so the system will effectively support the decision making process.
In order to resolve the knowledge conflicts in BI system, most appropriate methods will be used for the choice or con-sensus methods, as opposed to other methods, they do not require interference in the internal system statuses (for example you do not need to interfere with the existing pro -gramming code). Choice methods rely on the election (on the basis of certain criteria) one of the conflicting knowl-edge states (represented in the form of the structure pre-sented in this article), which is prepre-sented to user. The rest of the states of knowledge are not taken into account in this case, therefore, a high level of risk associated with the choice of the incorrect state of the knowledge. Consensus methods, instead, rely on determining such state of edge, that will represent all of conflicting states of knowl-edge, generated earlier by system. In other words all parties to the conflict will be taken into consideration. This will consequently reduce the level of risk related to choice incor-rect state of knowledge. Choice or consensus methods can be implemented as a separate modules of system.
The work on the development of conflict resolving mod-ule, with the use of consensus methods, are in progress. The consensus is elaborated in three major stages. In the first stage it is necessary to carefully examine the structure of knowledge. In the second stage it is necessary to define the distance functions among particular structures. The third stage is an elaboration of consensus algorithms that generate a structure, that the distance between this structure (consen-sus), and the individual structures is minimal (according dif-ferent criterions).
Algorithms for detecting and resolving the conflicts should be implemented in the system and running, when the structures of knowledge differ. Of course, these algorithms running automatically, without human interaction. Detecting and resolving knowledge conflicts in BI systems allow to certainty of system functioning, in other words, reports gen-erated by system as result of analysis is consistent from the point of view of the criteria defined by the user. Only in this case decision-makers can take full advantage of the system.
V. CONCLUSION
Conflicts of knowledge occur in virtually every BI sys-tem. The system designers should remember that methods for detecting and resolving conflicts should be considered at the first stage of system development. Implementing them after the system has been commissioned may be very diffi-cult due to the need to input additional software code. Proper detection and resolving conflicts is extremely impor-tant especially in BI systems, because their operation greatly influences the decisions made by decision makers and, con-sequently, the operation of the entire organization. Resolv-ing the conflicts is also very important, because only then the system can suggest proper decisions. If the system ig-nores these aspects, then the user (decision maker) is likely to have problems making a quick and correct decision, be-cause the system may suggest an improper decision, or may suggest several different decisions, forcing the decision maker to spend time selecting one of them, which makes the whole process very time-consuming and impossible to per-form in approximately real time.
REFERENCES
[1] Alsquour M., Matouk K., Owoc M. L. “A survey of data warehouse architectures - preliminary results”, Proceedings of the Federated Conference on Computer Science and Information Systems (FedCSIS), 2012.
[2] Bytniewski A. (red), Architektura zintegrowanego systemu informatycznego zarządzania, Wydawnictwo AE we Wrocławiu, Wrocław 2005.
[3] Hernes M., Nguyen N.T., “Deriving Consensus for Hierarchical Incomplete Ordered Partitions and Coverings” Journal of Universal Computer Science 13(2), 317-328, 2007.
[4] Hsu K.C., Li M., Techniques for finding similarity knowledge in OLAP reports, Expert Systems with Applications 38 (2011) pp. 3743–3756.
[5] Katarzyniak R., Nguyen N. T., Model systemu wieloagentowego z procedurami grupowej aktualizacji wiedzy opartymi na metodach teorii konsensusu, Raport z serii SPR nr 3, ISiTS PWr, Wrocław 2000. [6] Matouk K., Bytniewski A., Systemy Business Intelligence w
zarządzaniu, Prace Naukowe nr 1027, Wyd. AE, Wrocław 2004 [7] Nguyen N.T. , Metody wyboru consensusu i ich zastosowanie w
rozwiązywaniu konfliktów w systemach rozproszonych, Oficyna Wydawnicza Politechniki Wrocławskiej, 2002.
[8] Nycz M., “Business Intelligence as the exemplary modern technology influencing on the development of the enterprise, in: Kubiak B.F., Korowicki A. (ed.), Information Management, Gdansk University Press, Gdańsk 2009r., pp.312-320.
[9] Pankowski T., Dane wielowymiarowe i język MDX w systemach OLAP, VI Konferencja PLOUG, Zakopane 2000.
[10] Simon R.A., Shaffer L.S., Hurtownie danych i systemy informacji gospodarczej. Oficyna Ekonomiczna. Kraków 2002.
[11] Sobieska-Karpińska J., Hernes M., “Consensus determining algorithm in multiagent decision support system with taking into consideration improving agent’s knowledge”, Proceedings of the Federated Conference on Computer Science and Information Systems (FedCSIS), 2012.
[12] Todman Ch., Projektowanie hurtowni danych. Zarządzanie kontaktami z klientami (CRM), Wydawnictwa Naukowo-Techniczne, Warszawa 2003.
[13] Wyrębek H., “Znaczenie aplikacji Business Intelligence w zarządzaniu przedsiębiorstwem”. in: Administracja i Zarządzanie, Zeszyty Naukowe Uniwersytetu Przyrodniczo-Humanistycznego w siedlcach, nr. 88, Siedlec 2011