Data mining log file streams
for the detection of anomalies
Brian Green
A thesis submitted to Auckland University of Technology in fulfilment of the requirements for the degree
of
Master of Computer and Information Sciences
4 September 2015
Page | ii
Contents
Chapter 1 - Introduction ... 1
1.1 The Problem ... 2
1.2 Motivation for the Study ... 3
1.3 Research Contributions ... 5
1.4 Research Questions ... 6
1.5 Research Scope ... 7
1.6 Organisation of the Thesis ... 7
Chapter 2 - Literature Review ... 9
Chapter 3 - Research Methodology ... 16
3.1 Methodological Alternatives ... 16
3.2 Method ... 18
3.2.1 Business and Data Understanding ... 19
3.2.2 Data Preparation and Modelling ... 19
3.2.3 Evaluation ... 19
3.2.4 Summary ... 20
3.3 Chapter Summary ... 20
Chapter 4 - Experimental Study ... 21
4.1 Iteration One ... 21
4.1.1 Business and Data Understanding ... 21
4.1.2 Data Preparation and Modelling ... 22
4.1.3 Evaluation ... 27
4.1.4 Summary ... 31
4.2 Iteration Two ... 34
4.2.1 Business and Data Understanding ... 34
4.2.2 Data Preparation and Modelling ... 34
4.2.3 Evaluation ... 36
4.2.4 Summary ... 41
4.3 Iteration Three ... 44
4.3.1 Business and Data Understanding ... 44
4.3.2 Data Preparation and Modelling ... 44
4.3.3 Evaluation ... 49
4.3.4 Summary ... 55
4.4 Iteration Four ... 57
4.4.1 Business and Data Understanding ... 57
Page | iii
4.4.3 Evaluation ... 59
4.4.4 Summary ... 63
4.5 Data Mining Summary ... 65
4.6 Proposed Framework ... 71
Chapter 5 - Conclusion ... 73
Chapter 6 - Directions for Future Research ... 74
Chapter 7 - References ... 75
Chapter 8 - Appendices ... 79
Appendix A – Data sets used in Iteration three ... 79
Page | iv
Attestation of Authorship
“I hereby declare that this submission is my own work and that, to the best of my knowledge and belief, it contains no material previously published or written by another person (except where explicitly defined in the acknowledgements), no material which to a substantial extent has been submitted for the award of any other degree or diploma of a university or other institution of higher learning.”
Page | v
Acknowledgements
I would like to thank my supervisor Dr. Russel Pears for guiding me on this journey, David Swazbrook and Aaron Cheeseman for their experience and insights in both managing log files and guiding my programing efforts. Roy Cullum for allowing me the time and space to progress this work to completion and finally my biggest supporter who kept me on task when required and for having a keen mind and critical set of eyes when reviewing this thesis, Maryann Green.
This work is dedicated to the memory of Jean Green my mother who passed away half way through this journey of higher education.
Page | vi
List of Abbreviations
CRISP-DM – Cross Industry Standard Process for Data Mining
DB – Database
DHCP – Dynamic Host Configuration Protocol
EM – Earth Mover’s
EMD – Earth Mover’s Distance
EPS – Events Per Second
HMAT –“Histogram Matrix” (Frei & Rennhard, 2008)
KDD – Knowledge Discovery in Databases
NTP – Network Time Protocol
R – R: A Language and Environment for Statistical Computing
Page | vii
List of Figures
Figure 3-1 CRISP-DM process model (Sharma et al., 2012) ... 18
Figure 4-1 Events per Minute ... 27
Figure 4-2 Predictor attribute box plot ... 29
Figure 4-3 Tokens Density Plot... 30
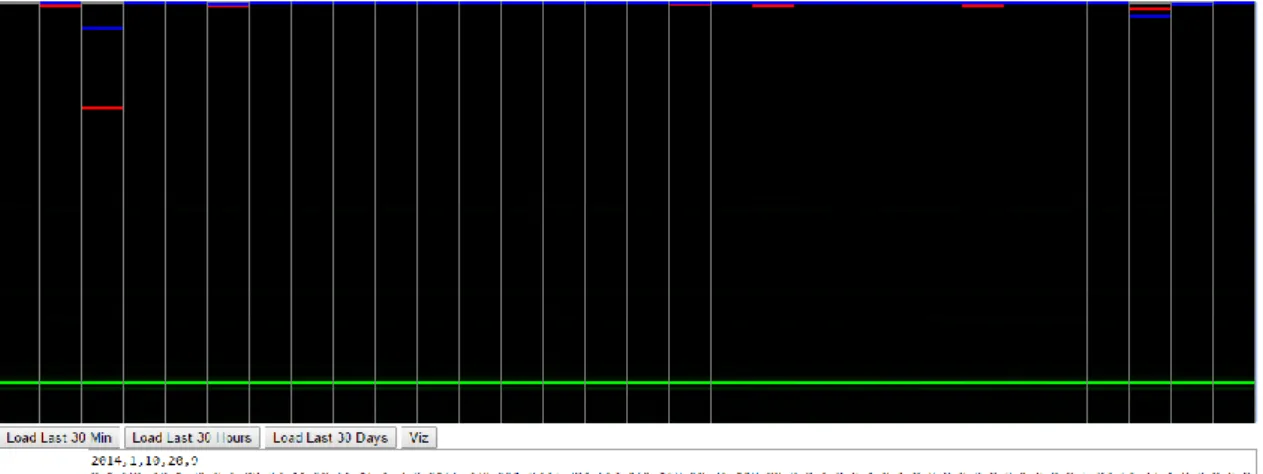
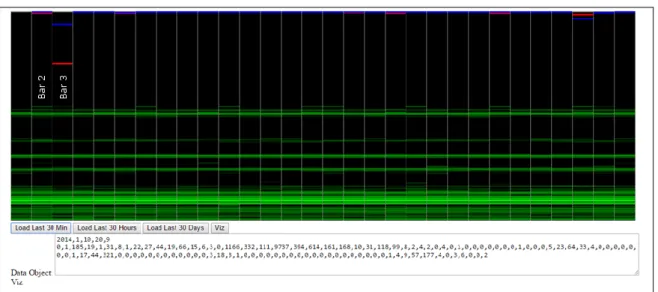
Figure 4-4 Sample Visualization ... 37
Figure 4-5 Sample Visualization (Log) ... 38
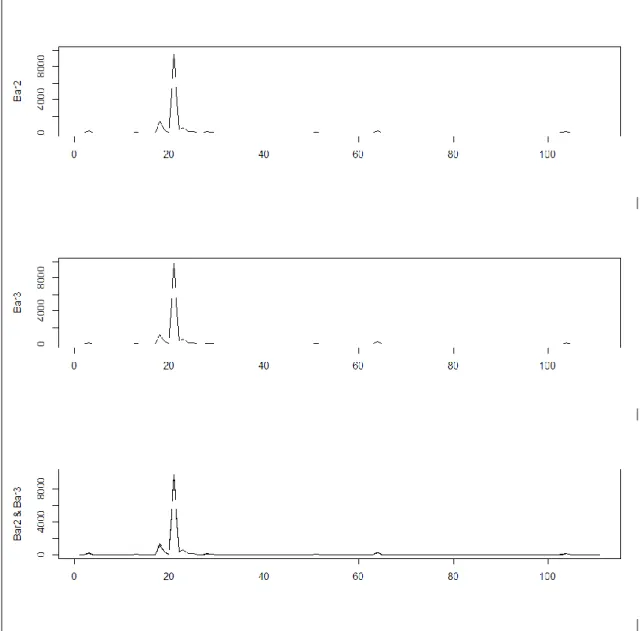
Figure 4-6 Visual Comparison ... 39
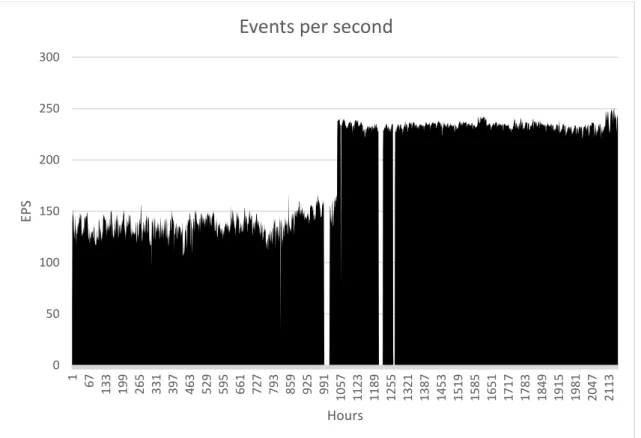
Figure 4-7 Events per second ... 40
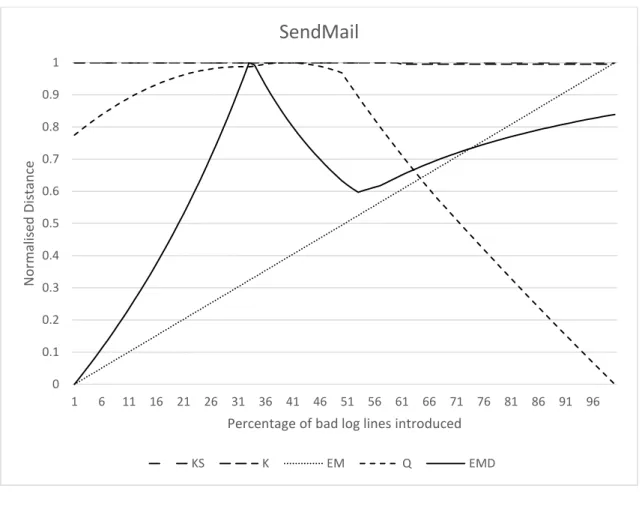
Figure 4-8 SendMail ... 50
Figure 4-9 SendMail (Log) ... 50
Figure 4-10 SSH ... 51
Figure 4-11 SSH (Log) ... 51
Figure 4-12 DHCP ... 52
Figure 4-13 DHCP (Log) ... 52
Figure 4-14 EM Distance at 100% bad log data ... 54
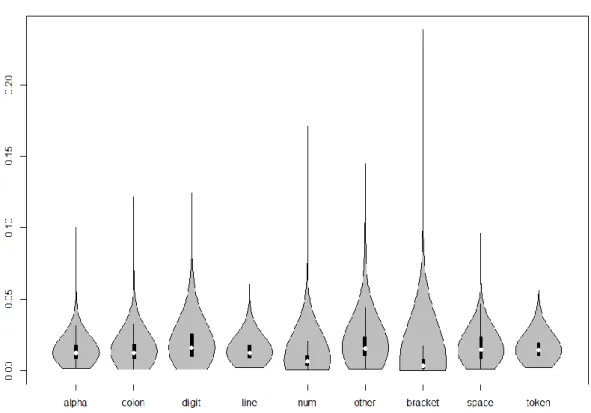
Figure 4-15 EM (Weighted) Violin Plot ... 59
Figure 4-16 EM Log10 (Weighted) Violin Plot ... 60
Figure 4-17 EM Feature Log Density Comparison... 61
Figure 4-18 EM Density / 99% percentile ... 62
Figure 4-19 EM EM Density / 99.9% percentile ... 63
Page | viii
List of Tables
Table 4-1 Token Types ... 24 Table 4-2 Token Log Sample Token Counts ... 26
Page | ix
Abstract
Log files play an important part in the day to day running of many systems and services, allowing administrators and other users to gain insights into operational, performance or even security issues but it is now impractical with the volume of files today to manually examine them.
Existing tools in this space largely work by detecting anomalies from log files that have already been stored or by comparing them against known errors (signatures). By data mining log file streams for the detection of anomalies instead, it will allow
administrators to reduce the time required to detect anomalies significantly with no signatures or complex settings needing to be maintained.
This paper presents the experimental work undertaken to define a generic, practical and scalable method for anomaly detection in streaming log files by detecting the change to the mix of log events occurring. This was achieved by following a modified CRISP-DM (Cross Industry Standard Process for Data Mining) methodology enabling a broader more flexible approach to the data mining process.
By taking this approach, a solution was developed that employs common log file features together with a weighted earth mover distance metric. This enabled a framework to be developed that can be broadly applied to many log file types. By setting a simple percentile threshold indicating an acceptable level of change, anomaly detection in streaming log files can be achieved.
Page | 1
Chapter 1 - Introduction
Log files are used across many IT operational areas today to investigate security or operational issues that may have occurred to gain further knowledge about these events. These log files typically are examined after something has been detected and further knowledge needs to be gained about what has occurred.
Timely knowledge on when something has changed in the operation of a system can minimise service interruption or security risk to an organisation. By examining these log files, critical insights can be gained, but this requires knowledge on when and where such an examination should take place.
There are many challenges when working with log files across a number of problem areas, ranging from the distribution of events, the volume of data, the wide range of log files formats, and various transport or storage methods. In addition to these challenges given the large volume of log file information it is usually infeasible to manually examine all the log files in order to analysis them for anomalies.
The problem of log file analysis is of direct interest to the author, as his team has to deal with log file analysis as part of their daily operational tasks, this includes responding to security, operational and system performance issues.
Through the work presented in this thesis in data mining log file streams for the detection of anomalies, a more generic approach to anomaly detection (change detection) is envisaged, not looking for one off events which are much more easily detected by signature or other change detection methodologies, but more when the
“mix” of predictor attributes has changed enough from a baseline of log activity. To achieve this, new predictor attributes and change detection methodologies will be investigated. This will allow the administrator of a system or service to narrow down the time and location of a change in the mix of log file events in order to discover the changes / anomalies that have taken place in a system or service, thus allowing for an appropriate and timely response.
This thesis presents a generalised and highly scalable approach for anomaly detection which could be easily adapted as a future piece of work into a full scale production system for the detection and visualisation of changes and anomalies in log files. This is
Page | 2
in contrast to a typical streaming pattern matching technique which looks for a single event, or a pre-determined count limit on a number of single events being monitored. The problems and challenges that exist when trying to examine log files will be
examined in the next section.
1.1
The Problem
It can be considered that each system and service has its own pattern of activity. For example, when an email is passed through a mail relay or other IT service normally it will generate a largely matching set of related log events or multiple lines for each event. When a system error or anomaly occurs, typically a different set of log events may be recorded (Fu, Lou, Wang, & Li, 2009) . While the volume of such activity for each system and service will vary across each day, the mix of system and service log file message types should largely remain the same.
Additionally, in a normal business operational environment there is an added pattern to the activity across the day as people arrive and login; they access files, systems and services, and then logout. This normal user activity typically also introduces another mix to the log messages as well as a change in the rate that events are recorded. In a large environment the sheer volume of log files and events presents issues; many gigabytes of logs could be generated each day from one system alone, and thus manually reviewing log files is not only an inefficient method of review, it is also impractical. There is a desire to find a solution to this problem and one way is by focusing attention on detected anomalies only.
They are many different methodologies for anomaly detection in log files (Chandola, Banerjee, & Kumar, 2009); two popular techniques that have been used in many log file systems are clustering and pattern matching (signature based). Clustering is typically used to make spotting outliers much easier so they can be examined further to see if they are an anomaly but it can be computationally expensive. This is in contrast to pattern matching where a known error condition or security event is typically specified via regular expression matching and then alerted or reported to the administrator of the system or a security team. The problem with signature type
Page | 3
approaches is that the signatures must constantly be updated and that they are only really able to detect known anomalies.
The scale of today’s ever increasing IT environments can also present challenges. Each service can generate its own log files and there may be more than one service running on a system or instance which in turn is generating log files as well. This can lead to scale issues due to the sheer volume of log messages generated, thus increasing the difficulty of extracting the required knowledge. This scale issue has been examined by many researchers and it is not uncommon to see statements such as “log files are usually too large and complex to analyse manually” (Taerat, Brandt, Gentile, Wong, & Leangsuksun, 2011, p. 285) and “data by NIDS (Network Intrusions Detection Systems) systems could be overwhelming and it is not an easy task for network administrators to go through the collected logs” (Mohammadjafar Esmaeili & Arwa Almadan, 2011). One further complication is the problem is that log files are usually textual in nature and differ in context, structure, transport and storage methods between all the various systems and service (Taerat et al., 2011) . All these issues compound to add to further challenges when analysing log files.
More recently with the increasing use of cloud technologies (virtual servers and services) the possibility of having systems and services running across a variety of hosting providers and geographic locations will yet again result in another level of complexity to be added to this already challenging area. Some of these challenges and approaches to log file analysis will be examined further through a literature review presented later.
1.2
Motivation for the Study
For more than 20 years the author has been involved in IT system support, and more recently in operation and security management. Over the author’s many years in IT, he has examined many log files in order to get to the root cause of an issue or to
understand why something has changed. This gives the author not only a generalised domain understanding of this problem area, but also the motivation to search for a more generalised solution.
Page | 4
The inspiration for this work came when the author was reviewing literature for
another paper. At that time the author came across two pieces of research in this field,
“Histogram Matrix: Log File Visualization for Anomaly Detection” by Frei & Rennhard, 2008 and “Baler: deterministic, lossless log message clustering tool” by Taerat et al., 2011 and it is from these two papers that a possible solution to one area in this problem was formed.
Many tools and techniques have been used or developed by the author over the years in order to help assist in log file analysis, but they tend to be focused on a single need or a small set of requirements. The large majority of them have used some sort of signature type/pattern matching engine in order to do the required analysis. More recently, full text searching has become much easier across many log file sources via tools like Splunk (“Splunk | IT Search for Log Management, Operations, Security and Compliance,” 2010) and Elasticsearch (“Elastic · Revealing Insights from Data (Formerly Elasticsearch),” n.d.). But knowing when and where to go looking and detecting
changes remains a problem.
This is the problem that gave the author the motivation to try and search for a solution in this area and present, via the work in this thesis, a generic approach to this problem. The solution needed to be one that was not reliant on generating signatures for
specific events, it needed to have the ability to scale to huge size and also provide flexibility in how the data can be examined and visualised when required.
In the author’s employed role his team has to deal with log file analysis issues as part of daily operational tasks which include responding to security, operational and system performance issues. Given the author’s responsibilities, data for this research was readily available, and permission from the organisation was sought and granted for this use.
Through the operational and security community’s work together on solutions in this space, it is hoped that the work and ideas presented in this thesis can be shared back to these communities so it could be developed on in the future. Any code artefact created will be put on a public code repository so other people may benefit from this aspect of this work as well. Many open source tools were used in generating these
Page | 5
experimental results and it is but a small way of showing the author’s appreciation of all the work others have done that have made this research possible.
1.3
Research Contributions
This thesis offers a generic approach based on common log file features that could be widely applied across many types of log files or other streaming text type problem spaces. Through exploring different ways to detect changes in streaming log files, this thesis contributes to knowledge by offering a new method of detecting anomalies in log files along with offering new insights into detecting change in unstructured log files.
The research reported is significant, because from a security view point on log file systems, knowing when things have changed from a baseline may allow the early detection of a compromised system or service. This work offers a generalised approach to achieving this with very little setup cost. Once an anomaly is detected immediate security incident response measures can be put in place.
Then, through further examination of the log files identified by the methods outlined in this thesis, a compromised system or service and the reasons thereof may be able to be determined. Once the method of compromise has been determined, additional appropriate mitigation actions can be taken in a timely manner, and development of new controls may also be able to be established.
From an operational view point, the healthy performance of a system or a service is essential to many areas today. Given the very general nature of this approach, detecting when something has changed that is not already picked up by another monitoring system would offer many advantages in system monitoring areas as well. Once detected, checks could also be introduced via other methods such as signature type approaches even quicker. This effectively offers a safety net via its general approach, so while the proposed method is unable to pick up single event types, any time when something causes a large enough change in the mix of log event types to be alerted, an administrator can be used to investigate further if required through other methods and tools.
Page | 6
In order to achieve the goals outlined above specific research questions have been developed to guide the outcomes of this work.
1.4
Research Questions
To structure this data mining experiment a set of research questions were developed in order to guide each iteration of the data mining process as well as the overall approach to the experiment. It was also intended that the realisation of this work into a practical solution should also guide the outcomes of this thesis. With these goals in mind the following research questions were proposed.
Question One:
What log file attributes will give efficient and accurate anomaly predictors from log files?
Question Two:
Which model or set of models will give the best performance for the detection of anomalies in log files based on these anomaly predictors?
Question Three:
Which is the best method to evaluate the model/s generated for the detection of anomalies in log files?
Question Four:
What constraints are required to ensure that the work can be developed in the future to form the basis of a practical and scalable solution for the detection and visualisation of anomalies in log files?
Question one focuses on how to find which attributes will give accurate anomaly predictors from log files; existing work will be examined in order to build a set of attributes that can be evaluated and tested.
Page | 7
Question two gives focus on how to compare the generated features; various methods will be examined in order to establish which ones work best for this problem area. Performance is to be compared both on effectiveness of anomaly detection and bounded by computational cost if it is overly detrimental to the end goal.
Question three directs the research into how to establish thresholds of difference. How to determine when something is “too” different. These should be easily understandable by the end user in order for them to be interpreted and set appropriately given the nature of each log file, or combination of log files.
Question four sets boundaries or constraints on the tools used and created in order to give others the ability to develop this work further. Question four effectively sets the scope of this research and will be examined further below.
1.5
Research Scope
As noted in research question four above, this work is only intended to build the knowledge and develop design ideas and constraints so that in the future a system for the detection of streaming log file anomalies and visualisation of results can be built. In order for it to be “pragmatic” it should be able to be constructed from readily available applications that can be configured or easily modified to suit the outcomes of this research around generalised anomaly detection and visualisation.
It has to be able to support the anomaly detection methodologies that are
“performant” as defined in question two. In addition to the above the entire solution should be scalable so that it could be used from small scale systems all the way to extremely large “Big Data” type environments.
Finally, it should offer a means of alerting and visualisation of the detected anomalies by the thresholds as developed in research question three.
1.6
Organisation of the Thesis
This thesis is organised in the following chapters. A general review of literature is performed in Chapter two which expands on the key papers which inspired pursuing this research topic and further explores the issues and problem areas through the examination of complementary research, articles and appropriate standards.
Page | 8
The research method used is presented in chapter three in order to ground the methodology used in the experimental data mining sections.
Chapter four has the data mining iterations and the experimental results for each iteration that were discovered based on the research method framework. Each
iteration has a “Business and Data Understanding” focus in order to describe the goals of the iteration and current data understanding. Also included is “Data Preparation and Modelling” which covers the data, tools and methods used. An evaluation is presented via an experimental study and a summary relating it back to research questions. A final summary concludes the data mining process, and brings together all the results obtained by reviewing the outcomes against the four research questions. A proposed framework is presented at the end of Chapter four. This includes two
practical implementations that could be developed to create a working solution using readily available applications and current research.
Chapter five concludes the research, and Chapter six discusses future work, taking into account the outcomes discovered, and ideas which could be developed further.
Page | 9
Chapter 2 - Literature Review
As described in the motivation for this thesis, two main research articles formed the inspiration for the ideas that will be developed to achieve data mining of log file streams for the detection of anomalies. The methodology employed for this literature review is largely inwards focused. The two papers that inspired this thesis will be examined first to show how they inspired and contributed to the overall outcomes of this experiment. Then the ideas and issues raised in these two papers will be explored through the literature thus building the knowledge required in order to create a pragmatic solution for anomaly detection in log files.
The first paper that will be reviewed is “Histogram Matrix: Log File Visualization for Anomaly Detection” (HMAT) by (Frei & Rennhard, 2008) in this paper they present an approach for detecting and visualising anomalies in log files. From a single predictor attribute (word count) they produce a histogram for each log line every hour. From this they applied a bespoke statistical measure as their anomaly detection method based on the standard deviation of each individual bin’s values compared to the same bins over the current day or same slot on a previous week as a comparison / baseline option. Their project also supported a visualisation of the results as represented by a matrix on the screen which could be clicked on to drill down to examine the log lines at the matching time. This approach of limiting the logs to the matching time only
facilitated the use of other tools such as clustering etc. which might not have coped with processing the full log file.
By taking this approach they made use of the idea that many systems and services have a pattern to their activity which is shown as a sequence of log file events that take place. This mix of log messages will remain the same regardless of the volume of transactions that occur and thus by normalising the volume of the histogram they can compare the mix (Individual bin values over time) in order to detect anomalies. Areas for improvement to this approach were identified by Frei & Rennhard, 2008 in future work. One issue identified was the limitation of using only one predictor
attribute and thus log files whose word count does not vary by very much might not be practical for usage on anomaly detection. They also raised a desire to include
Page | 10
that they would like a way to define rules to remove “noisy” or harmless messages. This desire to remove “noisy” or harmless messages may indicate an oversensitivity in some log file cases caused by the focus on individual bin changes that they have taken. Inspired by this research, the author began to form a possible solution to investigate ways to move to a streaming approach to speed up detection by utilising the whole histogram instead of just each single bin in order to reduce the implied oversensitivity to single bin changes. This in turn should remove the need for maintaining rule sets to reduce noise.
The author also recognised the need to address the ‘single predictor attribute’
limitation identified by Frei & Rennhard, 2008 and in this experiment a greater range of predictor attributes will need to be discovered and implemented in order to widen applicability of the solution to a wider range of log file types.
The second paper which helped form the overall approach was “Baler: deterministic, lossless log message clustering tool” by Taerat et al., 2011. In this work they tackle the issues of clustering of extremely large log files, and compared the performance of their solution against other common methods and programs used for this purpose. Many of the clustering tools use a multi pass approach for processing data into clusters. Baler achieves the same equivalent outcome by tokenising and clustering the data based on the token attributes in a single pass.
By utilising a single pass approach to generating the token attributes and clustering, it removes the usual memory usage issues that frequently occur in clustering solutions of this type when dealing with very large log files. As part of the initial clustering
algorithm, they split the log file line into various token types “Alpha-Numeric”,
“Numbers”, “Spaces” etc. For the “Alpha-Numeric” matches they further tokenised it based on if it is an English word from a pre-loaded list of words, a number or if not matched, then returning an outcome of an alpha numeric token. In examining the clusters generated, they found that they could further consolidate some of the clusters without over clustering the data as a whole by measuring the difference between the clusters based on a string difference algorithm, Perl’s Algorithm::Diff (McQueen, n.d.), and setting a threshold on which to cluster the patterns further.
Page | 11
From this research, additional predictor attributes can be identified and tested based on their successful use in this work as a method for clustering. By combining this work and the ideas developed from HMAT by Frei & Rennhard, 2008, a new approach to anomaly detection in log files could be developed.
The demand to cluster ever larger log files drove the development of Baler by Taerat et al., 2011 and in general the ability to deal with the ever increasing size and volume of log files etc. is driving efforts in many other research areas.
One of these research areas is in dealing with how to transport, store and process these log files efficiently and effectively. One approach in handling this large scale logging problem is “Chukwa: A system for reliable large-scale log collection” by Rabkin & Katz, 2010. In their work they present a method which supports both reliable and fast methods for transport and storage of log files. The system was also designed so that it could support a number of log file collection methods via local agents using syslog or local file access etc. These local agents then sent their logs to a separate collector agent which then split them to a “fast path” processer for immediate (but not reliable) processing and also wrote them (reliably) to Hadoop HDFS file system every five minutes. By doing this it allowed a MapReduce type operation to be able to carried out over the stored datasets while supporting the immediate needs of some systems and services.
This work can be compared to “Logjam: A scalable unified log file archiver” by Cardo, 2011. Logjam was designed for the collection of log files across a cluster of servers. It works by generating an archive of the log and transferring it to long term storage using a naming standard for easy identification. It is intended to not run all the time, but batch process the log file archive operations on a daily, weekly or monthly basis. Where Chukwa was designed to process (in seconds) and store (every five minutes) the log files as soon as possible, Logjam was designed to automate the archiving and storage of the log files on a much longer time scale (days, or weeks).
The volume of log files is also described in information about real world operational log data rates sourced from the SANS Institute, a well-known security information vendor. The SANS Institute regularly produces whitepapers, and while they are not all peer-reviewed papers, they can offer valuable insight into various real life log file event
Page | 12
rates. In one paper they divide the event rates into EPS Steady state, Peak EPS, and Average Peak EPS. They rate the log file event rates this way because while there is an average event rate that must be handled, sustained peaks and peak event rates must also be processed timely and efficiently (Butler, 2009). The balance between timely log file processing and reliable log file process and storage is an ongoing challenge.
To further complicate the situation log files come in many formats and to date there has been no one accepted standard for them. In fact major government sponsored efforts towards creating such a standard such as CEE the (“Common Event Expression: CEE, A Standard Log Language for Event Interoperability in Electronic Systems,” 2014) have even been put on hold recently.
Other approaches have been to build systems which attempt to normalise the log files by parsing them using custom matching patterns for each log file type as employed by commercial log file analysis tools such as “sawmill.net - Sawmill - Universal log file analysis and reporting,” 2012 and “HP ArcSight Connectors - HP Enterprise Security,” 2012. By normalising the logs it does allow for other data mining approaches to be used but limits the solution to log files that have had a custom parser added for them and thus any new formats would have to have a parser added which increases the support and maintenance burden of the solution. In addition to this there is no common format for the normalisation of the log files either. With efforts such as CEE being terminated and handed off to third parties to continue if possible, it appears that there will not be much progress in this area in the near future.
Possibly the most widely supported logging standard is syslog which originates from the widely used Sendmail application. Given its wide de facto use for logging it was formalised as a standard in RFC5425 (Gerhards, 2009). The standard largely focuses on the transport method of the log file but does also define a basic structure to each log event including, source, priority, hostname, process, timestamp and a free form message.
Although message content is free form, usually there is an underlying structure to the log file events. This underlying structure or mix of log file message features arises from the way log file messages are produced within the applications. In most cases these log
Page | 13
events are created by structured print statements e.g. “sprintf(message, “Connection from %s port %d”, ipaddress,portnumber)” (R. Vaarandi, 2003).
By leveraging this underlying structure to log messages, researchers have found that they can create models for clustering and other data mining techniques in order to extract further knowledge from log files and look for outliers and/or anomalies. Early work in this area is exemplified by SLCT (Simple Logfile Clustering Tool) by R. Vaarandi, 2003 and improved in LogHound (Risto Vaarandi, 2004) in which he clustered log files based on these underlying properties.
As the size of log files has grown, clustering logs based on the underlying structure has become increasing difficult and tools like SLCT and LogHound are no longer practical to use. More recent research has worked towards extending the scale of log file
clustering tools by developing new methods such as partitioning the log file clusters before producing the full cluster summary (Makanju, Zincir-Heywood, & Milios, 2012). The issue of dealing with the huge size of some log files is also the area that “Baler”
(Taerat et al., 2011) addressed (as noted previously).
Log files also have another property that could be exploited for means of change and/or anomaly detection as described by Fu et al., 2009 where they implemented a finite state automaton model trained from the log files. This method works as many systems or services exhibit a flow of programmed or scripted events based on a schedule giving a defined mix and temporal pattern to them. All these log file
properties introduce areas that could be utilised for change and/or anomaly detection. There are a number of approaches that could be used for anomaly detection, one possible related approach is described in “Anomaly detection: A survey” by (Chandola et al., 2009) where they broadly grouped anomaly detection into three types, point, contextual and collective. The problem at hand aligns with the collective approach in which they describe an anomaly as being when a collection of related data instances is anomalous in respect to the entire data set. This aligns with the desire to use a change in the mix of the log messages in order to detect change and/or anomalies.
In “A Review of Anomaly based Intrusion Detection Systems” by V Jyothsna, V V Rama Prasad, & K Munivara Prasad, 2011 they also divided the field of anomaly detection, but this time into two groups, signature based and anomaly based. They then further
Page | 14
defined each approach and methods that could be appropriate for use in each. In this work the problem aligns largely with the anomaly detection and it is anticipated that one or more of these methods of anomaly detection could be employed based on how the data mining experiment progresses and work such as this will be informative when deciding the approach to take. Methods they mention which could be of use are statistical based, operational or threshold metric model, statistical moments or mean and standard deviation model, univariate model, multivariate model, time series model, outlier detection model, or user intention based.
When examining the area of data stream mining and anomaly detection
Mohammadjafar Esmaeili & Arwa Almadan, 2011 in their work “Stream Data Mining and Anomaly Detection” they used a sliding window approach in combination with a signature based approach in order to detect anomalies by comparing previously
clustered data. As discussed previously, a signature type approach is not desired in this work. Signatures need to be updated regularly, are typically difficult to create and maintain, and are very dependent on individual log file types, this is counter to the generalised approach desired in this work. Mohammadjafar Esmaeili & Arwa
Almadan's, 2011 implementation of a sliding window may offer alternative methods for change and/or anomaly detection and thus may be useful to consider as part of the overall solution.
Looking further at mining streams of data, in Kholghi, Hassanzadeh, & Keyvanpour, 2010 “Classification and evaluation of data mining techniques for data stream requirements” they classified various approaches for data stream mining. They first grouped each solution based on whether the data required pre-processing or not, and then they grouped each one further based on if it employed clustering, classification, or frequency/time series analysis. Further to this they also classified each solution based on whether it stored the data or not. In this data mining experiment the author does not intend to cluster the data. However, time series analysis, data pre-processing (or not) and data storage are aspects which will be considered in the overall solution By not clustering the data it is hoped to avoid common scalability limits highlighted by Taerat et al., 2011 such as memory usage and computation time. In addition to this it is hoped that not clustering the data will also reduce any assumptions around the
Page | 15
Baler and highlighted in other approaches identified in the literature review in Chapter 2. Not clustering the data should allow for the broad applicability of this streaming log file based anomaly detection system by minimizing the number of assumptions on the structure of the data..
The data mining experiment will take into account these broad classifications for change and/or anomaly detection and as the data mining process progresses these classifications will help inform decision making and possible approaches.
A more recent approach to processing large data sets was achieved by using MapReduce type operations. Liu, Pan, Cao, & Qiao, 2010 in their work “System Anomaly Detection in Distributed Systems through MapReduce-Based Log Analysis”
used MapReduce as the last stage of their anomaly detection system in order to analyse the log file clusters that have been created. By using a MapReduce
methodology they greatly improve the overall efficiency of their solution. As part of their work they also produced a visualisation of their results. Using elements of their successful processing and visualisation of large data sets, this experiment will aim to offer a scalable solution.
Finally visualisation of data is another technique that can be used to leverage the knowledge gained via data mining methods on large data sets in order to help guide the user or let them discover new knowledge or information. In fact visualisation is a common technique employed as a way to deal with very large data sets. Ben
Shneiderman a seminal author in the field of visualisation presented a visualization mantra in which he states “Overview First, Zoom and Filter,
Details-on-Demand“(Shneiderman, 1996). This “mantra” will guide the final outcome of this experiment, as it will help define the requirements for the production of a practical visualisation solution for this work allowing the user to navigate to the detected change and/or anomaly as required.
Page | 16
Chapter 3 - Research Methodology
3.1 Methodological Alternatives
There are a variety of methodologies that could be used for this data mining
experiment, and several different methodologies were examined in order to find one that best suited the desired outcomes of this project. One structured approach to data mining was presented in KDD (Knowledge Discovery in Databases) by Fayyad,
Piatetsky-shapiro, & Smyth, 1996. Within this work they described a nine step process, presenting a more detailed process oriented description to the overall activity of knowledge discovery from data.
In more recent efforts to further standardising the approach to data mining, one of the most popular approaches is CRISP-DM (Cross Industry Standard Process for Data Mining). The CRISP-DM standardisation effort was led by five companies from a variety of industries. Standardising the variety of data mining processes was the main driver for this piece of work so that it was “independent of both industry sector and
technology used” and that data mining processes are “less costly, more reliable, more repeatable, more manageable and faster” (Wirth & Hipp, 2000)
In “AsurveyofKnowledgeDiscoveryandDataMiningprocessmodels” (Kurgan & Musilek, 2006) they noted that CRISP-DM has been used across a number of projects within research and industry. In addition to this, an online survey in 2007 on the KDnuggets website, an online community for data miners run by Gregory Piatetsky-Shapiro, a leading expert in the field of data mining, and also one of the co-authors of the original KDD paper above, found that CRISP-DM is still the top methodology used for data mining projects. This was further reinforced while this experiment was being undertaken when the same survey was run again in 2014 and the results showed it is still one of the most popular methodologies (Piatetsky, 2014).
There have been several efforts to improve the CRISP-DM methodology, as highlighted by Sharma & Osei-Bryson, 2010 in which they examined a number of data mining methodologies and identified several areas of potential improvement. One area of improvement identified could be achieved by integrating all the various models together to address any weaknesses in any individual one. From this work they
Page | 17
developed a new data mining process model “Integrated Knowledge Discovery and Data Mining” (IKDDM).
Sharma & Osei-Bryson, 2010, p. 11347 also described the original KDDM process as only a checklist type approach, this is in comparison with their work in IKDDM in which the process model they show was very much more prescriptive. In order to evaluate the new data mining process an analytical comparison between IKDDM and CRISP-DM was carried out and they presented the conclusion that IKDDM offered improvements in both effectiveness and efficiency (Sharma, Osei-Bryson, & Kasper, 2012).
The KDDM checklist approach, and the much more prescriptive IKDDM approach can be contrasted with the KDnuggets data mining survey’s second most popular
methodology identified as “My Own.”“My Own” is essentially any personal approach that the data miner has chosen to use. In the 2014 KDnuggets survey “My Own” was again identified as the second most popular data mining methodology with 27.5% of the vote, this shows increased preference for customised approaches when compared with the 2007 survey result of 19%.The strong support for “My Own” methodology may indicated that even with a standardised method that some room for personal customisation and flexibility may be required given that data mining approaches, requirements and challenges are constantly changing.
While work on CRISP-DM now appears to be stalled, Piatetsky, 2014 notes that it “does not seem to be maintained and adapted to the challenges of Big Data and modern data science” but also goes on to comment that “the 6 high-level phases of CRISP-DM are still a good description for the analytics process”. These comments and the survey results may indicate that while a structured approach is valuable at a high level some level of customisation or flexibility is also desirable which is possibly why “My Own” is second in popularity.
For this purposes of this experiment, the CRISP-DM methodology was selected, as it gives structure to the overall data mining process, without being too prescriptive. The author is also cognisant of the need for flexibility as highlighted above and will adjust the methodology as required to achieve the desired outcomes.
Page | 18
3.2 Method
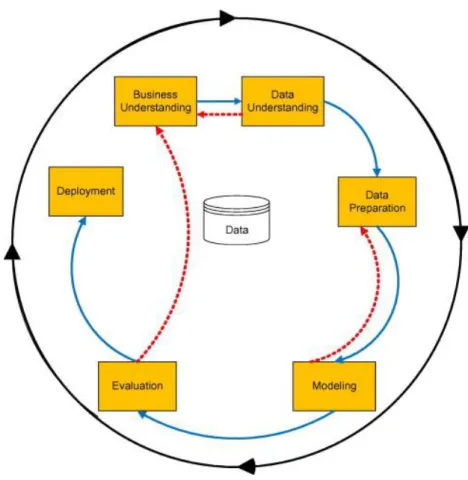
The iterative nature of a data mining process can be seen in Figure 1 below which shows the CRISP-DM data mining process. The arrows show the dependencies between each process/stage and the arrow going around the outside shows that as more knowledge is discovered the process may start over again whereby showing the
“cyclical nature of data mining” (Shearer, 2000, p. 14)
Figure 3-1 CRISP-DM process model (Sharma et al., 2012)
By mapping the dependant CRISP-DM steps into broader sections that interact with each other such as Business and Data Understanding, and Data Preparation and Modelling as shown in Figure 3-1, a broader more flexible methodology can be formed by which the experiment can be carried out and documented.
Page | 19
3.2.1 Business and Data Understanding
This section will cover both the “understanding” stages of the data mining process, business understanding and data understanding. Each of the “understanding” stages have a level of assumption to them, and as understanding is gained, these assumptions can be turned into knowledge that can be fed back into the data mining process.
“Business Understanding” is largely driven by the main objectives and scope of this experiment, the data mining of log file streams for the detection of anomalies. This section will describe the outcomes desired from this iteration of the data mining process at a high level. Research question four places constraints on the goals of this experiment by making sure that it has the potential to form the basis of a practical and scalable solution. Data understanding will be built on over each iteration of the data mining process as knowledge is gained.
3.2.2 Data Preparation and Modelling
In this section log file attributes and the model or set of models that will give the best performance for the detection of anomalies will be proposed for evaluation in relation to the data mining experiment to be carried out.
Data sets will be selected and checked, based on the understanding/knowledge at the time. Each iteration of the data mining process will most likely have a smaller set of goals as outlined in the Business and Data Understanding section in order to build towards the overall desired outcomes of the experiment.
There are already some areas of prior art and expert domain knowledge that could be informative in this stage. It is envisioned that several models may need to be built and evaluated in order to find one that is suitable to meet the goals of this experiment. Modelling of the data will then be performed and the results recorded so they can be evaluated.
3.2.3 Evaluation
In this section the experimental results based on the data mining and modelling process will be presented. The results will be evaluated, contrasted and compared. As
Page | 20
a final part of the evaluation, a summary of the findings in direct relation to the research questions will be undertaken.
3.2.4 Summary
In the summary section, all four of the research questions will be discussed based on the results from the completed evaluation of the current data mining iteration. The knowledge gained from the evaluation as shown in the CRISP-DM data mining process can be fed back into the business and data understanding stages of the next iteration of the process thus completing the cyclic nature of the data mining process.
3.3 Chapter Summary
This section presented the methodology that will be used and how this was adapted and structured for use in this data mining experiment. Using this methodology and high level structure described by this method, the results of the data mining experiment will be presented in the next chapter.
There has to be a stopping point to the experiment, and this is bounded by the time allowed for the submission of this thesis. The CRISP-DM iterative data mining process will be completed until either a workable solution becomes apparent or time runs out. At this point the understanding and knowledge gained will be presented and future work highlighted.
Page | 21
Chapter 4 - Experimental Study
During the course of this data mining experiment four full iterations of the CRISP-DM process were achieved, these four iterations are presented in this chapter. As per the CRISP-DM process each iteration builds on the knowledge and understanding of the previous iteration.
4.1
Iteration One
4.1.1 Business and Data Understanding
The business objectives of this stage of the experiment had to be taken in context of the wider goals of this experiment, so at this early stage it was determined that it was necessary to take a closer initial look at the data and use domain knowledge to decide how it could be processed. Completion of this goal would lead to a deeper
understanding of the data first hand. To achieve this initial insight and understanding of the data, an unsupervised approach was taken to explore the data further. By taking this approach the features of the data set were revealed and this led to further
business and data understanding.
As this was the first stage and attempt of the data mining process, only a limited level of knowledge in direct relation to the objectives of this data mining experiment was already known. This knowledge about log files features originated from prior research and consultation with domain experts and it was clear that there was still many unknowns at this early stage of the experiment.
These unknowns covered a variety of areas from implementation of the tools required in order to collect and prepare the data, how to collate and store the data, and finally how to process and model the data. By researching and implementing these aspects of the experiment it allowed for the initial understanding and knowledge to be gained around how to achieve the overall experimental outcomes.
Through the implementation of the whole data mining process, business
understanding could be gained in order to meet the wider goal of making a practical and scalable solution. The initial thoughts and decisions around tooling, data
Page | 22
4.1.2 Data Preparation and Modelling
After evaluation of the data mining tools available and given the large number of unknowns around the data mining requirements, it was decided that a much more flexible approach to the data mining problem would be pragmatic. Thus rather than using a dedicated data mining tool which might limit the scope or approach taken, a custom coded data mining framework was created. By utilising a custom code-based approach, it supported the widest number of data mining processes possible for all stages of the CRISP-DM data mining cycle. This code-based methodology enabled a much more flexible approach to answering the research questions at hand and allowed for the end goal of finding a practical and scalable solution to data mining log files for anomalies.
After examining applicable languages and libraries, Perl and Python were both short listed as potential languages for the implementation of this work. After examining each language, Perl was selected. This was based on my own experience with the language and the large library of functions available to Perl which were directly related to the data mining approach of this experiment.
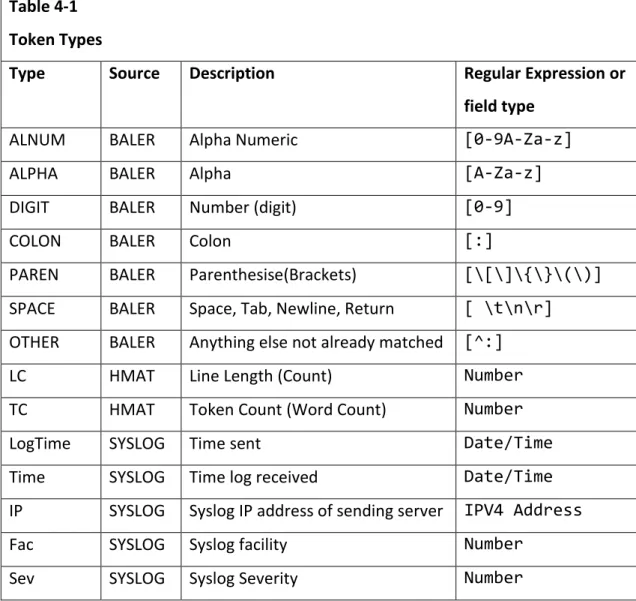
The first challenge was to receive the log information. By leveraging a standard Perl library, a simple log file collector was created using Net::Syslog (Howard, n.d.). This listened on the standard syslog port 514 and passed each log line into a function to process the data. This function then split the data into two parts, part one being the features based on the syslog standard, these syslog features are shown in Table 4-1 with the source listed as “SYSLOG”, and part two being the actual message or log event.
In order to extract a further feature set from a log file message for further processing, a common method used by a number of researchers is the simple use of white spaced words and in some instances the position of the word is also utilised. This approach can be seen in Simple Log file Clustering tool (SLCT) by R. Vaarandi, 2003 and also utilised in his further work “Loghound” (Risto Vaarandi, 2004). This approach can also be seen in “A Lightweight Algorithm for Message Type Extraction in System Application Logs” by Makanju et al., 2012 in which they developed IPLoM (Iterative Partitioning Log Mining) which also uses white space to split each token (feature). Makanju et al.,
Page | 23
2012 then grouped each log line by message token count before processing them further based on the assumption that messages of the same token length are from the same print statement source and thus can be clustered on. This same type of feature set extraction is also seen in HMAT by Frei & Rennhard, 2008, where they not only used the word(token) count, but the character count/line length as well. Frei & Rennhard, 2008 also expressed interest in trying different approaches to feature selection as future work.
To further extend the predictor attribute feature selection of log files for testing, but still retain a generalised approach the Baler high level initial token generation was used (Taerat et al., 2011). This is shown in Table 4-1 with the source listed as “BALER”. Baler did not just use space-delimited token generation as they stated that “it tends to give many and long token variations”. This may indicate that by over-simplifying the feature selection too much it may limit the overall effectiveness of the solution by becoming over generalised in its approach and thus limiting its effectiveness to log files which only have white space delimited words in them.
In further examination of the approach that Taerat et al., 2011 took with Baler, it was decided to only use the initial feature set that is generated and not further tokenise based on English words as Baler does to build English word clusters. If like Baler, each English word was used it would also become another predictor attribute which would have to be stored and tracked. By taking the storage of each English word usage out of the scope of predictor attributes it allows for a much more generic solution as is desired but still leverages the log file features as introduced in Taerat et al., 2011. HMAT (Frei & Rennhard, 2008) defined a word as being “any character sequence that does not include any white space.” This aligns well with the work referenced
previously but as described above may limit the effectiveness of this work. In contrast, in this work the sum of the total tokens per log line was used instead of the word count as defined in HMAT, this in principle should generate a higher count per line, but still should offer a general enough approach to be applicable across many log file line types without being overly sensitive to small changes. By using the token count it may even allow for increased detection as it may be able to detect feature changes that could be missed by the simple word count broken by white space approach. For the
Page | 24
character count the entire length of the syslog line was used. These features are listed with the source of “HMAT” in Table 4-1.
To extract this second set of features another Perl library HOP::Lexer - "Higher Order Perl" Lexer (Poe, n.d.) was used. This utilises regular expressions to tokenize the matched character strings into tokens as identified in Baler, generating a sum of each token type for each log line. These features are shown in Table 4-1 as Token Types.
Table 4-1 Token Types
Type Source Description Regular Expression or field type
ALNUM BALER Alpha Numeric [0-9A-Za-z]
ALPHA BALER Alpha [A-Za-z]
DIGIT BALER Number (digit) [0-9]
COLON BALER Colon [:]
PAREN BALER Parenthesise(Brackets) [\[\]\{\}\(\)]
SPACE BALER Space, Tab, Newline, Return [ \t\n\r]
OTHER BALER Anything else not already matched [^:]
LC HMAT Line Length (Count) Number
TC HMAT Token Count (Word Count) Number
LogTime SYSLOG Time sent Date/Time
Time SYSLOG Time log received Date/Time
IP SYSLOG Syslog IP address of sending server IPV4 Address
Fac SYSLOG Syslog facility Number
Sev SYSLOG Syslog Severity Number
Table 4-1 Token Types
Following the collection of tokens per line, the results had to be stored somewhere. At this stage the most appropriate way to collect the results was unknown, so in order to make collection easy they were stored in a local database so they could be accessed
Page | 25
and examined as required. Two databases were briefly trialled in order to see which one would be the easiest to work with.
The two databases compared are easy to access and work with from Perl but take two very different approaches. The first database application that was examined was SQLite (“SQLite Home Page,” n.d.). SQLite is a self-contained, server-less database which simply uses a file on a disk and thus is very easy to implement. This is in comparison to MYSQL (“MySQL :: The world’s most popular open source database,” n.d.). MYSQL is an open source relational DB product with commercial backing from Oracle. It comes in several variants, some which are free to use all the way up to massively scaled clustered instances. With this knowledge it was decided that although SQLite would be much easier to implement, MYSQL was picked in case it was necessary to scale the data storage application in order to achieve the desired outcomes of this experiment.
The initial data source was a university’s central syslog collection service, this service was being setup at the time and permission was sought and granted to allow its use for the purpose of this experiment. The data source receives streams of log files arriving from a number of different systems and services, including but not limited to firewall logs, Microsoft AD server security logs, network security sensors, antivirus events and Cisco network logs. This effectively generated a stream of unsupervised data from a large real-world IT environment from a variety of log file sources for use by the data preparation and modelling tools.
Several design and build issues were discovered during the construction of the initial log processing/modelling tool, however with redesign and testing these were
overcome. The two issues that stood out were the incorrect parsing of the log line information into tokens. The second issue was the overall performance of this initial approach to data collection.
Log parsing was confirmed with manual inspection of a sample of log lines to ensure that it was being performed correctly. A log parsing issue was discovered very early on, and was resolved in order to ensure correct generation of the predictor attributes for evaluation. It was found that the order of tokenising the information was critical to
Page | 26
ensure that the log line was processed correctly, once this was achieved the parsing was manually checked again in order to ensure correct operation.
An example of the parsing check can be seen in Table 4-2 below, where two sample log lines are compared and the token counts generated for each. Both samples in this case come from the Sendmail program, which is a common email gateway that is used across the internet.
Sample 1 “Jun 16 10:23:53 mail1 sendmail[7701]: s5FMNo62007686: to=dl@mail2, delay=00:00:03, xdelay=00:00:00, mailer=smtp, pri=184004, relay=mail2.abc.ac.nz. [156.62.1.14], dsn=2.0.0, stat=Sent (s5FMNrsR019233 Message accepted for delivery)”
Sample 2 “Jun 16 15:08:57 mail1 sendmail[30650]: s5G38Hwn030124: s5G38r27030650: DSN: Remote protocol error”
Table 4-2
Token Log Sample Token Counts
Type Sample 1 Sample 2
ALNUM 5 3 ALPHA 20 6 DIGIT 19 5 COLON 8 6 PAREN 6 2 SPACE 19 10 OTHER 25 0 LC 230 97 TC 102 32
Table 4-2 Token Log Sample Token Counts
The overall performance of the log processing software presented another serious issue related to the way it was implemented. The custom code-based Perl log processing software ran on the log collection server and wrote results to a remote database. The volume of streaming log file data, while not huge, was still large enough
Page | 27
to cause performance issues for both the log file processor and remote DB. As an immediate workaround it was decided to change to a batch insert type model and insert groups of 100 log lines at a time to work around this problem. This approach largely solved the issue at this stage of the experiment, and allowed for the collection of an initial set of results to be achieved.
In summary, for this data preparation and modelling section of this iteration, the attributes to be used were defined and are presented in Table 4-1 earlier and the source of the log files/data was determined. The predictor attributes were extracted and stored in a database for examination and evaluation.
4.1.3 Evaluation
The experimental data will now be examined in order to increase understanding and knowledge so any findings or discoveries can be fed back into the next iteration of the CRISP-DM data mining process.
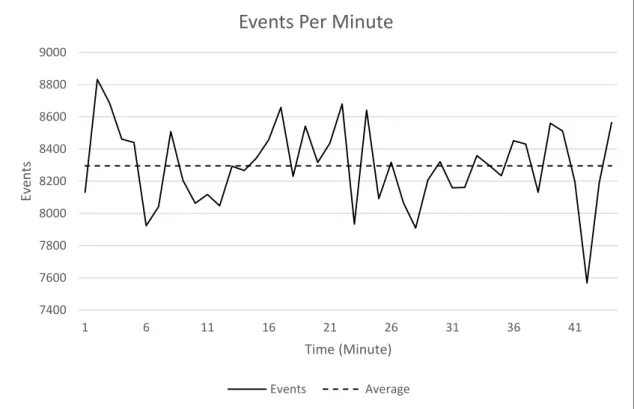
Figure 4-1 shows an example of a typical run. This sample was taken over a 45 min period in which 374517 log lines were recorded, equating to approximately 8323 log events per minute or 138 events per second (EPS). This represents a typical steady state of the log collector around 3:00 pm at the time this data was taken.
Figure 4-1 Events per Minute 7400 7600 7800 8000 8200 8400 8600 8800 9000 1 6 11 16 21 26 31 36 41 Ev en ts Time (Minute)
Events Per Minute
Page | 28
Given the performance impact that it was placing on the system in its current implementation, only short runs were performed at this stage to limit any negative effects on the production log collection system.
In the article presented by Butler, 2009 “Benchmarking Security Information Event Management (SIEM)”, he described a medium sized organisation of 750 to 1000 users along with the typical log events they generate across a number of systems and
services. He calculated a steady state approximately 150 EPS, given that not all the universities systems or servers were being logged in the production system under testing at the time the experiment was done this baseline rate could be considered comparable with the current findings.
While this steady state rate is similar, Butler, 2009 notes other EPS rates that should also be taken into account. He presented his estimations for a medium sized
organisation, these are a potential peak of 15600 EPS with an average Peak of 8100 EPS. As can been seen in Figure 4-1, while there was some variation around the average, there were no large spikes to indicate an event taking place which would push the EPS rates into these much larger ranges.
Other solutions have been built which can collect log data at these high rates, such as Chukwa (Rabkin & Katz, 2010) and Logjam (Cardo, 2011). Thus there are alternatives which could be investigated further if data collection at high speed is an ongoing problem. It should also be noted that Chukwa also offered methods for processing the data for feeding into an anomaly detection system as well.
Given the performance issues noted during the design and build phases, special attention will have to be taken to ensure that the data preparation and modelling framework is designed in such a way that these large peak EPS rates could be processed without adversely affecting any other system or the desired outcomes of this experiment.
Page | 29
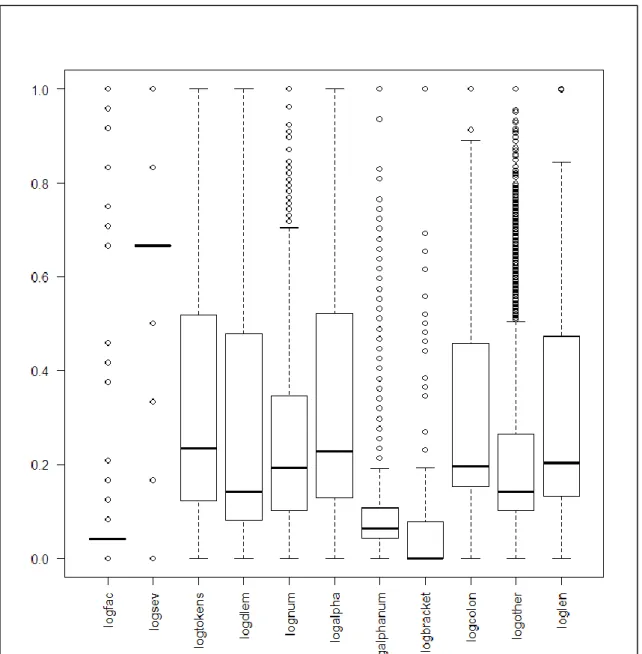
Figure 4-2 Predictor attribute box plot
Figure 4-2 shows box plots of each predictor attribute that was collected. They were generated using the R environment (R Core Team, 2015) with each range normalised from 0 to 1 so they could be compared directly against each other. The box plots used the default Tukey outlier definition of 1.5 x inter quartile range (IQR) with the outliers shown as circles.
Page | 30
Of immediate note was the two syslog predictor attributes, logfac which is the syslog facility and logsev which is the syslog severity level. As can be seen in Figure 3 they have almost no variance and thus generate a large number of outliers. Given this lack of variance, if a similar anomaly detection measurement technique to the one used in HMAT is employed it could generate a large number of false positives which could mask variances from the other predictor attributes. As noted in the introduction, the anomaly detection that this experiment is trying to achieve is not the one off event which is much more easily detected by signature or rule based approaches, but more when the “mix” of predictor attributes has changed.
This can be contrasted with the other attributes which can be grouped by the range of outliers they exhibit. With no outliers in this sample set, logtokens (Tokens), logdlem (Delimiters), logother (Other, anything not matched) and logalpha (Alpha) have good variance. Still displaying good variance but with some outliers lognum (Numbers), logcolon (Colons) and loglen (Line Length). This leaves logalphanum (Alpha Numeric) and logbracket (Brackets) which only show a small variance and a large number of outliers.
Figure 4-3 Tokens Density Plot
Page | 31
Figure 4-3 shows an “R” density plot (“Kernel Density Estimation,” 2015) using the default Gaussian kernel with the smoothing bandwidth selected by the rule-of-thumb
“nrd0” method of the token count across all instances of the 45 minute sample. It can be seen that it is a non-Gaussian distribution and is multimodal.
The multimodal nature of the distribution could be derived from the nature of the log source data as it is the representation of a number of log sources consolidated into one. Even with logs source from one system, different message types could have very different token counts depending on how they are reported to the logging system. Also of note is that from this sample period there were some peaks which are much larger than others, this may have an effect on how anomalies are detected and a very large peak may mask the detection of a change in one of the smaller ones.
4.1.4 Summary
A summary of the results of the evaluation will now be presented in context to the research questions at hand and this will provide feedback into the data mining process for the next iteration.
Question One – Efficient and accurate predictor attributes
While syslog was a convenient log message transport protocol, the predictor attributes specific to it (Facility and Severity) don’t appear to offer much value as they are very specific to the syslog log message format and are not widely used across all log
message types as can be seen by the very low variance. In the end solution it is not the author’s intention to keep each and every line as a separate log entry, rather the author intends to generate a summary from which anomaly detection can be run against, so the line specific attributes (Log line Time and IP) should also be removed as they will not be able to be used in a generalised fashion and are more suited to other anomaly detection types which are based on log volume and source.
Frei & Rennhard, 2008 also supported this and noted that while volume is important it does not contribute to the anomaly detection. They were more concerned about whether the mix of log messages had changed and this is what drove their anomaly detection level.
Page | 32
The low variance shown among some of the other predictor attributes is most likely largely influenced by how the log file messages are generated and how the individual author of that program has decided what their output format should look like and how it should be recorded. As noted in the literature review there is still no one standard for all log format types, and while this is the case a more generic approach to the predictor attributes should be considered as an acceptable approach that could be applied broadly to many different log format types. Also focusing on just one predictor attribute might not be wise. In HMAT where they have picked white spaces, it limits the approach to log files which have a variance in white spaces only. Some log files may not have any variance in white spaces and thus having other predictor attributes may allow this limitation to be overcome.
After discussions were held with a domain expert, an initial time slice of one minute was discussed and presented as a sensible time interval between checks. As shown in Figure 4-1 this currently equates to an average of 8323 log events per minute. This offers a balance between sample size and potential speed of detection. Given that this is to be used in a streaming type environment, a one minute window is still an
acceptable time frame for an anomaly detection system to function within, while still offering the ability to be altered if required and not use out-of-band log processing to find it after the fact.
Question Two – Performant model/s for the detection of anomalies
No anomaly detection models were evaluated in this first iteration, but the predictor attributes were. As can be seen from the box plot in Figure 4-3 some outliers can already be detected. If these are true outliers or just an outcome of the mix of different log file types all being combined together is still yet to be determined.
Also in order to get further understanding of the data as intended, every log event was recorded and this approach is more typical of a signature type anomaly detection methodology. While each line by itself is quite unique, the aggregate mix of events over a period of time is intended to be used.
Page | 33
Question Three – Evaluation of anomaly detection model/s.
From now the goal is to find a distance/change detection type model or models that could be employed and are suitable for the log file predictor attributes that have been selected. This moves towards a more generic application and approach as influenced by HMAT (Frei & Rennhard, 2008) and Baler (Taerat et al., 2011) now that data knowledge and understanding has been increased.
In order to narrow the focus initially to allow for discovery of model types in the next iteration, anomaly detection will be focused on line length, this predictor attribute showed good variance, and did have some outliers and thus offers a middle ground between the attributes with no outliers and ones with many.
Question Four – Practical and scalable performance constraints.
As noted in section 4.1.2 several performance issues were apparent in the initial design in relation to the volume of data that was being processed. An initial work around was performed by changing to a batch insert design in order to achieve the initial goals of this stage of the data mining experiment but further work was identified as necessary to overcome these issues.
The design change required for the next stage of this experiment should overcome many of these initial issues as it moves to a more generalised approach and is not trying to process everything one line at a time into a remote data store.
With the design change to a one minute window in the next iteration, an update to a database will only need to occur once every minute and this should resolve any database transaction type issues. While this takes care of the transaction speed side, ensuring the client application is performant is also of concern. With this in mind the single threaded initial application will be modified into a multithreaded one to ensure that data can still be collected while it is writing to the database.
At this time it was also considered that if this multithreaded approach could not be achieved, then it might be possible to leverage another log collection system to perform this aspect of the framework allowing the anomaly detection to be handled independently of it. It is not intended to pursue this at this time, but will remain in mind as part of the wider outcomes of this project.
Page | 34
Incorporating some early form of visualisation at this stage may also offer further insights into the data, thus increasing knowledge and understanding. At this stage the unsupervised data approach