Systems Engineering Management
Plan
Dallas Integrated Corridor Management
(ICM) Demonstration Project
www.its.dot.gov/index.htm
Final Report — December 2010
FHWA-JPO-11-048
Produced by FHWA Office of Operations Support Contract DTFH61-06-D-00004
ITS Joint Program Office
Research and Innovative Technology Administration U.S. Department of Transportation
Notice
This document is disseminated under the sponsorship of the Department of Transportation in the interest of information exchange. The United States Government assumes no liability for its contents or use thereof.
Technical Report Documentation Page 1. Report No.
FHWA-JPO-11-048
2. Government Accession No. 3. Recipient’s Catalog No.
4. Title and Subtitle
Systems Engineering Management Plan
Dallas Integrated Corridor Management (ICM) Demonstration Project
5. Report Date December 2010
6. Performing Organization Code
7. Author(s) 8. Performing Organization Report No.
9. Performing Organization Name And Address 10. Work Unit No. (TRAIS)
11. Contract or Grant No.
12. Sponsoring Agency Name and Address U.S. Department of Transportation
Research and Innovative Technology Administration (RITA) 1200 New Jersey Avenue, SE
Washington, DC 20590
13. Type of Report and Period Covered
14. Sponsoring Agency Code ITS JPO
15. Supplementary Notes
16. Abstract
The purpose of the Dallas ICM System is to implement a multi-modal operations decision support tool enabled by real-time data pertaining to the operation of freeways, arterials, and public transit. The system will be shared between information systems and people involved in transportation operations and emergency response in the US-75 Corridor. The Dallas ICM System is intended to provide improved integration of operation procedures, including procedures that take advantage of the data sharing capabilities of the Dallas ICM System and facilitate improved emergency response, and traveler information.
This Systems Engineering Management Plan is designed to assist the Dallas ICM Team by defining a procedural framework for management and control of the systems engineering components provided in the US-75 Integrated Corridor Management Demonstration Project contract. The Project Management Plan serves as a reference for information regarding project structure and procedures throughout the project life cycle. As such both are living documents and will be reviewed at least twice in each year of the contract and updated as appropriate.
17. Key Words
Integrated corridor management, Dallas, multi-modal operations, decision support tool, transportation operations, real-time data, systems engineering, procedural framework
18. Distribution Statement No restrictions.
19. Security Classif. (of this report) Unclassified
20. Security Classif. (of this page) Unclassified
21. No. of Pages 61
22. Price N/A
Table of Contents
Chapter 1. Program Overview ... 1
1.1 INTRODUCTION ... 1
1.2 PROGRAM OBJECTIVES ... 1
1.3 PROGRAM APPROACH ... 1
1.4 PROGRAM ASSUMPTIONS AND CONSTRAINTS ... 2
1.4.1 Program Assumptions for the Demonstration Project ... 3
1.4.2 Technology Assumptions for the Demonstration Project ... 3
1.4.3 Institutional Assumptions for the Demonstration Project ... 4
1.4.4 System Constraints for the Demonstration Project ... 4
1.5 PROGRAM GOALS AND OBJECTIVES ... 4
1.6 PROGRAM PERFORMANCE TARGETS ... 5
1.7 PURPOSE ... 6
Chapter 2. References ... 8
Chapter 3. The Systems Engineering Process ... 9
3.1 OVERVIEW OF THE SYSTEMS ENGINEERING PROCESS ... 9
3.2 DALLAS ICMSYSTEMS ENGINEERING PROCESS ... 9
3.2.1 Application of the Systems Engineering Process ... 10
3.3 SYSTEMS ENGINEERING DESCRIPTION ... 11
3.3.1 Structured Analysis and Design Methodology ... 13
3.3.2 Context diagram ... 13
3.3.3 Data dictionary ... 14
3.3.4 Data Flow Diagrams ... 14
3.3.5 Structure Chart ... 15
3.3.6 Structured Design ... 16
3.3.7 Requirements Analysis ... 16
3.3.8 Relationship to the ITS Regional Architecture ... 16
3.3.9 User Needs and Functional Breakdown ... 19
3.3.10 Interface Standards ... 20
3.3.11 Concept of Operations ... 20
3.4 TRACKING PROJECT REQUIREMENTS AND THE USE OF A DATABASE20 3.4.1 Functional Design Hierarchy ... 21
3.4.2 Design Verification ... 21
3.4.3 Requirements Database and Tracking Tool ... 22
3.4.5 Analysis of Alternate Designs and Technologies ... 27
3.4.6 Implementation Options ... 28
3.4.7 Functional Verification ... 28
3.4.8 Transition Phase ... 29
3.4.9 Validation Phase ... 30
3.4.10 Operation and Maintenance Phase ... 31
3.4.11 Use of Standard Practices and Tools ... 32
Chapter 4. Management with the Systems Engineering Process ... 33
4.1 LIFE-CYCLE MANAGEMENT USING THE SYSTEMS ENGINEERING PROCESS ... 33
4.1.1 Project Management Planning ... 33
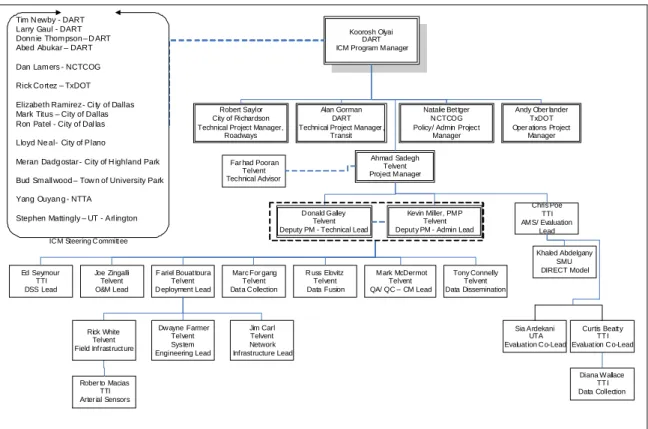
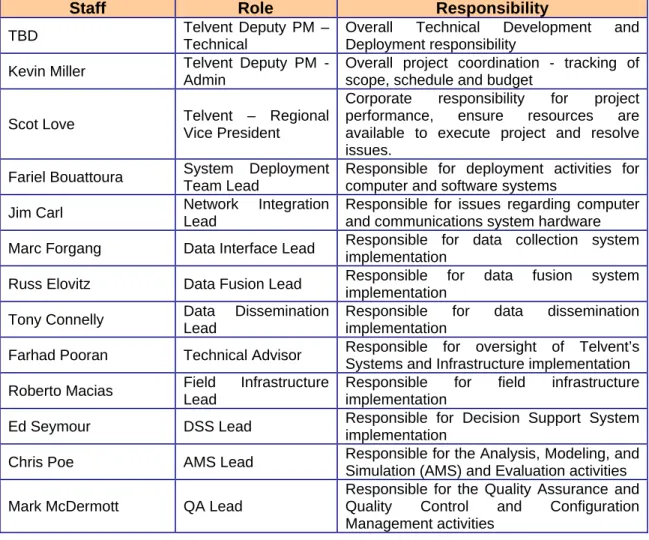
4.1.2 Organization Structure ... 33
4.1.3 Work Breakdown Structure ... 37
4.1.4 Schedule ... 37
4.1.5 Risk Management ... 37
4.1.6 Subcontractor Management ... 38
4.1.7 Project Status Review ... 39
4.1.8 Configuration Management ... 39
4.1.9 Data Management ... 44
4.1.10 Technical Performance Measurement ... 44
4.1.11 Technical Reviews ... 44
4.1.12 Requirements Traceability ... 46
Chapter 5. Engineering Specialty Integration ... 47
5.1 ENGINEERING SPECIALTY INTEGRATION INTRODUCTION ... 47
5.2 ENGINEERING SPECIALTIES –INTEGRATED PRODUCT TEAMS ... 47
5.2.1 Decision Support Team ... 47
5.2.2 System Implementation Team ... 47
5.2.3 System Deployment Team ... 48
5.2.4 Operations and Maintenance Team ... 48
5.2.5 Administration and Coordination Team ... 48
5.2.6 Analysis, Modeling and Simulation Team ... 48
5.3 ENGINEERING SPECIALTY SELECTION ... 49
5.3.1 Data Management Engineering ... 49
5.3.2 Software Engineering ... 50
5.3.3 Test Engineering ... 50
5.3.4 Hardware Engineering ... 50
5.3.5 Communication Engineering ... 50
5.3.6 Configuration Management/ Quality Control Engineering50 5.3.7 Operations and Maintenance Engineering ... 50
List of Tables
Table 1-1. Goals and Objectives Relationship ... 4
Table 1-2. Corridor Performance Measure Targets – Demonstration Project . 6 Table 3-1. Summary of Market Package Priorities for the DFW Regional ITS Architecture ... 17
Table 4-1. Project Roles and Contact Information ... 34
Table 4-2. Project Deliverables and Responsibilities ... 35
Table 4-3. Subcontractor Software Configuration Management Identification and Contacts ... 38
Table 4-4. Configuration Management (CM) Subcontractor-Related Activities ... 38
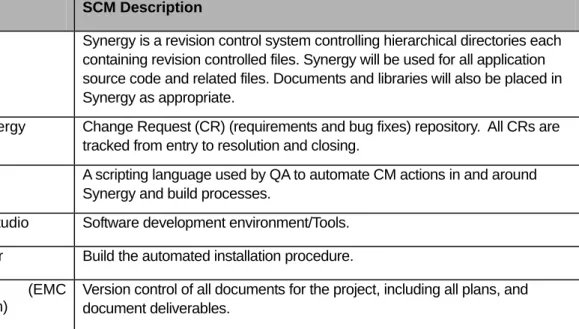
Table 4-5. Configuration Management Tools ... 40
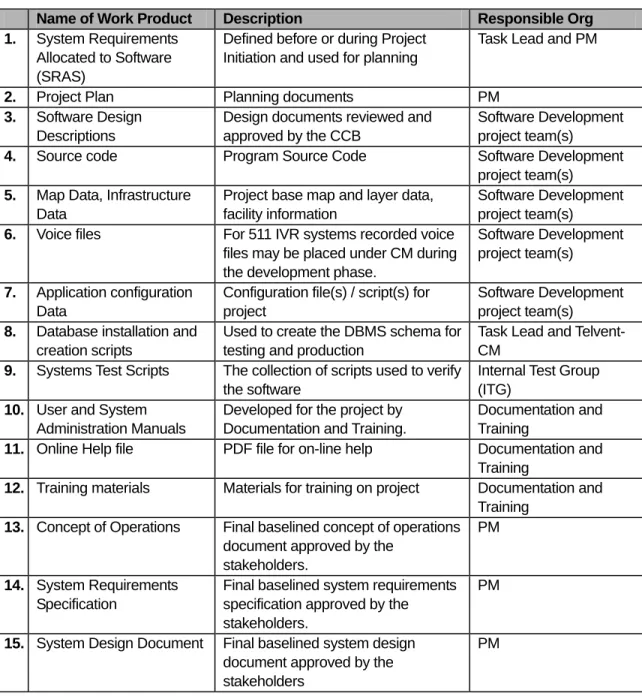
Table 4-6. Configuration Managed Items ... 41
Table 4-7. Software Configuration Management Reports ... 42
List of Figures
Figure 1-1. ICM Logical System Architecture ... 2Figure 3-1. Requirements Input Form ... 23
Figure 3-2. Requirements Database Table ... 23
U.S. Department of Transportation, Research and Innovative Technology Administration Intelligent Transportation System Joint Program Office
Systems Engineering Management Plan Dallas ICM Demonstration Project
|
1Chapter 1. Program Overview
1.1 Introduction
The US-75 Integrated Corridor Management System Demonstration Project is a multi-agency, de-centralized operation which will utilize a set of regional systems to integrate the operations of the US-75 corridor. The purpose of the Dallas ICM System is to implement a multi-modal operations decision support tool enabled by real-time data pertaining to the operation of freeways, arterials, and public transit. The system will be shared between information systems and people involved in transportation operations and emergency response in the US-75 Corridor. The Dallas ICM System is intended to provide improved integration of operation procedures, including procedures that take advantage of the data sharing capabilities of the Dallas ICM System and facilitate improved emergency response, and traveler information.
A team headed by the Dallas Area Rapid Transit agency is providing technical and management services in support of the Dallas Integrated Corridor Management Demonstration Project.
1.2 Program Objectives
The proposed demonstration Integrated Corridor Management (ICM) system will operate as a multi-modal operations decision support tool with a cooperative network of agencies which will operate the corridor in a coordinated manner to reduce congestion of the transportation network, and improve the movement of people and goods within the corridor.
For the Demonstration Phase of the ICM Project, the Dallas team has reviewed the projects and systems which will be completed in the 24 month timeframe. We plan to have
components of all the end stage systems deployed in the 24 month timeframe, and an ATIS and 511 public information systems will be deployed, along with the development of a Decision Support system, and improvements to the SmartNET/ SmartFusion product already deployed in Dallas.
1.3 Program
Approach
The “ICMS” will operate as a multi-modal operations decision support tool with a cooperative network of agencies which will operate the corridor in a coordinated manner to reduce congestion of the network, and improve the movement of people and goods within the corridor. The ICM Demonstration System will consist of the following systems: a Decision Support subsystem; the Dallas SmartNET and SmartFusion subsystems; external to the ICMS the ICM program will deploy a 511 ATIS system, which includes an Interactive Voice Response (IVR) system, a 511 Web Site, and a Personalized Traveler System. In addition, several Infrastructure projects have been proposed to fill in data infrastructure gaps in the corridor.
1. Introduction
U.S. Department of Transportation, Research and Innovative Technology Administration Intelligent Transportation System Joint Program Office
Report Title – Draft
|
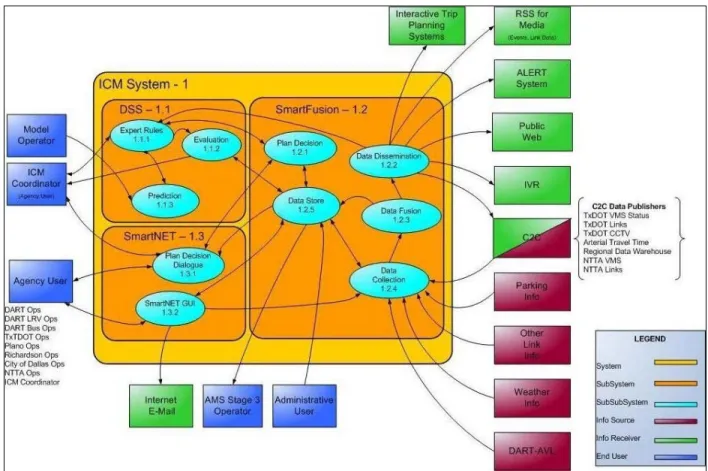
2The SmartFusion Database will store the data within the ICM System; this data will come from historical data possibly provided by the Regional Data Warehouse, current network data provided by the ICM Agencies in the corridor, and output data from the Decision Support subsystem including response plans and predictive conditions of the network. The Decision Support subsystem will be used as a tool for coordination of responses to events, evaluation of current network conditions, and prediction of network conditions in order to proactively manage the corridor. Lastly, the SmartNET subsystem will be a tool which will allow the viewing, reporting, and sending of information about Incidents, Construction, Special Events, and static ITS data (location of components, transit schedules, etc.) The SmartNET subsystem will provide a browser based interface for approved users to interact with the data, provide a response/request interface to the Decision Support System, and will provide a data feed of current network conditions to the 511 system.
Figure 1-1. ICM Logical System Architecture
1.4 Program
Assumptions
and
Constraints
Since the practice and concepts of ICM are relatively new, several program, technology, and institutional assumptions were made in the development of the high-level requirements. These assumptions may need adjustment once more is known, and ICM deployment is
1. Introduction
U.S. Department of Transportation, Research and Innovative Technology Administration Intelligent Transportation System Joint Program Office
Report Title – Draft
|
3under way. However, based on the information we currently have on ICM and the corridor, these are our best assumptions.
1.4.1 Program Assumptions for the Demonstration Project
The Regional Center to Center information exchange system will be sufficient for the data exchange needs of the ICM
The Regional Center to Center information exchange system will be deployed by some stakeholders
The Regional Data Warehouse will be deployed
The standards deployed as part of the Regional Center to Center will be sufficient in most cases for the data needed for the ICM System
Data networking communication links between all US 75 stakeholders are incomplete
Current deployed infrastructure and systems will be utilized as appropriate
This is a research project, so some of the technology and systems deployed may need to be altered once operations have begun
Utilize off-the-shelf solutions as much as possible
Current and proposed infrastructure will be sufficient for the data requirements of the ICM, and the Decision Support subsystem1.4.2 Technology Assumptions for the Demonstration Project
Utilize the existing Regional Center to Center information exchange system
Existing systems will sufficient for the needs of the system
DART Network will be deployed under a separate project
Regional Data and Video Sharing System may be deployed
Regional Center to Center plug-in may be deployed for all stakeholders
Current agency user authorization and authentication practices will be used
Current agency information technology standards (hardware/ software) will be used
Decision Support Subsystem will interface to the Dallas SmartNETsubsystem for request and responses for implementation of Pre-approved Response Plans
SmartNET and SmartFusion will utilize existing products with some modifications for interfaces and data1. Introduction
U.S. Department of Transportation, Research and Innovative Technology Administration Intelligent Transportation System Joint Program Office
Report Title – Draft
|
41.4.3 Institutional Assumptions for the Demonstration Project
An Operator at DalTrans will be the ICM Coordinator
Funding will be available for ICM
Agencies within the corridor will be willing to optimize the entire corridor, even if it impacts the transportation network under their control
Regional Transportation Council and NCTCOG are supportive of the ICM and will provide funding, when needed.1.4.4 System Constraints for the Demonstration Project
The budget for the ICM is limited to the approved budget between DART and USDOT
The design and deployment is limited to 20 months
The ICMS is currently funded and approved to operate for an 18 month period
The computer hardware and software will be deployed within the Daltrans facility, and must utilize the aesthetic standards for racks and cabling1.5 Program Goals and Objectives
These Goals and Objectives are interrelated such that activities and strategies oriented towards attaining one of the Goals will likely impact the attainment of other Goals and Objectives.
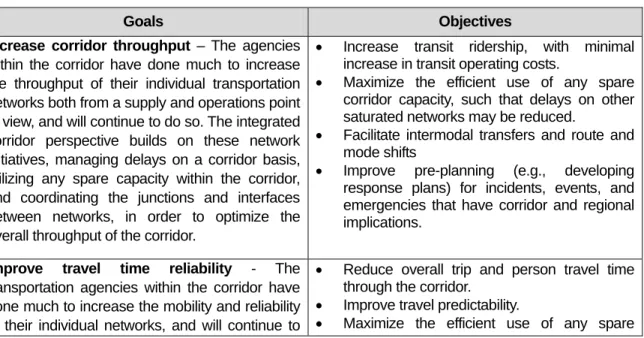
Table 1-1. Goals and Objectives Relationship
Goals Objectives
Increase corridor throughput – The agencies within the corridor have done much to increase the throughput of their individual transportation networks both from a supply and operations point of view, and will continue to do so. The integrated corridor perspective builds on these network initiatives, managing delays on a corridor basis, utilizing any spare capacity within the corridor, and coordinating the junctions and interfaces between networks, in order to optimize the overall throughput of the corridor.
Increase transit ridership, with minimal increase in transit operating costs.
Maximize the efficient use of any spare corridor capacity, such that delays on other saturated networks may be reduced.
Facilitate intermodal transfers and route and mode shifts
Improve pre-planning (e.g., developing response plans) for incidents, events, and emergencies that have corridor and regional implications.
Improve travel time reliability - The transportation agencies within the corridor have done much to increase the mobility and reliability of their individual networks, and will continue to
Reduce overall trip and person travel time through the corridor.
Improve travel predictability.
1. Introduction
U.S. Department of Transportation, Research and Innovative Technology Administration Intelligent Transportation System Joint Program Office
Report Title – Draft
|
5Goals Objectives
do so. The integrated corridor perspective builds on these network initiatives, managing delays on a corridor basis, utilizing any spare capacity within the corridor, and coordinating the junctions and interfaces between networks, thereby providing a multi-modal transportation system that adequately meets customer expectations for travel time predictability.
corridor capacity, such that delays on other saturated networks may be reduced.
Improved incident management - Provide a corridor-wide and integrated approach to the management of incidents, events, and emergencies that occur within the corridor or that otherwise impact the operation of the corridor, including planning, detection and verification, response and information sharing, such that the corridor returns back to “normal.”
Provide/expand means for communicating consistent and accurate information regarding incidents and events between corridor networks and public safety agencies.
Provide an integrated and coordinated response during major incidents and emergencies, including joint-use and sharing of response assets and resources among stakeholders, and development of a common policies and processes.
Continue comprehensive and on-going training program – involving all corridor transportation networks and public safety entities – for corridor event and incident management.
Enable intermodal travel decisions - Travelers must be provided with a holistic view of the corridor and its operation through the delivery of timely, accurate and reliable multimodal information, which then allows travelers to make informed choices regarding departure time, mode and route of travel. In some instances, the information will recommend travelers to utilize a specific mode or network. Advertising and marketing to travelers over time will allow a greater understanding of the modes available to them.
Facilitate intermodal transfers and route and mode shifts
Increase transit ridership
Expand existing ATIS systems to include mode shifts as part of pre-planning
Expand coverage and availability of ATIS devices
Obtain accurate real-time status of the corridor network and cross-network connections
1.6 Program
Performance
Targets
Taking into account the vision, goals, and current conditions within the Corridor, the US-75 Steering Committee discussed “success“ targets for several of the performance measures, their main concern was if the target was realistic, could be measured, and if enough data would be available. These “Performance Measures Success Thresholds,” listed in Table 1-2, provide an indication that the corridor goals have been achieved. The listed performance levels/thresholds are long-term targets that reflect the future vision of how the corridor will operate. Upon deployment of the ICM, any movement toward the thresholds will indicate
1. Introduction
U.S. Department of Transportation, Research and Innovative Technology Administration Intelligent Transportation System Joint Program Office
Report Title – Draft
|
6that ICM is having the desired effect. As data is collected in the next phase, and ICM model developed the targets will be validated and goals adjusted to ensure realistic and achievable targets are used.
Table 1-2. Corridor Performance Measure Targets – Demonstration Project
Performance Measure Performance Measure Success Threshold Travel Time Index Reduce Index by 2% per year
Corridor Throughput Increase overall throughput – increase person/trips per hour by 2% per year
Clearance time for an Incident (based on Jurisdiction and Corridor)
Emergency Responder Training - 75% of agencies trained on Incident Management response.
Response time Response to Incidents - target is a consistent response time between jurisdictions (within 5 minutes)
Parking Lot Volume at Transit locations
Parking Lot Capacity – 90% utilization
Ridership per vehicle (Transit) Increase of ridership – 2% (year to year increase)
Provide ATIS information to public on incident
Information to Regional 511 System – Incident available to the public within 10 minutes of Incident entered into SmartNET
Public Perception Public Perception – Awareness of ICM and perceived benefits (survey based)
ICM Response Plan deployment ICM Response Plan activated - 95% of plans were deployed correctly
The performance measures and targets discussed above focus on assessing the overall effectiveness of the ICM and corridor operations for purposes of needs identification and improvement selections. Such parameters, however, are not conducive to day-to-day
assessments of alternatives by travelers and are not sensitive to quickly changing conditions within the corridor.
Data collection for the performance measures (i.e., overall assessment) and operations measures will be identical, using the information collected by each of the individual network systems. However, their respective processing may be different.
1.7 Purpose
The purpose of the Systems Engineering Management Plan is to assist the Dallas ICM Team by defining a procedural framework for management and control of the systems engineering components provided in the US-75 Integrated Corridor Management
1. Introduction
U.S. Department of Transportation, Research and Innovative Technology Administration Intelligent Transportation System Joint Program Office
Report Title – Draft
|
7Demonstration Project contract. The Project Management Plan serves as a reference for information regarding project structure and procedures throughout the project life cycle. As such both are living documents and will be reviewed at least twice in each year of the contract and updated as appropriate.
U.S. Department of Transportation, Research and Innovative Technology Administration Intelligent Transportation System Joint Program Office
Systems Engineering Management Plan Dallas ICM Demonstration Project
|
8Chapter 2. References
Final Concept of Operations for the US-75 Integrated Corridor in Dallas, Texas, October 2010
Final Systems Requirements Specification for the US-75 Integrated Corridor in Dallas, Texas, October 2010
System Engineering Handbook: A Guide for System Life Cycle Processes and
Activities, version 3.2, January 2010, International Council on Systems Engineering
System Engineering Handbook: A Guide for System Life Cycle Processes and
Activities, version 2a, June 2004, International Council on Systems Engineering
Systems Engineering Guidebook for ITS, FHWA CA Division/ Caltrans, version 3.0, January 2010
ISO/IEC 15288:2008, Systems and Software Engineering – System life cycle processes, Geneva, International Organization for Standardization, issued 1 February 2008
“Just Enough Structural Analysis”, rev 051406,May 2006, Ed Yourdon
Dallas Fort-Worth Regional ITS Architecture, http://www.nortex-its.org/Library.htm
“Systems Engineering Guidebook for ITS,” California Department of Transportation, Division of Research & Innovation, Version 1.1, February 14, 2005.
FHWA Rule 940, Federal Register/ Vol. 66, No. 5/Monday, January 8, 2001/Rules and Regulations, Department of Transportation, Federal Highway Administration 23 CFR Parts 655 and 940, [FHWA Docket No. FHWA–99–5899] RIN 2125–AE65 Intelligent Transportation System Architecture and Standards.
Florida’s Statewide Systems Engineering Management Plan, version 2, Florida
Department of Transportation, 2005
IEEE Guide to Developing System Requirements Specifications, Institute of Electrical and Electronics Engineers, 1998
U.S. Department of Transportation, Research and Innovative Technology Administration Intelligent Transportation System Joint Program Office
Systems Engineering Management Plan Dallas ICM Demonstration Project
|
9Chapter 3. The Systems
Engineering Process
This SEP ensures that the mission, goals, and objectives of the Dallas ICM stakeholders are met by ensuring that the ICM demonstration project is deployed in a fully integrated,
seamless, and coordinated multimodal system.
3.1 Overview of the Systems Engineering Process
The purpose of this chapter is to provide an overview of the standard systems engineering process (SEP) that is implemented in the Dallas ICM Demonstration project; to provide the background for the SEP; and to cite applicable standards and references to support the standard selected. The INCOSE Systems Engineering Handbook v.3.2, based upon ISO/IEC 15288:2008, was used as a reference in the development of this SEP. Key processes that will be used are:
Creation of high-level requirements
Creation of detailed requirements
Trade-off studies, gap analyses, or technology assessments
Technical reviews
Risk identification, assessment, and mitigation
Creation of the requirements traceability verification matrix (RTVM)
Creation of performance measure metrics
System test, integration, and acceptance planning3.2 Dallas ICM Systems Engineering Process
The Dallas ICM Team’s approach is consistent with the system engineering process which is proven to greatly improve the chances of a successful system deployment by reducing the risk of unnecessary or unrealistic requirements, while validating that user needs (functional, political and budgetary) are met by the system.
We will build upon the Stage I and Stage 2 artifacts, to complete the remaining activities in the systems engineering process. In Stage 1 we developed our Concept of Operations and High-Level Requirements. As we begin the Stage 3 Demonstration phase, we will work with the US DOT to refine our High Level Requirements to complete the Detail Requirements, High Level and Detailed Design; once these are completed we will begin implementation of our ICM Demonstration. Since this project is a Design, Build, Operate and Maintain type of contract – some of the implementation may utilize an iterative methodology. Since some of the systems and concepts of the ICM are new, we are approaching those from multiple directions in order to reduce risk, and to deliver a working system.
3. The Systems Engineering Process
U.S. Department of Transportation, Research and Innovative Technology Administration Intelligent Transportation System Joint Program Office
Report Title – Draft
|
103.2.1 Application of the Systems Engineering Process
The Dallas Integrated Corridor Management Demonstration Project will utilize a systems engineering process that ensures that the Integrator develops and closely adheres to a design process that is acceptable. The System Engineering process includes engineering for the design, software development, integration testing, documentation development, and installation and deployment of the ICM Demonstration project. DART will utilize the services of consultants to ensure that this process is followed. Presented below are the four areas of engineering analysis that will be implemented:
1. System Requirements Analysis – As described previously, the Dallas Integrated Corridor Management Concept of Operations document has been developed and approved by DART and the ICM stakeholders. The information presented in the Concept of Operations document was used during the development of the Dallas Integrated Corridor Management Systems Requirements, which are functional in nature.
2. Sub-System Functional Analysis – As part of the system requirements development process, Telvent will expand on the system requirements to the sub-system level. Telvent will ensure there are no conflicts between the system and the sub-system related requirements. It is expected that the various external interfaces will be identified at this point in the requirements development process.
3. Design Synthesis – Telvent will then use the various system and sub-system related functional requirements as the basis for designing the Dallas Integrated Corridor Management Demonstration project. The Dallas team will closely oversee the Telvent’s design process and will conduct several rounds of testing to ensure that all identified requirements are being met. It is envisioned that Telvent will utilize the comprehensive requirements trace matrix, which will be developed, as the guide to ensure that the Dallas Team is designing the Dallas Integrated Corridor Management Demonstration project correctly.
4. System Analysis – During the design process, the Dallas team will monitor this activity to quickly identify possible technical problems with proposed equipment, commercial off-the-shelf (COTS) hardware or software, and customized application software. If technical trade-offs need to be implemented, the Integrator shall follow these procedures. The Program Manager will be required to approve the
requested technical trade-off as proposed by Telvent.
Telvent has developed and implemented an internal document and drawing review and approval process that will be applied to the systems engineering process of the Dallas Integrated Corridor Management Demonstration project through system acceptance. The Dallas ICM Program Manager will have the contractual and legal authority to sign off on all system engineering related aspects of the Project. The typical approval process will be as described below:
1. Telvent will be required to provide a particular document and/or drawing within a certain timeframe.
3. The Systems Engineering Process
U.S. Department of Transportation, Research and Innovative Technology Administration Intelligent Transportation System Joint Program Office
Report Title – Draft
|
112. The Dallas Team and US DOT will carefully review and provide comments and/or suggested modifications on the document or drawing. Telvent will then compile all of the comments into a single document.
3. Telvent will provide a recommendation to the Dallas ICM Program Manager, which might be to approve the document/drawing or ask to make changes and re-submit the document for a second round of review.
4. The Dallas ICM Program Manager and USDOT will then make the decision
whether or not to officially approve the document/drawing and will inform, in writing, the Telvent Project Manager of that decision.
5. If the document or drawing is approved, it will become a configuration item and any further changes will require a change request.
To enhance the ability for the Dallas team to closely track the Telvent’s system engineering process, Telvent will be required to provide a document management tool, ProjectSolve. This program will support the storage and retrieval of all types of project documents, including correspondence and e-mail messages. The program will also have the capability to segregate documents from general project documentation that can be accessed
exclusively by DART and Telvent staff. This system is browser based to allow the users to access the documents and files remotely to better facilitate the oversight of the work.
3.3 Systems Engineering Description
Systems engineering is a perspective, a process, and a profession, as illustrated by these three representative definitions.
1. Systems engineering is a discipline that concentrates on the design and application of the whole (system) as distinct from the parts. It involves looking at a problem in its entirety, taking into account all the facets and all the variables and relating the social to the technical aspect.
2. Systems engineering is an iterative process of top down synthesis, development, and operation of a real-world system that satisfies, in a near optimal manner, the full range of requirements for the system.
3. Systems engineering is an interdisciplinary approach and means to enable the realization of successful systems. It focuses on defining customer needs and required functionality early in the development cycle, documenting requirements, and then proceeding with design synthesis and system validation while considering the complete problem: operations, cost and schedule, performance, training and support, test, manufacturing, and disposal. SE considers both the business and the technical needs of all customers with the goal of providing a quality product that meets the user needs.
The role of the systems engineer encompasses the entire life cycle for the system-of-interest. Systems engineers orchestrate the development of a solution from requirements determination through operations and system retirement by assuring that domain experts are properly involved, that all advantageous opportunities are pursued, and that all
3. The Systems Engineering Process
U.S. Department of Transportation, Research and Innovative Technology Administration Intelligent Transportation System Joint Program Office
Report Title – Draft
|
12significant risks are identified and mitigated. The systems engineer works closely with the project manager in tailoring the generic life cycle, including key decision gates, to meet the needs of their specific project. Per ISO/IEC 15288:2008:
5.2.2 – Life cycles vary according to the nature, purpose, use and prevailing circumstances of the system. Each stage has a distinct purpose and contribution to the whole life cycle and is conserved when planning and executing the system life cycle. … The stages thus provide organizations with a framework within which organization management has high-level visibility and control of project and Technical Processes.
Every system life cycle consists of the business aspect (business case), the budget aspect (funding), and the technical aspect (product). The systems engineer creates technical solutions that are consistent with the business case and the funding constraints. System integrity requires that these three aspects are in balance and given equal emphasis at all decision gate reviews.
The Vee model provides a useful illustration of the SE activities during the lifecycle stages. In the Vee model, time and system maturity proceed from left to right. The core of the Vee (i.e., those products that have been placed under configuration control) depicts the evolving baseline from user requirements agreement to identification of a system concept to definition of elements that will comprise the final system. With time moving to the right and with the system maturity shown vertically, the evolving baseline defines the left side of the core of the Vee. As entities are constructed, verified and integrated, the right side of the core of the Vee is executed. Since one can never go backward in time, all iterations in the Vee are
performed on the vertical “time now” line. Upward iterations involve the stakeholders and are the in-process validation activities that ensure that the proposed baselines are acceptable. The downward vertical iterations are the essential off-core opportunity and risk management investigations and actions. In each stage of the system life cycle, the SE processes iterate to ensure that a concept or design is feasible and that the stakeholders remain supportive of the solution as it evolves.
For the Dallas ICM Demonstration project, an Incremental and Iterative Development process will be used. Incremental and iterative development (IID) methods have been in use since the 1960s. They represent a practical and useful approach that allows a project to provide an initial capability followed by successive deliveries to reach the desired system-of-interest. The goal is to provide rapid value and responsiveness. This approach is generally presented in opposition to the perceived burden associated with using any process.
3. The Systems Engineering Process
U.S. Department of Transportation, Research and Innovative Technology Administration Intelligent Transportation System Joint Program Office
Report Title – Draft
|
133.3.1 Structured Analysis and Design Methodology
The requirements analysis and design will utilize a Structured Analysis and Design
Methodology. Structured Analysis (SA) and its allied technique, Structured Design (SD), are methods for analyzing and converting business requirements into specifications and
ultimately, computer programs, hardware configurations and related manual procedures. Structured Analysis views a system from the perspective of the data flowing through it. The function of the system is described by processes that transform the data flows. Structured analysis takes advantage of information hiding through successive decomposition (or top down) analysis. This allows attention to be focused on pertinent details and avoids confusion from looking at many irrelevant details. As the level of detail increases, the breadth of
information is reduced. The result of structured analysis is a set of related graphical
diagrams, process descriptions, and data definitions. They describe the transformations that need to take place and the data required to meet a system's functional requirements. The structured analyses approach develops perspectives on both process objects and data objects.
Our approach to structured analysis and design includes:
Context diagram
dataflow diagrams, and
A data dictionary.Hereby the Data flow diagrams (DFDs) are directed graphs. The arrows represent data, and the rounded rectangles represent processes that transform the data. A process can be further decomposed to a more detailed DFD which shows the sub processes and data flows within it. The sub processes can in turn be decomposed further with another set of DFDs until their functions can be easily understood. The DFDs model the structure of the system as a network of interconnected processes composed of functional primitives. The data dictionary is a set of entries (definitions) of data flows, data elements, files, and data bases. The data dictionary is partitioned in a top down manner. They can be referenced in other data dictionary entries and in data flow diagrams.
3.3.2 Context diagram
The Context diagrams are diagrams that represent the actors outside a system that could interact with that system. This diagram is the highest level view of a system, similar to Block Diagram, showing a, possibly software-based, system as a whole and its inputs and outputs from/to external actors.
This type of diagram pictures the system at the center, with no details of its interior structure, surrounded by all its interacting systems, environment and activities. The objective of a system context diagram is to focus attention on external actors and events that should be considered in developing a complete set of system requirements and constraints. System context diagrams are related to Data Flow Diagrams, and show the interactions between a
3. The Systems Engineering Process
U.S. Department of Transportation, Research and Innovative Technology Administration Intelligent Transportation System Joint Program Office
Report Title – Draft
|
14system and other actors with which the system is designed to face. System context diagrams can be helpful in understanding the context in which the system will be part of software engineering.
3.3.3 Data dictionary
A data dictionary or database dictionary is a file that defines the basic organization of a database. A database dictionary contains a list of all files in the database, the number of records in each file, and the names and types of each data field. Most database
management systems keep the data dictionary hidden from users to prevent them from accidentally destroying its contents. Data dictionaries do not contain any actual data from the database, only book keeping information for managing it. Without a data dictionary, however, a database management system cannot access data from the database.
Database users and application developers can benefit from an authoritative data dictionary document that catalogs the organization, contents, and conventions of one or more
databases. This typically includes the names and descriptions of various tables and fields in each database, plus additional details, like the type and length of each data element. There is no universal standard as to the level of detail in such a document, but it is primarily a distillation of metadata about database structure, not the data itself. A data dictionary document also may include further information describing how data elements are encoded. One of the advantages of well-designed data dictionary documentation is that it helps to establish consistency throughout a complex database, or across a large collection of federated databases.
3.3.4 Data Flow Diagrams
A Data Flow Diagram (DFD) is a graphical representation of the "flow" of data through an information system. It differs from the system flowchart as it shows the flow of data through processes instead of hardware.
It is common practice to draw a System Context Diagram first which shows the interaction between the system and outside entities. The subsequent DFDs are designed to show how a system is divided into smaller portions and to highlight the flow of data between those parts. This context-level Data flow diagram is then "exploded" to show more detail of the system being modeled.
The project stakeholders will be briefed and consulted throughout all stages of a system's evolution. With a dataflow diagram, stakeholders are able to visualize how the system will operate, what the system will accomplish, and how the system will be implemented. Dataflow diagrams can be used to provide the end user with a physical idea of where the data they input ultimately has an effect upon the structure of the whole system. How any system is developed can be determined through a dataflow diagram.
3. The Systems Engineering Process
U.S. Department of Transportation, Research and Innovative Technology Administration Intelligent Transportation System Joint Program Office
Report Title – Draft
|
15 Gane Sarson DFDsData Flow Diagrams (DFDs) for the Dallas ICM project will utilize a Gane Sarson DFD diagramming standard. DFDs show the flow of data from external entities into the system, showed how the data moved from one process to another, as well as its logical storage. The figure below presents an example of a DFD using the Gane and Sarson notation. There are only four symbols:
Squares representing external entities, which are sources or destinations of data.
Rounded rectangles representing processes, which take data as input, do something to it, and output it.
Arrows representing the data flows, which can either be electronic data or physical items.
Open-ended rectangles representing data stores, including electronic stores such as databases or XML files and physical stores such as or filing cabinets or stacks of paper.There are several common modeling rules that will be followed when creating DFDs: 1. All processes must have at least one data flow in and one data flow out.
2. All processes should modify the incoming data, producing new forms of outgoing data.
3. Each data store must be involved with at least one data flow. 4. Each external entity must be involved with at least one data flow. 5. A data flow must be attached to at least one process.
6. Data is conserved (neither created nor destroyed) within the DFDs
3.3.5 Structure Chart
A Structure Chart (SC) is a chart shows the breakdown of the configuration system to the lowest manageable levels. This chart is used in structured programming to arrange the program modules in a tree structure. Each module is represented by a box which contains the name of the modules. The tree structure visualizes the relationships between the modules.
In structured analysis, structure charts are used to specify the high-level design, or
3. The Systems Engineering Process
U.S. Department of Transportation, Research and Innovative Technology Administration Intelligent Transportation System Joint Program Office
Report Title – Draft
|
16and conquering a large software problem, that is, recursively breaking a problem down into parts that are small enough to be understood by a human brain. The process is called top-down design, or functional decomposition. Programmers use a structure chart to build a program in a manner similar to how an architect uses a blueprint to build a house. In the design stage, the chart is drawn and used as a way for the client and the various software designers to communicate. During the actual building of the program (implementation), the chart is continually referred to as the master-plan.
3.3.6 Structured Design
Structured Design (SD) is concerned with the development of modules and the synthesis of these modules in a so called "module hierarchy". In order to design optimal module structure and interfaces two principles are crucial:
Cohesion which is "concerned with the grouping of functionally related processes into a particular module", and
Coupling relates to "the flow of information, or parameters, passed between modules. Optimal coupling reduces the interfaces of modules and the resulting complexity of the software".The structure chart aims to "shows the module hierarchy or calling sequence relationship of modules. There is a module specification for each module shown on the structure chart. The module specifications can be composed of pseudo-code or a program design language. The data dictionary is like that of structured analysis. At this stage in the software development lifecycle, after analysis and design have been performed, it is possible to automatically generate data type declarations", and procedure or subroutine templates.
3.3.7 Requirements Analysis
Once the problem has been clearly stated as a set of stakeholder (user) needs, the next step is to define a solution or set of solutions, and pick the optimal ones. The project
engineering team will perform requirements analysis for the purpose of establishing what the system will be capable of accomplishing; how well system products will operate; the
human/system interface requirements; the physical/aesthetic characteristics; and constraints that affect design solutions. The User Needs, System Requirements, and constraints are derived from stakeholder expectation, project and enterprise constraints; external
constraints, and high-level system requirements.
3.3.8 Relationship to the ITS Regional Architecture
The Regional Architecture and ITS Plan for the Dallas-Fort Worth was defined in 1999. The Regional Architecture was updated in 2004 and 2005 and posted to the regional ITS web site (http://nortex-its.org/Architecture/ArchHome.htm). The Dallas Area ITS Plan is currently being updated. The goals and strategies for the Regional ITS Architecture is very similar to the strategies and integration needed for the US-75 Integrated Corridor Management System.
3. The Systems Engineering Process
U.S. Department of Transportation, Research and Innovative Technology Administration Intelligent Transportation System Joint Program Office
Report Title – Draft
|
17The 1999 ITS Plan Regional Goals were defined as:
1. Enhance mobility of people and goods by reducing recurrent traffic congestion 2. Enhance mobility of people and goods by reducing traffic congestion caused by
incidents
3. Enhance access and operation of high-occupancy modes of travel 4. Reduce drive-alone and peak period travel
5. Provide a safe transportation system
6. Provide increased opportunities for air quality and other environmental improvements
Similarly, the Goals for the US-75 ICM, as discussed in Section 4 below: 1. Increase corridor throughput
2. Improve travel time reliability 3. Improved incident management 4. Enable intermodal travel decisions
Market Packages
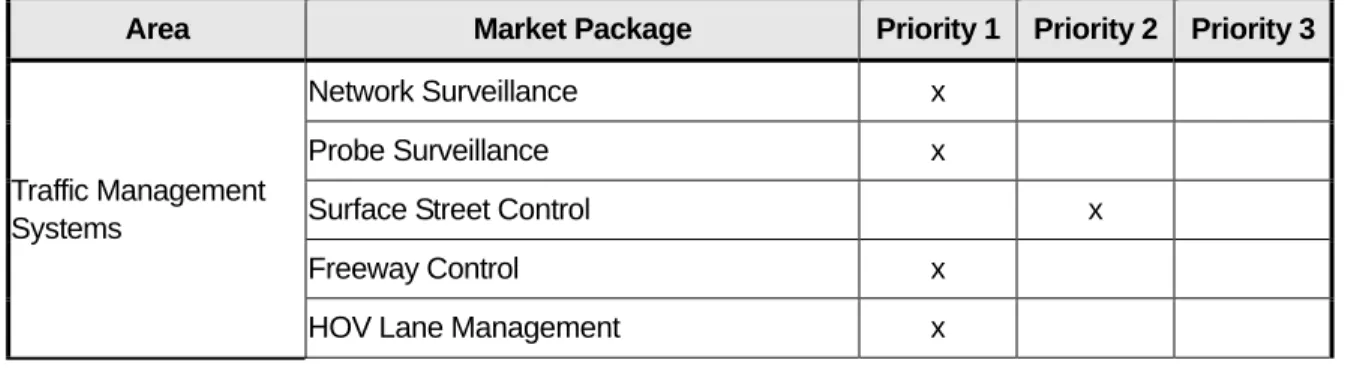
In addition, many of the strategies that the US-75 Steering Committee discussed are captured in many of the Market Packages described in the Dallas-Fort Worth Regional ITS Architecture. A sequence of projects is one of the required components of the regional ITS architecture. In order to meet this requirement, the Dallas-Fort Worth region has developed a sequence of market packages. Each market package priority was determined based on the regional ITS initiatives outlined in existing ITS documents and through consensus building of the Regional ITS Steering Committee. These initiatives include reducing the impacts of recurring and non-recurring congestion; improvements to the overall safety of the transportation system; enhance access and operation of high occupancy modes of travel; and the dependency of one market package on the deployment of another market package. Table 3-1 below summarizes the market package prioritization in the Dallas-Fort Worth region adopted in February 2005.
Table 3-1. Summary of Market Package Priorities for the DFW Regional ITS Architecture
Area Market Package Priority 1 Priority 2 Priority 3
Traffic Management Systems
Network Surveillance x
Probe Surveillance x
Surface Street Control x
Freeway Control x
3. The Systems Engineering Process
U.S. Department of Transportation, Research and Innovative Technology Administration Intelligent Transportation System Joint Program Office
Report Title – Draft
|
18Area Market Package Priority 1 Priority 2 Priority 3
Traffic Information Dissemination x
Regional Traffic Control x
Traffic Incident Management System x
Electronic Toll Collection x
Emissions Monitoring and Management x
Standard Railroad Grade Crossing x
Railroad Operations Coordination x
Parking Facility Management x
Regional Parking Management x
Reversible Lane Management x
Speed Monitoring x
Roadway Closure Management x
Emergency Management
Emergency Call-Taking and Dispatch x
Emergency Routing x
Mayday Support x
Roadway Service Patrols x
Transportation Infrastructure Protection x
Wide-Area Alert x
Early Warning System x
Disaster Response and Recovery x
Evacuation and Reentry Management x
Disaster Traveler Information x
Maintenance and Construction
Road Weather Data Collection x
Weather Information Processing and
Distribution x
Winter Maintenance x
Roadway Maintenance and Construction x
Work Zone Management x
Work Zone Safety Monitoring x
Maintenance and Construction Activity
3. The Systems Engineering Process
U.S. Department of Transportation, Research and Innovative Technology Administration Intelligent Transportation System Joint Program Office
Report Title – Draft
|
19Area Market Package Priority 1 Priority 2 Priority 3
Public Transportation
Transit Vehicle Tracking x
Transit Fixed-Route Operations x
Demand Response Transit Operations x
Transit Passenger and Fare Management x
Transit Security x
Transit Maintenance x
Multi-modal Coordination x
Transit Traveler Information x
Commercial Vehicle
Operations HAZMAT Management x
Traveler Information
Broadcast Traveler Information x
Interactive Traveler Information x
Archived Data ITS Data Mart x
ITS Data Warehouse x
Other Deployment Considerations
Fill gaps in the existing ITS communications infrastructure by completing critical system linkages
Leverage transportation resources by targeting investment, where possible, to facilities undergoing reconstruction
Leverage transportation resources by creating or enhancing public/private partnerships which will provide communications infrastructure for regional ITS
Provides transportation service or transportation data that is regional in scope.3.3.9 User Needs and Functional Breakdown
The first step in the development of detailed requirements for the ICM Demonstration is to identify the needs and goals and potential solutions that could be implemented under the constraints of the Demonstration Project. The constraints of the project include the high-level requirements developed and agreed by the US DOT as part of our proposal, the schedule (24 months for design, development, integration), and the project budget approved for the demonstration project. The User Needs were developed during the Concept of Operations (ConOps) phase of the ICM program, and have been updated and verified with
3. The Systems Engineering Process
U.S. Department of Transportation, Research and Innovative Technology Administration Intelligent Transportation System Joint Program Office
Report Title – Draft
|
20the project stakeholders. The User needs were further broken down into high-level requirements, and further broken into functional requirements.
3.3.10
Interface Standards
The engineering team will define the functional and design interfaces to external and/or high-level and interacting systems, platforms, humans, and/or products in quantitative terms. Mechanical, electrical, thermal, data, communication-procedural, human-machine, and other interfaces are included. The Dallas ICM demonstration architecture includes information that allows the engineering team to identify information flows between the project functions and subsystems. These will be defined as data flows for this project.
Data Flows – Data flows represent data flowing between processes within a system, or between a system subsystem and an external interface or between subsystems. As discussed in 3.3.4 above, Gane Sarson DFDs will be utilized by the engineering team to visualize the data flows between processes, between sub subsystems, between
subsystems, and between subsystems and external interfaces.
In the analysis process, the data flows are aggregated depending on the level of system decomposition. For example, data flows between subsystems and external systems will be shown on the Level 0 diagrams, data flows between subsubsystems will be shown on the Level 1 diagrams, and data flows between functions will be shown on the Level 2 diagrams. Further decomposition, if necessary, will further break down the functions into data elements and functions. As discussed above as part of the Structured Analysis process, a data dictionary will be maintained that maps and defines all the data names to their aggregate data flows.
3.3.11 Concept
of
Operations
The concept of operations (ConOps) developed during Stage 1 of the ICM program, will be made available to the engineering team during the system requirements, design, and
implementation phases. The role of the ConOps in the SEP is to describe how the delivered system will work in terms that stakeholders understand. The Concept of Operations will assist the engineering team in better understanding the User Needs of the stakeholders and the envisioned system.
3.4 Tracking Project Requirements and the Use of a
Database
A key characteristic of the SEP is the traceability of all requirements back to the User Needs. Further, requirements must be defined in a hierarchical manner. As discussed below, a Requirement Tracking database is utilized by the engineering team to track requirements from user needs through implementation.
3. The Systems Engineering Process
U.S. Department of Transportation, Research and Innovative Technology Administration Intelligent Transportation System Joint Program Office
Report Title – Draft
|
213.4.1 Functional Design Hierarchy
The systems considered in ISO/IEC 15288:2008 are man-made, created and utilized to provide products and/or services in defined environments for the benefit of users and other stakeholders. These systems may be configured with one or more of the following system elements: hardware, software, data, humans, procedures, facilities, materials and naturally occurring entities. In practice, they are thought of as products or services.
The perception and definition of a particular system, its architecture and its system elements depend on an observer’s interests and responsibilities. One person’s system of interest can be viewed as a system element (subsystem) in another person’s system of interest.
Furthermore, a system of interest can be viewed as being part of the environment operation for another person’s system of interest.
Hierarchies are system or organizational representations of a partitioning relationship where the entity (or system) is separated into smaller more manageable entities. The hierarchy is balanced with appropriate fan out and span of control. Appropriate fan out and span of control refers to the number of elements subordinate to each element in the hierarchy. For the Dallas ICM Demonstration project, a hierarchy has been defined as follows:
System Subsystem SubSubSystem Functions Elements
This generic system hierarchy ties: the system architecture; specification and drawing trees; work breakdown structure; technical reviews; and configuration baselines together. Many pieces within the system hierarchy can be considered a “system” by the classical definition, but actually represent subsystems within the system hierarchy. Note that the “ICMS” is the one system for this project; however, within the “system” the Decision Support Subsystem, SmartNET Subsystem, and SmartFusion subsystem could be considered “systems” from some stakeholders points of view.
Each subsystem may be composed of many functions, and elements. The focus of this SEP is to specify the system by its functional requirements. The functional requirements are developed in a hierarchal manner by defining the system level requirements, and then taking each requirement and decomposing it to the next lower level of functional decomposition. Requirements will be maintained and tracked throughout the project to ultimately prove that the system that is delivered and installed meets all the requirements. The Requirements will be maintained in a database and identified in a logical way to uniquely identify all requirements.
3.4.2 Design Verification
The Systems Engineering lead will be responsible for performing design verification to ensure that the design architecture’s lowest level requirements, including derived
3. The Systems Engineering Process
U.S. Department of Transportation, Research and Innovative Technology Administration Intelligent Transportation System Joint Program Office
Report Title – Draft
|
22requirements, are traceable to the verified functional architecture, and that the design architecture satisfies the validated requirements baseline.
At the design verification stage, the physical architecture is examined to determine if it satisfies all the requirements and constraints of the project. As discussed below, a
Requirements Database and Tracking tool will be utilized to support the manual mapping of the requirements hierarchy to the stakeholder needs.
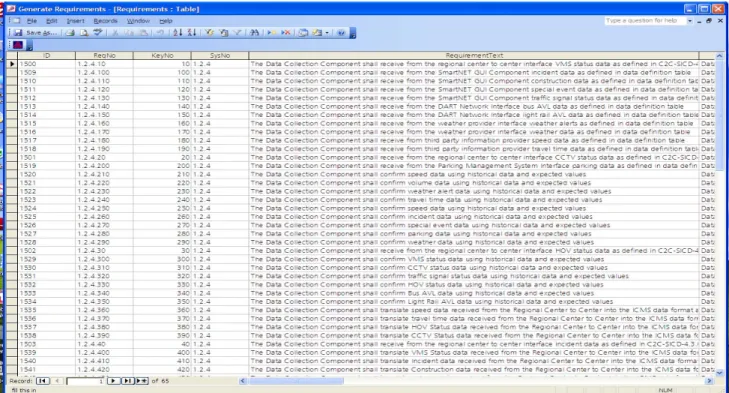
3.4.3 Requirements Database and Tracking Tool
A Microsoft Access database has been developed to track all requirements from User needs through implementation, as shown in Figures 2 and 3 below; the identification of
3. The Systems Engineering Process
U.S. Department of Transportation, Research and Innovative Technology Administration Intelligent Transportation System Joint Program Office
Report Title – Draft
|
23 Requirement Numbering Rules
System Requirements are 1.0.0.10 to 1.0.0.no
ICMS is 1.0.0.n
Subsystem Requirements are 1.1.0.10 to 1.X.0.no
Decisions Support Subsystem is 1.1.0.no
SmartFusion Subsystem is 1.2.0.no
SmartNET Subsystem is 1.3.0.n
SubSubSystem Requirements are 1.1.1.10 to 1.X.X.no
Expert Rules SubSubSystem is 1.1.1.no
Evaluation SubSubSystem is 1.1.2.no
Prediction SubSubSystem is 1.1.3.no
Plan Decision SubSubSystem is 1.2.1.no
Data Dissemination SubSubSystem is 1.2.2.no
Data Fusion SubSubSystem is 1.2.3.no
Data Collection SubSubSystem is 1.2.4.no
Data Store SubSubSystem is 1.2.5.no
Plan Decision Dialogue SubSubSystem is 1.3.1.no
SmartNET GUI SubSubSystem is 1.3.2.n
Data Element requirements would be children of SubSubSystem requirements 1.1.1.10.1 to 1.X.X.X.n
First number is 10 - 1.0.0.10 with increments of 10 - 1.0.0.20, 1.0.0.30, etcFigure 3-1. Requirements Input Form Figure 3-2. Requirements Database Table
3. The Systems Engineering Process
U.S. Department of Transportation, Research and Innovative Technology Administration Intelligent Transportation System Joint Program Office
Report Title – Draft
|
24 Types of Requirements
F = Functional
I = Interface (interface between ICMS and external systems)
D = Data (internal storage, exchange of data within the ICMS)
C = Constraint
P = Performance
H = HardwareVerification Method
Analysis = Analysis (Analysis is the use of established technical ormathematical models or simulations, algorithms, or other scientific principles and procedures to provide evidence that the item meets its stated
requirements.)
Inspect = Inspection (Inspection is observation using one or more of the five senses, simple physical manipulation, and mechanical and electrical gauging and measurement to verify that the item conforms to its specifiedrequirements.)
Demo = Demonstrate (Demonstration is the actual operation of an item to provide evidence that it accomplishes the required functions under specific scenarios.)
Test = Test (Test is the application of scientific principles and procedures to determine the properties or functional capabilities of items.)Requirement Criticality
H = High
M = Medium
L = LowAtomic Requirement Rules
The system requirements will follow the principles provided by US DOT for writing well-written requirements, which are well-formed, unambiguous, feasible, and verifiable. In addition, atomic requirement rules will be used. Every requirement should be a single requirement. If we can say “Half of this requirement is implemented” then this needs to be two or more requirements. If a requirement read “Sales reps can manage their client list and generate custom reports” it expresses two atomic ideas (list management and report
3. The Systems Engineering Process
U.S. Department of Transportation, Research and Innovative Technology Administration Intelligent Transportation System Joint Program Office
Report Title – Draft
|
25Rule 1: If you want to describe an action that has to be performed by the system alone, use:
Autonomous system action requirement :== The system <must | should | can> <verb> <object(s)>[, <if | as soon as> <all of | exactly one of | at least one of> the following conditions are true: <condition1>[, <condition2>]*]>
Notes:o
System action requirements define the solution space from the inside, i.e. they describe the area of valid solutions in positive terms.o
You indicate priority and/or obligation by choosing the respective auxiliary verb.o
You need to clearly define your strong verbs in a glossary. Usually you end up with 10-20 verbs you need throughout the spec.o
Logical conditions should be indicated by the keyword 'if', time conditions by 'as soon as'.o
Avoid 'when', because it is ambiguous.o
Conditions, especially if there are many, should be put at the end of the requirement, to establish a context first. You can put it in front of the action only if there's a single, simple condition.o
If there are complex conditions, do not hesitate to use some form of logical expressions. Just make sure you explain their use in the requirements management plan.Rule 2: If you want to describe a capability the system has to provide for some user, use:
User interaction requirement :== The system <shall> provide <whom> the capability to <verb> <object(s)>[, <if | as soon as> <all of | exactly one of | at least one of> the following condition(s) are true: <condition1>[,<condition2>]*]
Notes:o
See notes of Rule 1.o
Interaction requirements also define the solution space from the inside, i.e. they describe the area of valid solutions in positive terms.o
It's not valid to avoid the passive voice by making the object the subject in the above sentence structure (e.g. „The user must do X“), because the spec must describe what is required from the system, not from the user.Rule 3: If you want to describe a constraint, something the system mustn't do or allow, use …
Constraint requirement :== The system mustn't [<allow whom> to] <verb> [<object(s)>]
Notes:o
Constraint requirements limit solution space from the outside, i.e. they describe the area of valid solutions in negative terms.o
This negative character makes constrains hard to test, as you cannot see the absence of things in a system. In essence, you check whether the constraint3. The Systems Engineering Process
U.S. Department of Transportation, Research and Innovative Technology Administration Intelligent Transportation System Joint Program Office
Report Title – Draft
|
26(for example a legal constraint) is violated by the system or can be violated by a user using the system.
3.4.4 Requirement Assumptions and Dependencies
All Design, Development and Deployment needs to be done by December 2011
The Regional Center to Center information exchange system will be sufficient for the data exchange needs of the ICM
The Regional Center to Center information exchange system will be partially deployed
The Regional Data Warehouse will be utilized as appropriate
Communication links between all US 75 stakeholders are incomplete
Current deployed infrastructure and systems will be utilized
This is a research project, so some of the technology and systems deployed may need to be altered once operations has begun
Current and proposed infrastructure will be sufficient for the datarequirements of the ICM, and the real-time Decision Support Subsystem