GLUTEN-FREE: IS IT THE FUTURE?
An Undergraduate Research Scholars Thesis by
JOHN WILLIAM FAZZINO, JR.
Submitted to Honors and Undergraduate Research Texas A&M University
In partial fulfillment of the requirements for the designation as an
UNDERGRADUATE RESEARCH SCHOLAR
Approved by
Research Advisor Dr. Oral Capps, Jr.
April 2015
TABLE OF CONTENTS
Page ABSTRACT ...1 DEDICATION ...2 ACKNOWLEDGEMENTS ...3 CHAPTER I. INTRODUCTION ...4II. LITERATURE REVIEW ...7
III. METHODS ...11
IV. RESULTS ...18
Results for ENER-G Bread White Rice Loaf ...19
Results for Food For Life White Rice Gluten-Free Bread ...21
Results for Glutino Family Bag Pretzels ...23
Results for Enjoy Life Gluten-Free Double Chocolate Cookies ...25
Results for Schar Gluten-Free Crisp Bread ...27
V. CONCLUSION ...29
ABSTRACT
Gluten-Free: Is It the Future? (May 2014)
John William Fazzino Jr. Department of Agricultural Economics
Texas A&M University
Research Advisor: Dr. Oral Capps Jr. Department of Agricultural Economics
The purpose of this thesis is to examine the rapidly growing gluten-free food market. We will attempt to better understand the impacts on traditional economic factors on gluten-free products as well as to better understand the health and nutritional benefits of a gluten-free diet.
Based on data received from the Kilts Center for Marketing at the University of Chicago Booth School of Business, we will be able to study consumers purchasing habits regarding five unique gluten-free products from four food categories. These data will provide insight as to how the demand for these gluten-free products has changed over time and will give us the ability to make future predictions. Another aspect of this research will focus on the health and nutritional characteristics in regard to maintaining a gluten-free diet.
DEDICATION
This undergraduate research thesis is dedicated to my parents John and Roann Fazzino and my sister Jennifer, who have always encouraged me to strive to become the best individual I can be through all walks of life. Thank you for your unconditional love and support. I love you.
ACKNOWLEDGEMTS
I would also like to thank Dr. Oral Capps Jr., Loren Burns, Karina Farias, and all faculty and staff who work in the Agribusiness Food and Consumer Economics Research Center, who have pushed me to strive through hard work and determination in my studies and educational goals. Thank you for your support.
CHAPTER I
INTRODUCTION
The gluten-free market has recently become one of the most recognized markets in the food industry showing increases in annual sales growth, new products in both food and beverage categories, and awareness of gluten related illnesses. To be considered a gluten-free product, the Food and Drug Administration (FDA) states that a product must contain less than 20 ppm (parts per million) of gluten (FDA, 2013). In 2010, more than 12 percent of new products introduced into the food industry claimed to be gluten-free, showing significant growth compared to the 1 percent of new products introduced in 2001 (Economic Research Services, 2013). Gluten-free products also had the largest increase overall in products with Health and Nutrition Related (HNR) claims, 11 percent, during the 2001 to 2010 period (Martinez, 2013). Among products with HNR claims, gluten-free products were the top in annual sales growth (Martinez, 2013). Although these figures are evidence of an increasing demand for gluten-free products, it has yet to be determined whether gluten-free products will maintain growth in the future or will they end as a dietary fad.
Gluten is a protein found in grass-type grains including wheat, barley and rye. It is in many food products; largely breads, baked goods, cookies, and snack bars used to create the stretchy and/or sticky consistency that is common in these types of foods (What is Celiac Disease?). It primarily affects people suffering from Celiac disease, a genetic autoimmune disorder affecting nearly 1 in 133 people, and individuals suffering from gluten sensitivity; which amounts to more than 18 million people in the United States (SPINS, 2012). Gluten affects people suffering from these
illnesses by attacking and damaging the villi, a part of the small intestine, limiting the absorption of valuable nutrients into the bloodstream (What is Celiac Disease?). An individual suffering from a damaged villi has a greater risk of becoming malnourished or contracting autoimmune diseases including cancer, thyroid disease, osteoporosis or infertility (Celiac Disease Center, 2005). Some of the symptoms associated with gluten-related illnesses consist of diarrhea, abdominal pain, irritability, and depression (Celiac Disease Symptoms Can Be Elusive, n.d.). Although some individuals may experience some or all symptoms, individuals may not experience any of these symptoms making Celiac disease difficult for doctors to diagnose without the use of blood tests or tissue samples from the small intestine (Medline Plus, 2013). An individual is at a higher risk of developing Celiac disease (1 in 22) if a first-degree relative has Celiac disease, and (1 in 39) if a second-degree relative has Celiac disease (Celiac Disease Center, 2005).
Unfortunately, the only treatment for Celiac disease and/or gluten sensitivity is to maintain a diet free of gluten. Because consumers are becoming more educated about Celiac disease and gluten sensitivity, there is a higher demand for gluten-free products. Nearly 46 percent of consumers who purchase free products believe they are generally healthier after consuming gluten-free products (Martinez, 2013). Additionally, 30 percent of consumers believe gluten-gluten-free products will help with weight management, and 20 percent who believe gluten-free products are of higher quality than non-gluten-free products (Martinez, 2013).
Figure 1: Certified Gluten Free Categories: 2011 Versus 2010 Source: SPINS Gluten-Free: Trends Highlights
20M 61M 10M 17M 51M 94M 13M 22M 0 10 20 30 40 50 60 70 80 90 100
Bread & Baked Goods
Chips, Pretzels & Snacks
Cookies & Snack Bars Crackers & Crispbreads M illi on s of D oll ars
Certified Gluten Free Categories: 2011 Versus 2010
CHAPTER II
LITERATURE REVIEW
Previous studies have been performed on gluten-free products relating to data collection, product quality research, product manufacturing, and information concerning the health benefits of a gluten-free diet. However, to the best of our knowledge, there has not been a study performed addressing the impacts of traditional factors on gluten-free products. Since there has not been a study performed on gluten-free products, we will be looking at a similar market, organic food industry, and perform our research in a parallel manner.
Several studies have been performed detecting consumer and market economic trends to better understand certain food industries. These studies used various methods such as collecting data from surveys, collecting purchasing and demographic information, and datasets collected by third parties. Though studies have been performed on many food industries, we will be primarily basing the way we perform our study on previous studies performed on the organic food industry. The organic food industry is very similar in nature to the gluten-free industry, and as such, it is likely that consumer purchasing trends will be comparable. Most studies that we were able to find over the organic food industry were performed over a ten-year period. These studies showed a common trend, which was an increase in organic food production along with sales over various periods of time (Dettmann, 2007). These studies also discovered a common consumer profile. This profile consists of younger households which women do most of the shopping, along with consumers that fall either in the upper or lower income bracket (Dettmann, 2007). Our hypothesis is that the gluten-free industry will continue to grow steadily in all food
categories, and become a large part of the food sector in the future. We believe the data provided to us will detect a trend comparable to the organic food industry research.
By observing previous studies, we find the basis for how we will perform our research. In a study performed by Carolyn Dimitri and Catherine Greene, data was collected by the Heartman Group, which gave them access to consumers purchasing habits collected from 40,000 households nationwide, econometric analysis using scanner data from the Glaser and Thompson study, and various different types of consumer surveys (Dimitri, 2000). With this data they were able to perform sample statistics and regression analysis tests to compare sales and aid in making future predictions of the organic food industry (Dimitri, 2000). With the data Dimitri and Greene collected, they were able to compare different food categories such as organic fresh fruits, fresh vegetables, grains, oilseeds, and legumes, processed foods, organic dairy products, and meat poultry and eggs (Dimitri, 2000). There results showed a steady increase in production and sales over various periods of time depending on food category.
Another study that appeared in Choices Magazine, showed a similar approach. The authors of the article used Nielsen Homescan panel data collected by purchases of Uniform Product Codes (UPC) food items along with non-packaged food items for the years 2001 and 2004 (Stevens-Garmon 109-116). These data gave them access to nearly 8,100 households in 2001, and 8,400 households in 2004 (Stevens-Garmon 109-116). Participants in the study were required to scan UPC food items and weigh non-packaged food items under specific codes depending on food types. The results were recorded weekly by the participants. After receiving the data, the authors were able to distinguish a trend based on purchasing habits. In all organic food
categories, the amount of food purchased in 2004 was much higher than the amount spent in 2001 showing increases in both production and sales (Stevens-Garmon 109-116).
Additionally, Rachael Dettmann and Carolyn Dimity used a similar approach but wanted to seek a different outcome. They used the same Nielsen Homescan panel data mentioned earlier from 2004. With these data, they wanted to try and pinpoint an exact consumer profile. They were able to detect a consumer profile that would be most likely to buy organic food, primarily vegetables (Dettmann, 2007). Even though we are not trying to detect a consumer profile for gluten-free products, it can be done with the data we have. The main focus of our study is to detect the conventional economic factors likely to impact the purchase of gluten-free foods over a period of time, and predict its future roles in the food sector.
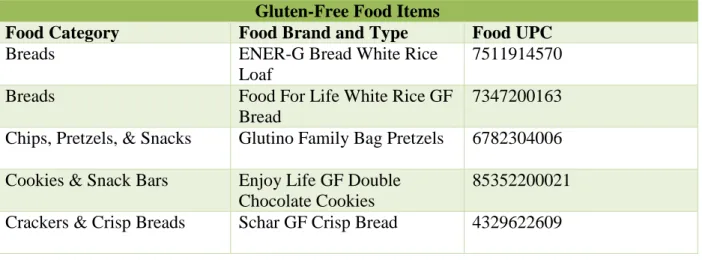
We will ascertain the impacts of economic factors on selected gluten free products and attempt to predict future sales in the food industry. We will employ data from the Kilts Center and focus our attention on five gluten-free products. The Kilts Center consumer panel data provides data collected from 40,000 to 60,000 households in U.S. markets in addition to data from retail scanners from 35,000 U.S. retail stores. These data were collected by recording data from UPC food items from households across the U.S. We will examine five gluten-free products, two specialty breads (ENER-G Bread, and FOOD FOR LIFE Bread), Pretzels (Glutino Family Bag Pretzels), cookies (Enjoy Life GF Double Chocolate Cookies), and crisp bread (Schar GF Crisp Bread) which are five gluten-free products that have been in existence for the length of the time our data set covers. These food items are listed below in Table 1. After examining these products we will be able to predict which of these products presents the best opportunities to
increase sales and amplify growth. These products also correspond to the gluten-free categories exhibited in Figure 1.
Table 1: Gluten-Free Food Items
Gluten-Free Food Items
Food Category Food Brand and Type Food UPC
Breads ENER-G Bread White Rice
Loaf
7511914570
Breads Food For Life White Rice GF
Bread
7347200163 Chips, Pretzels, & Snacks Glutino Family Bag Pretzels 6782304006 Cookies & Snack Bars Enjoy Life GF Double
Chocolate Cookies
85352200021 Crackers & Crisp Breads Schar GF Crisp Bread 4329622609
CHAPTER III
METHODOLOGY
Weekly data from calendar years 2006 to 2011 were purchased from the Kilts Center for Marketing, which will be used to conduct this study. These data will provide us with the most recent data available and gave us information on the five gluten-free products we have chosen to study on a weekly basis. These data were collected by the Kilts Center and included data from approximately 35,000 stores nationwide. The stores used in this study consisted of grocery, drug, mass merchandisers, and other types of stores. Data collected consisted of various categories such as food items, non-food grocery items, health and beauty aids, and select general merchandise. These data were collected and broken down into various categories by the Kilts Center and show place of purchase, units sold per week, dollar sales volume sold (in ounces), and weighted average unit prices.
We will use these data to research five specific UPC’s that are gluten-free mentioned earlier. We chose food items from four different food categories consisting of breads, chips and pretzels, chokies and snack bars, and crackers and crisp breads. The items we selected were present in all six years of data provided by the Kilts Center.
Upon selecting the UPC’s that we will use in our study we will be able transpose this data into SAS and perform regressions analysis. While in SAS we entertain conventional economic variables to ascertain their impact on the sales of the five aforementioned gluten-free products. These variables consist of the price of the selected gluten-free products, disposable personal
income (DPI), population, habit persistence, seasonality, and inflation. It is important to know which factors are statistically significant to help understand the drivers that affect the sales of the five gluten-free products, and to help forecast how much gluten-free products manufactures will need to produce in the future to meet demand. Table 2 shows the hypothesized explanatory variables on the respective gluten-free products.
Table 2: Variables
Variables We Will Be Testing Price of our Gluten-Free Products
Disposable Personal Income Habit Persistence
Population Seasonality Inflation
The methodological tool of choice in this instance is econometric or regression analysis. Regression analysis is a statistical tool for understanding the relationship among two or more variables. Variables in econometric analyses often are quantitative measures like price or quantity, common variables in the field of economics. Variables also may be qualitative in nature to represent events such as seasonal sales fluctuations.
Regression analysis involves the relationship between a variable to be explained, known as the “dependent variable” and additional variables that are thought to be associated with the dependent variable, known as the “explanatory” variables. An “error term,” which represents all other factors not accounted for by the set of explanatory variables, also is a fundamental
component of the regression model. Regression analysis is a scientifically-accepted methodology used to isolate whether a particular relationship exists between the dependent and explanatory variables and for measuring magnitude of this relationship while controlling for other factors that could also influence the dependent variable.
The model we will use for our demand analysis is shown as follows. This model will provide us with the information needed to determine the factors affect the demand of the five gluten-free products.
Demand Function: lnUnitst = ß0 + ß1lnPricet +ß2lnDPIt + ß3lnHPt+ ß4lnPopt + ß5Jant + ß6Febt +
ß7Mart + ß8Aprt + ß9Mayt + ß10Junt + ß11Jult + ß12Augt + ß13Sept + ß14Octt + ß15Novt + u
Unitst = Number of units sold per weeks t
Pricet = Price of the respective Gluten-Free Product in weeks t
DPIt = RepresentsDisposable personal income in weeks t
HPt = RepresentsHabit Persistence in weeks t
Popt = Population in weeks t
Jant = Month indication for January
Febt = Month indication for February
Mart = Month indication for March
Mayt = Month indication for May
Junt = Month indication for June
Jult = Month indication for July
Augt = Month indication for August
Sept = Month indication for September
Octt = Month indication for October
Novt = Month indication for November
u = Error term
H0 and H1 are represented as t-tests with the null hypothesis H0: bi= 0, i= 1,2,…, where if the
explanatory factor is statistically significant, then we reject H0.
H0: b1 = 0
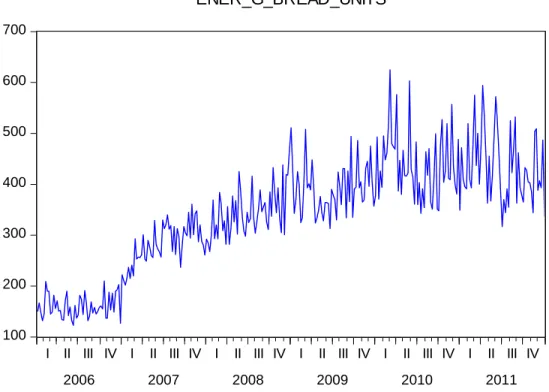
These data provided by the Kilts Center reflected consumer purchasing data over a 312 week span from January 2006-2011. In the figures shown below one can see an upward trend for most of the gluten-free products selected. These figures provide evidence that the sales of most gluten-free products increased over the time period 2006-2011. Figure 2 represents the units sold per week for ENER-G Bread White Rice Loaf. Figure 3 represents the units sold per week for Food For Life White Rice Gluten-Free Bread. Figure 4 represents the units sold per week for Glutino Family Bag Pretzels, Figure 5 represents the units sold per week for Enjoy Life Gluten-Free Double Chocolate Cookies. Lastly, Figure 6 represents Schar Gluten-Free Crisp Bread.
100 200 300 400 500 600 700
I II III IV I II III IV I II III IV I II III IV I II III IV I II III IV
2006 2007 2008 2009 2010 2011
ENER_G_BREAD_UNITS
Figure 2: Graph of ENER-G Bread White Rice Loaf—Number of Units Sold
50 100 150 200 250 300 350 400
I II III IV I II III IV I II III IV I II III IV I II III IV I II III IV
2006 2007 2008 2009 2010 2011
FFL_BREAD_UNITS
0 200 400 600 800 1,000 1,200 1,400
I II III IV I II III IV I II III IV I II III IV I II III IV I II III IV
2006 2007 2008 2009 2010 2011
PRETZELS_UNITS
Figure 4: Graph of Glutino Family Bag Pretzels—Number of Units Sold
0 100 200 300 400 500 600
I II III IV I II III IV I II III IV I II III IV I II III IV I II III IV
2006 2007 2008 2009 2010 2011
ENJOY_LIFE_UNITS
0 20 40 60 80 100 120 140
I II III IV I II III IV I II III IV I II III IV I II III IV I II III IV
2006 2007 2008 2009 2010 2011
CRACKERS_UNITS
CHAPTER IV
RESULTS
As mentioned previously, we used an econometric computer program called SAS to help perform our regression analyses on the data set provided by the Kilts Center. By using SAS we were able to perform these regressions in a timely manner, with precision and accuracy. The numeric models for the gluten-free products were estimated by ordinary least squares (OLS). The OLS estimates allow the identification of the drivers for the five gluten-free products. By running the regression threw SAS we were able to run all the independent variables for each product together making it fitting for our study.
These data reflect information regarding analysis on the five gluten-free products we chose for our study by comparing consumer purchasing data over a 312 week span from January 2006 to December 2011. We focused on the p-value, R-squared value, the adjusted R-squared value, and five independent variables. The set of independent variables consist of the price of respective gluten-free products, DPI, population, habit persistence, and seasonality. The R-squared value is a goodness-of-fit measure. It relates the amount of variability of units sold explained by the set of explanatory variables. The adjusted R-squared measures the proportion of the variation in the dependent variable accounted for by the explanatory variables, adjusted for degrees-of –freedom and sample size. The p-values for each of the independent variables are used to identify independent variables that are considered to be statistically significant. If the p-value of an independent variable is below 0.05, it is considered statistically significant for this study. If an independent variable is considered to be significant, we can than determine the effects it would
have on the number of ounces sold for that product. The nexte section deals with the results of our study.
Results for ENER-G Bread White Rice Loaf:
By looking at the data shown below for ENER-G Bread White Rice Loaf generated by SAS we are able to determine the key drivers to be price, habit persistence, and population. Over the 312 weeks of data we found an average sale of 341.70 units of ENER-G Bread White Rice Loaf sold per week, at an average price of $4.51 per unit. The R-Square generated for ENER-G Bread White Rice Loaf is shown to be 0.8396, which means 83.96% of the number of units sold is explained by our regression analysis. Based on the R-squared value, we can conclude that this model provides a very good fit to the data set. The Adjusted R-Square for this regression, is shown to be 0.8315, which means 83.15% of the variation in the dependent variable is accounted for by the explanatory variables.
The independent variables we found to be significant for ENER-G Bread White Rice Loaf were price, habit persistence, and population. By looking at the coefficient value we can determine that a change in price by 1% results in a 0.93% change in the number of units of ENER-G Bread White Rice Loaf sold. The coefficient shown for habit persistence displayed a value of 0.5412 meaning that last week’s purchases ENER-G Bread White Rice Loaf affect purchases of the product this week. The coefficient shown for population was 10.2204. A 1% change in population results in a 10.22% change in units sold. We did find that the month of May did show a bit of seasonality represented by a coefficient of 0.1288. This coefficient means that a consumer is more likely to purchase ENER-G Bread White Rice Loaf by 12.88% in the month of
May over the reference month December. All coefficients for the seasonal dummy variables are positive meaning that purchases of ENER-G Bread White Rice Loaf are higher in all months relative to December. In Table 3 below, we report our regression results from SAS for ENER-G Bread White Rice Loaf. In this table one can see the p-values for our independent variables, along with the R-squared value and adjusted R-squared value.
Table 3: Regression Equation for ENER-G Bread White Rice Loaf:
UPC 7511914570
Dependent Variable: LOG(ENER_G_BREAD_UNITS) Method: Least Squares
Date: 04/08/15 Time: 07:16
Sample (adjusted): 1/14/2006 12/31/2011 Included observations: 312 after adjustments
Variable Coefficient Std. Error t-Statistic Prob.
C -110.1067 15.62390 -7.047324 0.0000 LOG(ENER_G_BREAD_PRICE*100/CPI) -0.926678 0.341622 -2.712582 0.0071 LOG(INF_ADJ_DPI) -1.521426 0.984273 -1.545736 0.1232 LOG(ENER_G_BREAD_UNITS(-1)) 0.541237 0.048473 11.16585 0.0000 LOG(POP) 10.22043 1.606049 6.363708 0.0000 JAN 0.082673 0.042457 1.947209 0.0525 FEB 0.088668 0.044643 1.986140 0.0479 MAR 0.083618 0.044119 1.895309 0.0590 APR 0.064299 0.042713 1.505362 0.1333 MAY 0.128765 0.043101 2.987509 0.0030 JUN 0.038005 0.042940 0.885066 0.3768 JUL 0.031461 0.042043 0.748317 0.4549 AUG 0.043690 0.042971 1.016742 0.3101 SEP 0.016250 0.042655 0.380972 0.7035 OCT 0.035548 0.042618 0.834115 0.4049 NOV 0.075182 0.042835 1.755172 0.0803
R-squared 0.839584 Mean dependent var 5.773631
Adjusted R-squared 0.831455 S.D. dependent var 0.374424
S.E. of regression 0.153717 Akaike info criterion -0.857487
Sum squared resid 6.994154 Schwarz criterion -0.665538
Log likelihood 149.7680 Hannan-Quinn criter. -0.780771
F-statistic 103.2803 Durbin-Watson stat 2.256215
Results for Food For Life White Rice Gluten-Free Bread:
By looking at the data shown below for Food For Life White Rice Gluten-Free Bread generated by SAS we are able to determine that habit persistence is the only significant variable for this product. Over the 312 weeks of data we found an average sale of 189.5463 units of Food For Life White Rice Gluten-Free Bread sold per week, at an average price of $4.71 per unit. The R-squared generated for Food For Life White Rice Gluten-Free Bread is shown to be 0.5774, which means 57.74% of the number of units sold is explained by our regression analysis. Based on the R-squared value, we can conclude that this model does not provide a very good fit to the data set. The adjusted R-squared for this regression, is shown to be 0.5559, which means 55.59% of the variation in the dependent variable is accounted for by the explanatory variables.
The independent variable we found to be significant for Food For Life White Rice Gluten-Free Bread was habit persistence. The coefficient shown for habit persistence displayed a value of 0.7364, meaning that last week purchases of Food For Life White Rice Gluten-Free Bread affect purchases of the product this week. We did find that the months of July and November did show a slight trend of seasonality represented by a coefficient of 0.0928 and 0.1300 respectively. These coefficient means that a consumer is more likely to purchase Food For Life White Rice Gluten-Free Bread by 9.28% in the month of July and 13.00% in the month of November over the reference month December. All coefficients for the seasonal dummy variables are positive meaning that purchases of Food For Life White Rice are higher in all months relative to December. In Table 4 below, we report our regression results. In this table one can see the p-values for our independent variables, along with the R-squared value and adjusted R-squared value.
Table 4: Regression Equation for Food For Life White Rice Gluten-Free Bread:
UPC 7347200163
Dependent Variable: LOG(FFL_BREAD_UNITS) Method: Least Squares
Date: 04/08/15 Time: 06:59
Sample (adjusted): 1/14/2006 12/31/2011 Included observations: 312 after adjustments
Variable Coefficient Std. Error t-Statistic Prob.
C -9.281989 9.064034 -1.024046 0.3066 LOG(FFL_BREAD_PRICEPERUNIT*100/CPI ) -0.024463 0.132790 -0.184220 0.8540 LOG(INF_ADJ_DPI) -0.214491 1.080973 -0.198425 0.8428 LOG(FFL_BREAD_UNITS(-1)) 0.736434 0.040329 18.26057 0.0000 LOG(POP) 1.006447 1.292927 0.778426 0.4369 JAN 0.033179 0.043818 0.757187 0.4495 FEB 0.054984 0.044855 1.225831 0.2212 MAR 0.069470 0.043895 1.582659 0.1146 APR 0.042581 0.043849 0.971082 0.3323 MAY 0.081312 0.044686 1.819633 0.0698 JUN 0.042910 0.044214 0.970511 0.3326 JUL 0.092826 0.043591 2.129494 0.0340 AUG 0.070774 0.044712 1.582895 0.1145 SEP 0.053709 0.044267 1.213276 0.2260 OCT 0.067595 0.043770 1.544327 0.1236 NOV 0.130006 0.044157 2.944180 0.0035
R-squared 0.577380 Mean dependent var 5.217023
Adjusted R-squared 0.555963 S.D. dependent var 0.237970
S.E. of regression 0.158574 Akaike info criterion -0.795268
Sum squared resid 7.443151 Schwarz criterion -0.603319
Log likelihood 140.0618 Hannan-Quinn criter. -0.718552
F-statistic 26.95949 Durbin-Watson stat 2.448124
Results for Glutino Family Bag Pretzels:
By looking at the data shown below for Glutino Family Bag Pretzels generated by SAS we are able to determine the key drivers to be price, habit persistence, and population. Over the 312 weeks of data we found an average sale of 565.81 units of Glutino Family Bag Pretzels sold per week, at an average price of $6.79 per unit. The R-squared generated for Glutino Family Bag Pretzels is shown to be 0.9536, which means 95.36% of the number of units sold is explained by our regression analysis. Based on the R-squared value, we can conclude that this model provides an excellent fit to the data set. The adjusted R-squared for this regression, is shown to be 0.9512, which means 95.12% of the variation in the dependent variable is accounted for by the explanatory variables.
The independent variables we found to be significant for Glutino Family Bag Pretzels were price, habit persistence, and population. By looking at the coefficient value we can determine that a change in price by 1% results in a 0.85% change in the number of units sold of Glutino Family Bag Pretzels sold. The coefficient shown for habit persistence displayed a value of 0.7958, meaning that last week purchases of Glutino Family Bag Pretzels affect purchases of the product this week. The coefficient shown for population was 9.46. A 1% change in population results in a 9.46 change in units sold of Glutino Family Bag Pretzels. We did find that the month of February did show slight seasonality represented by a coefficient of 0.0894. This coefficient means that a consumer is more likely to purchase Glutino Family Bag Pretzels by 8.94% in the month of February over the reference month December. All coefficients for the seasonal dummy varaiables are positive meaning that purchases of Glutino Family Bag Pretzels higher in all months relative to December. In Table 5 below, we report our regression results from SAS for
Glutino Family Bag Pretzels. In this table one can see the p-values for our independent variables, along with the R-squared value and adjusted R-squared value.
Table 5: Regression Equation for Glutino Family Bag Pretzels:
UPC 67852304006
Dependent Variable: LOG(PRETZELS_UNITS) Method: Least Squares
Date: 04/08/15 Time: 06:49
Sample (adjusted): 1/14/2006 12/31/2011 Included observations: 312 after adjustments
Variable Coefficient Std. Error t-Statistic Prob.
C -98.66303 18.03220 -5.471490 0.0000 LOG(PRETZELS_PRICEPERUNIT*100/CPI) -0.848517 0.344763 -2.461158 0.0144 LOG(INF_ADJ_DPI) -1.882362 1.082488 -1.738922 0.0831 LOG(PRETZELS_UNITS(-1)) 0.795826 0.029854 26.65694 0.0000 LOG(POP) 9.463582 1.905123 4.967440 0.0000 JAN -0.073651 0.044559 -1.652892 0.0994 FEB -0.089493 0.045444 -1.969284 0.0499 MAR -0.041945 0.044528 -0.941999 0.3470 APR -0.060123 0.044443 -1.352816 0.1771 MAY 0.044341 0.045009 0.985175 0.3253 JUN -0.056200 0.044741 -1.256128 0.2101 JUL -0.078974 0.044402 -1.778617 0.0763 AUG -0.066519 0.045961 -1.447283 0.1489 SEP -0.049263 0.044788 -1.099916 0.2723 OCT -0.045440 0.046636 -0.974359 0.3307 NOV -0.021643 0.044724 -0.483933 0.6288
R-squared 0.953595 Mean dependent var 6.140766
Adjusted R-squared 0.951243 S.D. dependent var 0.725565
S.E. of regression 0.160212 Akaike info criterion -0.774723
Sum squared resid 7.597649 Schwarz criterion -0.582774
Log likelihood 136.8568 Hannan-Quinn criter. -0.698007
F-statistic 405.5067 Durbin-Watson stat 2.569037
Results for Enjoy Life Gluten-Free Double Chocolate Cookies:
By looking at the data shown below for Enjoy Life Gluten-Free Double Chocolate Cookies generated by SAS we are able to determine the key drivers to be price, habit persistence, and population. Over the 312 weeks of data we found an average sale of 192.12 units of Enjoy Life Gluten-Free Double Chocolate Cookies sold per week, at an average price of $3.61 per unit. The R-squared generated for Enjoy Life Gluten-Free Double Chocolate Cookies is shown to be 0.8966, which means 89.66% of the number of units sold is explained by our regression analysis. Based on the R-squared value, we can conclude that this model provides an excellent fit to the data set. The adjusted R-squared for this regression, is shown to be 0.8913, which means 89.13% of the variation in the dependent variable is accounted for by the explanatory variables.
The independent variables we found to be significant for Enjoy Life Gluten-Free Double Chocolate Cookies were price, DPI, habit persistence, and population. By looking at the coefficient value we can determine that a change in price by 1% results in a 1.84% change in the number of units sold of Enjoy Life Gluten-Free Double Chocolate Cookies sold. DPI was also considered to be significant showing a p-value of 0.0453, and a coefficient of 2.15. This means that a change in DPI by 1% will cause a change in number of units sold by 2.15%. The coefficient shown for habit persistence displayed a value of 0.4451, meaning that last week purchases of Enjoy Life Gluten-Free Double Chocolate Cookies affect purchases of the product this week. The coefficient shown for population was 6.7028. A 1% change in population results in a 6.70% change in units sold. There were no months for this regression that showed seasonality. In Table 6 below, we report our regression results from SAS for Enjoy Life
Gluten-Free Double Chocolate Cookies. In this table one can see the p-values for our independent variables, along with the R-squared value and adjusted R-squared value.
Table 6: Regression Equation for Enjoy Life Gluten-Free Double Chocolate Cookies:
UPC 85352200021
Dependent Variable: LOG(ENJOY_LIFE_UNITS) Method: Least Squares
Date: 04/08/15 Time: 07:06
Sample (adjusted): 1/14/2006 12/31/2011 Included observations: 312 after adjustments
Variable Coefficient Std. Error t-Statistic Prob.
C -97.49961 16.17747 -6.026878 0.0000 LOG(ENJOY_LIFE_PRICEPERUNIT*100/CPI ) -1.839287 0.235507 -7.809914 0.0000 LOG(INF_ADJ_DPI) 2.153720 1.071321 2.010340 0.0453 LOG(ENJOY_LIFE_UNITS(-1)) 0.445127 0.045883 9.701429 0.0000 LOG(POP) 6.702789 1.589665 4.216479 0.0000 JAN -0.036736 0.046625 -0.787906 0.4314 FEB 0.072619 0.049765 1.459246 0.1456 MAR 0.023163 0.049565 0.467325 0.6406 APR 0.043590 0.047363 0.920336 0.3581 MAY 0.094814 0.049063 1.932494 0.0543 JUN 0.005938 0.047099 0.126066 0.8998 JUL 0.035697 0.045838 0.778766 0.4367 AUG 0.095449 0.048670 1.961127 0.0508 SEP 0.090887 0.048581 1.870830 0.0624 OCT 0.092734 0.047404 1.956256 0.0514 NOV -0.031125 0.046413 -0.670622 0.5030
R-squared 0.896569 Mean dependent var 5.136926
Adjusted R-squared 0.891327 S.D. dependent var 0.505777
S.E. of regression 0.166732 Akaike info criterion -0.694933
Sum squared resid 8.228707 Schwarz criterion -0.502984
Log likelihood 124.4096 Hannan-Quinn criter. -0.618217
F-statistic 171.0533 Durbin-Watson stat 1.960503
Results for Schar Gluten-Free Crisp Bread:
By looking at the data shown below for Schar Gluten-Free Crisp Bread generated by SAS we are able to determine the key drivers to be price, habit persistence, and population. Schar Gluten-Free Crisp Brad had missing information for some of the weeks in 2006. We were able to look at 264 weeks of data and found an average sale of 26.9966 units of Schar Gluten-Free Crisp Bread sold per week, at an average price of $5.71. The R-squared generated for Schar Gluten-Free Crisp Bread is shown to be 0.8587, which means 85.87% of the number of units sold is explained by our regression analysis. Based on the R-squared value, we can conclude that this model provides an excellent fit to the data set. The adjusted R-squared for this regression, is shown to be 0.8502, which means 85.02% of the variation in the dependent variable is accounted for by the explanatory variables.
The independent variables we found to be significant Schar Gluten-Free Crisp Bread were price, habit persistence, and population. By looking at the coefficient value we can determine that a change in price by 1% results in a 1.87% change in the number of units sold of Schar Gluten-Free Crisp Bread sold. The coefficient shown for habit persistence displayed a value of 0.3628, meaning that last week purchases of Schar Gluten-Free Crisp Bread affect purchases of the product this week. The coefficient shown for population was 28.2705. A 1% change in population results in a 28.27% chang in unts sold. There were no months for this regression that showed seasonality. In Table 7 below, we report our regression results from SAS for Schar Gluten-Free Crisp Bread. In this table one can see the p-values for our independent variables, along with the R-squared value and adjusted R-squared value.
Table 6: Regression Equation for Schar Gluten-Free Crisp Bread
UPC 4629622609
Dependent Variable: LOG(CRACKERS_UNITS) Method: Least Squares
Date: 04/08/15 Time: 07:16
Sample (adjusted): 12/16/2006 12/31/2011 Included observations: 264 after adjustments
Variable Coefficient Std. Error t-Statistic Prob.
C -398.1882 67.40037 -5.907804 0.0000 LOG(CRACKERS_PRICEPERUNIT*100/CPI) -1.865755 0.252860 -7.378606 0.0000 LOG(INF_ADJ_DPI) 6.083008 3.803091 1.599491 0.1110 LOG(CRACKERS_UNITS(-1)) 0.362778 0.057609 6.297254 0.0000 LOG(POP) 28.27053 6.414316 4.407411 0.0000 JAN -0.086573 0.159564 -0.542559 0.5879 FEB -0.070979 0.166015 -0.427548 0.6694 MAR -0.119406 0.161831 -0.737845 0.4613 APR -0.152283 0.163986 -0.928633 0.3540 MAY -0.112720 0.165733 -0.680128 0.4971 JUN 0.055536 0.163047 0.340615 0.7337 JUL -0.096759 0.160747 -0.601933 0.5478 AUG -0.207434 0.164046 -1.264493 0.2072 SEP 0.086292 0.164096 0.525863 0.5995 OCT 0.030427 0.160568 0.189495 0.8499 NOV -0.075889 0.163360 -0.464549 0.6427
R-squared 0.858734 Mean dependent var 2.585027
Adjusted R-squared 0.850189 S.D. dependent var 1.418939
S.E. of regression 0.549206 Akaike info criterion 1.698005
Sum squared resid 74.80350 Schwarz criterion 1.914729
Log likelihood -208.1366 Hannan-Quinn criter. 1.785091
F-statistic 100.5032 Durbin-Watson stat 2.232887
CHAPTER V
CONCLUSION
After viewing our results of the selected products one can see that the gluten-free industry was growing over the years 2006 to 2011. The tables and graphs showed an upward trend for most of our products for the years 2006 to 2011. Regression analysis is a very useful tool in helping to analyze and forecast the trend in units sold of gluten-free products. We were able to find three key independent variables that affected the majority of the gluten free products we selected to research. The three drivers that affected the majority of the units sold for our products were price, habit persistence, and population. Seasonality was evident in the purchase of some products but not for other. However, there is a limitation in our data due to the data set only covering the years 2006 to 2011 and not accounting for the years 2012 to 2015. However, we can replicate the results for other gluten-free products. Additional research can be performed to focuses on the profile of consumers who purchase gluten-free products.
After seeing our results and comparing them to Graph 1 from the SPINS data, we can conclude that for the years 2006 to 2011 gluten-free products showed growth, and that consumers showed interest in purchasing gluten-free products. We are not sure if this is caused by a better
knowledge of Celiacs disease and gluten intolerance or if consumers feel as if they are becoming healthier from eating gluten-free products.
REFERENCES
Celiac Disease Center. (2005). Celiac disease facts and figures . (Master's thesis)Retrieved from http://www.uchospitals.edu/pdf/uch_007937.pdf
Dettmann, Rachael L., C, Dimitri United States . USDA. Organic Consumers: A Demographic Portrayal of Organic Vegetable Consumption Within the United States. 2007.
Print.<http://econpapers.repec.org/paper/agseaa105/7899.htm>.
Dimitri, Carolyn, C. Greene. United States . USDA. Recent Growth Patterns In The U.S. Organic Foods Market. 2000. Print. <http://ageconsearch.umn.edu
/bitstream/33715/1/ai020777.pdf>.
Economic Research Service. (2013). “Gluten-free” and “No Trans Fats” Appearing on More
New Food Products. Retrieved from the USDA Online.
http://www.ers.usda.gov/data-products/chart-gallery/ detail.aspx?chartId =36634&ref=collection#.UpJX2SjGI20
Medline Plus U.S. National Library of Medicine , National Institutes of Health (2013). Celiac disease . Retrieved from website: http://www.nlm.nih.gov/medlineplus /
celiacdisease.html
National Foundation for Celiac Awareness. (n.d.). Celiac Disease Symptoms Can Be Elusive. Retrieved from http://www.celiaccentral.org/Celiac-Disease/Celiac-Symptoms/32/ National Foundation for Celiac Awareness. (n.d.). What is Celiac Disease?. Retrieved from
http://www.celiaccentral.org/SiteData/docs/WhatisCeli/e755ff9dea77bffe/What is Celiac Disease.pdf
SPINS. (2012). Gluten-free: Trend highlights. Retrieved from
http://www.expowest.com/ew12/CUSTOM/Uploads/Gluten-free_Kerry_Watson.pdf Stevens-Garmon, John, C. L. Huang, and B. Lin, "Organic Demand: A Profile of Consumers in
the Fresh Produce Market." Choices. 2007: 109-116. Web. 23 Jan. 2014. <http://www.choicesmagazine.org/2007-2/grabbag/2007-2-05.htm>.
U.S. Food and Drug Administration, Consumer Health Information (2013). What is gluten-free? fda has and answer. Retrieved from website: