Optical nutation at a Raman-active transition
S. V. Anikeev, V. B. Morozov,*)A. N. Olenin, and V. G. Tunkin M. V. Lomonosov Moscow State University, 119899 Moscow, Russia V. N. Kulyasov
S. I. Vavilov State Optics Institute, 194100 St. Petersburg, Russia 共Submitted 19 May 1999兲
Pis’ma Zh. E´ ksp. Teor. Fiz. 70, No. 1, 7–12共10 July 1999兲
Optical nutation at the Raman-active transition 6 P1/2– 6 P3/2of thallium atoms (R/2c⫽7793 cm⫺1) under resonant Raman excitation by a biharmonic picosecond pulsed field, giving rise to substantial motion of the population, is detected. Optical nutation appears as an oscillatory behavior of the energy of the anti-Stokes scattering of probe pulses, which follow with a fixed delay, as a function of the product of the energies of the excitation pulses. As a result of the dynamic Stark effect, which decreases the frequency of the transition under study, resonance excitation conditions are satisfied for negative initial detun-ings of the Raman excitation frequency from resonance. The Raman scattering cross section for the transition under study is estimated by comparing the experimental data with the calculations. © 1999 American Institute of Physics. 关S0021-3640共99兲00213-3兴
PACS numbers: 42.50.Md, 42.50.Hz
1. For fast 共relative to the relaxation times兲 excitation of optical transitions by a resonant or nearly resonant field, the temporal evolution of a two-level system has the character of regular oscillations of the population difference and polarization 共optical nutation兲. For dipole-forbidden transitions, excitation can be accomplished by a two-photon (1⫹2⫽R) or a Raman (1⫺2⫽R) scheme, where1 and2 are laser frequencies andR is the frequency of the transition under study.
In Ref. 1, for two-photon excitation of the 3S – 4D transition of sodium atoms, optical nutation was observed by detecting the modulation of the luminescence from the 4D level with a nonzero detuning from resonance, so that the nutation period was shorter than the relaxation times. In Ref. 2 nutation was observed with excitation of a two-photon vibrational–rotational transition of the NH3 molecule by pulses with close frequencies and different intensities. The 294 MHz detuning from the resonance frequency was compensated by the dynamic Stark effect. It was asserted by the author that the observed beats in the intensity of the weaker beam, passing through a cell containing NH3 mol-ecules, corresponded to periodic modulation of the inversion. It is important to note that in Refs. 1 and 2 the excitation beams propagated in opposite directions, which made it possible to compensate the Doppler shift.
The Doppler shift is not compensated for Raman excitation. For relatively high-5
frequency transitions the Doppler dephasing time T2*can be quite short, down to⬃1 ns. A universal method in which the conditions for coherence of excitation in detection of nutation are certainly satisfied, is to use excitation pulses with duration shorter than the times T1, T2, and T2*. The possibility of an experimental arrangement in which the dependence of the energy of coherent anti-Stokes共Stokes兲 scattering of a probe pulse, following through the medium with a fixed delay, would be measured as a function of the product of the energies of the excitation pulses is discussed in Ref. 3.
In gases the conditions for coherence of excitation are satisfied, as a rule, for pico-second pulses. Since the Raman scattering cross section is small, quite powerful picosec-ond pulses must be used to obtain substantial motion of the population. Then the dynamic Stark effect becomes substantial. The spectral manifestations of this effect with the ex-citation of Raman-active transitions have been investigated in Refs. 4 and 5.
In the present work optical nutation was detected at a Raman-active transition of thallium atoms under conditions of resonant biharmonic excitation with picosecond pulses, accompanied by a considerable motion of the population. The dynamic Stark effect was manifested as a strong ‘‘asymmetry’’ of the nutation under a change in sign of the initial detuning of the Raman excitation frequency1⫺2 from resonanceR.
2. Single picosecond pulses of a dye laser共30 ps,1⬇0.582m, energy 0.75 mJ兲 and an Nd:YAG laser 共30 ps, 2⫽1.064m, maximum energy 5 mJ兲 were used as excitation pulses, and single second-harmonic pulses 共25 ps, p⫽0.532m, 0.5 mJ兲, following with a fixed delay, were used as probe pulses. The radiations of the excitation and probe pulses were collimated into⬇1 mm diameter beams共at the 1/e intensity level兲 and directed into a 15 mm long cell containing thallium vapor heated to 950 K. The cell was filled with neon as a buffer gas to a pressure of 3 Torr at room temperature.
To decrease the effect of the averaging of the signal over the profile of the excitation beams, which smooths the nutations, a diaphragm 0.3 mm in diameter was placed on the axis of the beams 6 cm from the exit window of the cell. After passing through the diaphragm, the radiation of the excitation pulses was separated from the anti-Stokes signal (A⬇0.376m), and the energies W1and W2of these pulses were measured with photodetectors. In the process of detecting nutation, the energy W1of the excitation pulse with 1⬇0.582m was fixed, and the energy W2 of the excitation pulse with 2 ⫽1.064m was varied using a polarization rotator and a Glan prism. The polarization rotator, which did not cause beam drift, consisted of a fused-quartz plate, compressed in a direction perpendicular to the axis of the beams. After passing through the double diffraction monochromator the anti-Stokes radiation was detected with a photomultiplier. The fixed delay of 140 ps was chosen on the basis of the following considerations. First, it must be greater than the duration of the excitation pulses. Second, no appreciable decrease of the coherent signal should occur over the delay time. For a fixed neon buffer gas density, the collisional dephasing time is 9.3 ns,6 and it can be neglected in the calculations. Larger decays of the signal come as a result of Doppler dephasing, with a dephasing time of 1.1 ns at 950 K,6 and as a result of interference of the hyperfine components of the 6 P1/2– 6 P3/2 transition under study, which differ in frequency by 0.0175 cm⫺1, which leads to quantum beats with period 1.9 ns in the pulsed response.6 Thus the factors enumerated above are negligible with a 140 ps delay time and were neglected.
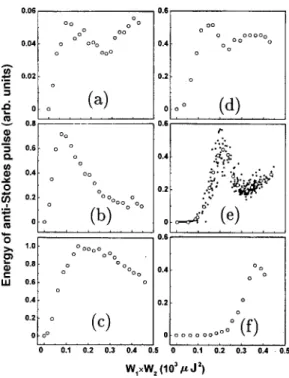
3. The experimentally measured dependence of the anti-Stokes radiation energy WA on the product W1W2 of the energies of the excitation pulses are shown in Fig. 1 for different initial detunings⌬0. The range of values of W1W2 corresponds to W2 in the range 0 – 400J with the fixed average value W1⫽10J. The curves in Fig. 1 are normalized to the maximum value of WAin Fig. 1c. The initial detuning is determined as
⌬0⫽(1⫺2)⫺R, i.e., this is the detuning for small values of W1 and W2, for which the Stark shift can be neglected. The circles indicate the average values of the anti-Stokes signal.
It should be noted first that the amplitude of the signal increases as the detuning
⌬0 varies from the initial zero value共Fig. 1a兲to⌬0⫽⫺1.4 cm⫺1 共Fig. 1b兲and then to⌬0⫽⫺2.4 cm⫺1 共Fig. 1c兲. The characteristic rise and fall of the signal, which are most clearly seen in Fig. 1b, form simultaneously. As兩⌬0兩increases, the maximum in Figs. 1b, and 1c shifts to larger values of W1W2. As兩⌬0兩 increases further, the apex becomes almost flat (⫺2.4 cm⫺1, Fig. 1c兲, after which a dip appears at the center (⫺3.2 cm⫺1, Fig. 1d兲, the minimum of the dip also shifting in to larger values of W1W2(⫺4.2 cm⫺1) with increasing兩⌬0兩. As兩⌬0兩increases, a signal appears with an increasing shift on the W1W2 scale共Figs. 1e and 1f兲. As ⌬0 varies from zero in the direction of positive values, however, the signal drops off rapidly.
As an example, the results of the unaveraged measurements in each laser shot are shown in Fig. 1e共dots兲 together with the average values. A number of circumstances make it difficult to detect a larger number of nutation periods. The variance of the
FIG. 1. Experimental dependence of the anti-Stokes scattering energy WAon the product W1W2of the energies of the excitation pulses for different initial detunings⌬0: a兲 ⌬0⫽0 cm⫺1; b兲⫺1.4 cm⫺1; c兲⫺2.4 cm⫺1; d兲
experimental points, which is due to fluctuations of the pulses, decreases the contrast in observing the nutation. This effect becomes more pronounced with increasing phase of the nutation. The smoothing of the nutation as a result of averaging over the area of the diaphragm is also more pronounced here. Moreover, the power density attained in the experiments corresponded to electric fields of the light up to 2.5⫻106V/cm. At these fields self-action appears in the optical components, and other nonlinear optical effects that distort the nutation picture also cannot be ruled out.
4. The Bloch equations for a generalized two-level system in a biharmonic pump field are, in a rotating coordinate system and in neglect of dephasing,7,8
d/dt⫽⍀⫻, 共1兲
where⫽(u,v,w) is the Bloch vector, u andv are the in-phase and quadrature compo-nents of the polarization, w is the normalized population difference between the lower and upper levels, ⍀⫽(⫺␥A1,A2,0,⌬), where ⌬ is the detuning of the excitation frequency from the Raman resonance frequency, and␥A1A2 is the Rabi frequency for Raman excitation with⌬⫽0 共there is no phase modulation of the excitation pulses and the slowly varying amplitudes A1 and A2 are real兲.
The motion of the Bloch vector under the influence of the excitation pulses is complicated by the dynamic Stark effect, which shifts the resonance frequencyR by
⌬St⫽(⌬␣1A1 2⫹⌬␣
2A2
2)/4ប 共Ref. 9兲, where ⌬␣
1 and⌬␣2 are the differences of the polarizabilities of the upper and lower levels for the waves1 and 2. Therefore the total detuning from Raman resonance is
⌬⫽⌬0⫹⌬St⫽共1⫺2兲⫺R⫹⌬St. 共2兲
The pulses were assumed to be Gaussian: A1,2⫽A1,2 0
exp(⫺4t2/P2), whereP is the pulse duration with respect to the 1/e level. Calculations were performed for plane waves with the obvious initial conditions: u0⫽0,v0⫽0, and w0⫽⫺1.
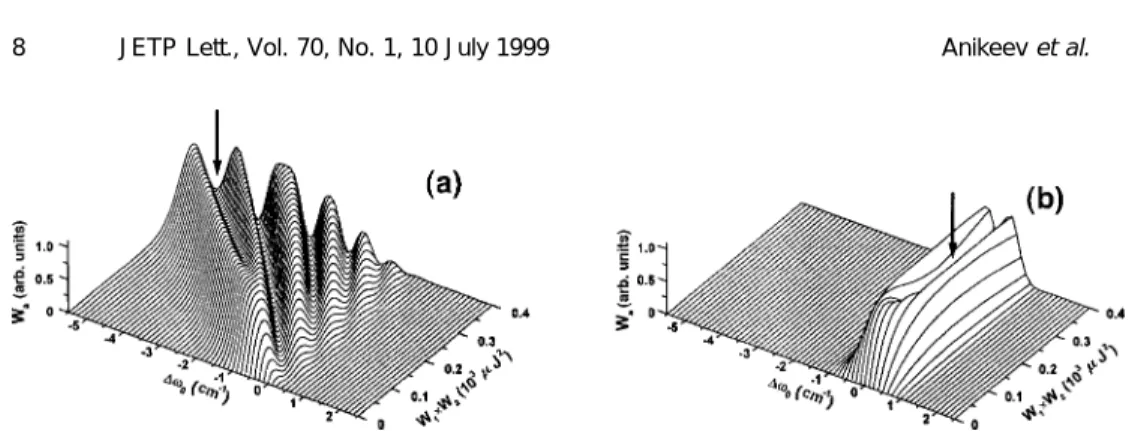
5. In accordance with the experimental arrangement, the position of the Bloch vector after the passage of excitation pulses was calculated, taking account of the experimentally measured Stark shift, using the model共1兲and共2兲. The pulse energy WAat the anti-Stokes frequency was found as the quantity proportional to the squared projection of the Bloch vector on the w⫽0 plane. Figure 2a shows the calculations of WAas a function of W1W2
FIG. 2. Calculation of the anti-Stokes scattering energy WAas a function of the initial detuning⌬0and the product W1W2of the energies of the excitation pulses on the basis of the model in Eqs.共1兲and共2兲, with共a兲and without共b兲the dynamic Stark effect.
for different values of⌬0. This shows the general character of the nutation under Stark shift conditions. Since the polarizability of an atom in the upper level is greater than the polarizability in the lower level, the frequency of the transition investigated shifts to lower values in accordance with the temporal form of the excitation pulses. The additive contribution, which we measured experimentally, to the shift of the transition frequency by each excitation pulse was 0.32 cm⫺1(W1⫽8J) and 0.67 cm⫺1(W2⫽70J), which corresponds to polarizability differences ⌬␣1⫽100(30)⫻10⫺24cm3 and ⌬␣2⫽25(8) ⫻10⫺24cm3.
The experimentally measured dependence of the anti-Stokes signal energy WA on the product W1W2 of the energies of the excitation pulses with fixed initial detunings
⌬0 correspond to a ⌬0⫽const section through the three-dimensional dependence presented in Fig. 2a. Figure 2b shows the computational results with the same scale as in Fig. 2a but neglecting the Stark effect. In this case, the nutation picture is symmetric with respect to the⌬0⫽0 plane: For ⌬0⫽0, as the product W1W2 increases, the system successively passes through a state of maximum polarization共the Bloch vector lies in the horizontal plane兲, maximum inversion 共the Bloch vector points upwards along the w axis兲, then once again maximum polarization, and finally back to the initial state. The region of maximum polarization corresponds to the apex of the three-dimensional depen-dence, and its total width is determined by the doubled Rabi frequency.10,11The region marked by the arrow in Fig. 2b is the inversion region.
The Stark shift introduces characteristic features in the nutation. Even with exact tuning to resonance (⌬0⫽0), for small W and W2 the dye-laser pulse with energy
W1⫽10J leads to a detuning because of the Stark shift⌬⬇0.4 cm⫺1, as a result of which the signal amplitude is small. For⌬0⬎0 the Stark shift increases the detuning
⌬ even more and the signal drops off rapidly, which experiment confirms. For ⌬0 ⬍0, satisfaction of the condition ⌬0⫹⌬St⫽0 for the corresponding amplitudes A1 and A2means that the Stark shift compensates the negative initial detuning and brings the system to resonance. The larger the value of兩⌬0兩, the larger the resonance field am-plitudes are. The nutation picture is ‘‘skewed’’ with respect to the⌬0 axis, extending along the axis, given by the condition⌬0⫹⌬St⫽0; in addition, as兩⌬0兩increases, a signal appears with increasing shift on the W1W2 scale. In the range of⌬0 from 0 to approximately⫺2 cm⫺1 the nutation amplitude increases, reaching the region of maxi-mum polarization u2⫹v2⫽1. However, as兩⌬0兩increases, the maximum shifts to larger values of W1W2. The system still does not enter the inversion region, marked by the arrow in Fig. 2a共the Bloch vector, having reached an almost horizontal position, then moves downwards兲. As兩⌬0兩 increases further, a dip共marked by the arrow in Fig. 2a兲 appears at the apex of the three-dimensional dependence; this dip corresponds to a tran-sition of the system into the inversion region, where the Bloch vector lies in the upper hemisphere. The depth of the dip increases with 兩⌬0兩, but for the values of W1W2 reached in the experiment it does not reach the bottom. The experimentally observed dependences also demonstrated nutation of a similar character.
Computer simulation of the nutation shows that the above-described features of optical nutation are very sensitive to the parameters of the model: the polarization dif-ferences⌬␣1 and⌬␣2 and the coefficient␥ in the expression for the Rabi frequency, proportional to the Raman scattering cross section.12 This enabled us to estimate, by comparing the experimental and computed dependences, the Raman scattering cross
sec-tion for the experimental transisec-tion as d/do⫽1.5(0.6)⫻10⫺27cm2/sr. It should be noted that while it describes the basic qualitative features of the observed nutation, the model employed does not give complete agreement, specifically, it gives a larger delay of the signal on the W1W2 scale. This is probably due to the simplicity of the model.
6. In summary, we have detected optical nutation upon the resonant biharmonic excitation of a Raman-active transition, leading to a substantial, even inverted, population of the upper level. The form of the nutation depended on the initial detuning of the biharmonic excitation frequency from Raman resonance; the resonance excitation range is shifted to negative values of the initial detuning on account of the dynamic Stark effect. We thank K. N. Drabovich for fruitful discussions and valuable remarks during the preparation of this letter and A. V. Andreev, T. M. Il’inova, and S. Yu. Nikitin for a discussion of the results. This work was supported by the Russian Fund for Fundamental Research共Grant 96-02-18837-a兲.
*兲e-mail: morozov@picar1.ilc.msu.su
1M. Bassini, F. Biraben, B. Gagnac, and C. Crynberg, Opt. Commun. 21, 263共1977兲. 2M. M. T. Loy, Phys. Rev. Lett. 36, 1454共1976兲.
3K. N. Drabovich, L. M. Kocharyan, and G. N. Slepchenko, Izv. Akad. Nauk SSSR, Ser. Fiz. 45, 1532共1981兲. 4
L. A. Rahn, R. L. Farrow, M. L. Koszykowski, and P. L. Mattern, Phys. Rev. Lett. 45, 620共1980兲.
5M. Pealat, M. Lefebre, J.-P. Taran, and P. L. Kelley, Phys. Rev. A 38, 1948共1988兲.
6F. Sh. Ganikhanov, V. N. Kulyasov, I. G. Konovalov et al., Opt. Spektrosk. 70, 483共1991兲 关Opt. Spectrosc.
70, 283共1991兲兴.
7
L. Allen and J. H. Eberly, Optical Resonance and Two-Level Atoms共Wiley, New York, 1975兲 关Russian translation, Mir, Moscow, 1978, p. 62兴.
8V. I. Anikin, K. N. Drabovich, and A. N. Dubovik, Zh. E´ ksp. Teor. Fiz. 72, 1727共1977兲 关Sov. Phys. JETP 45,
906共1977兲兴.
9V. S. Butylkin, A. E. Kaplan, Yu. G. Khronopulo, and E. I. Yakubovich, Resonant Interactions of Light with
Matter关in Russian兴 共Nauka, Moscow, 1977, p. 24兲.
10N. B. Delone and V. P. Kranov, Atoms in Strong Light Fields共Springer-Verlag, New York, 1985兲 关Russian
original, E´ nergoatomizdat, Moscow, 1984, p. 51兴.
11V. M. Akulin and N. V. Karlov, Intense Resonant Interactions in Quantum Electronics 共Springer-Verlag,
New York, 1991兲 关Russian original, Nauka, Moscow, 1987, p. 210兴.
12
S. A. Akhmanov and N. I. Koroteev, Methods of Nonlinear Optics in Light Scattering Spectroscopy 关in Russian兴 共Nauka, Moscow, 1981, p. 225兲.