TSA DATA AROUND THE WORLD
WORLDWIDE SUMMARY
Table of contents
Pages
Presentation... 1-3
1.
The TSA project around the world: overall comments ... 4-9
2. Present
status ... 10-34
3.
Selected aggregates and tables of results... 35-76
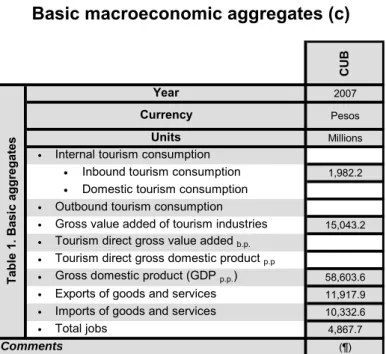
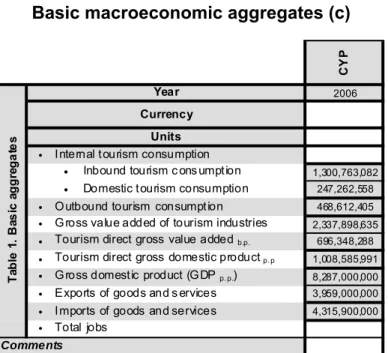
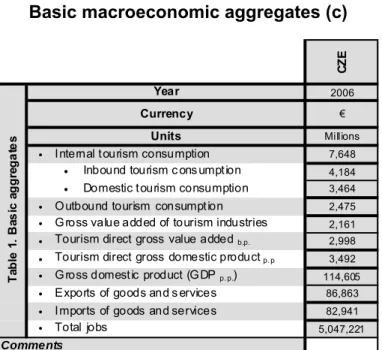
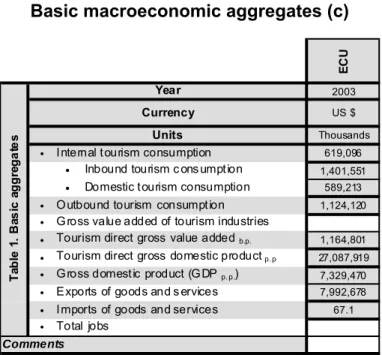
T.1.
Basic
aggregates ... 36-38
T.2. TSA related indicators... 39-42
T.3. Internal tourism consumption ... 43-48
T.4. Domestic tourism consumption ... 49-55
T.5. Inbound tourism consumption ... 56-62
T.6. Tourism gross value added, by industry ... 63-69
T.7. Tourism gross value added, by components...70
T.8.
Domestic supply... 71-76
4. Complementary
information ...77-109
5.
Understanding and measuring tourism economic contribution:
basic glossary ...110-113
Annex. Basic tourism data and macroeconomic aggregates...114-191
Presentation
A few years ago, in fact during the preparation of the Fourth UNWTO International
Conference on Tourism Statistics “
The Tourism Satellite Account (TSA)
:
Understanding Tourism and Designing Strategies”
held in
Iguazu (Argentina / Brazil /
Paraguay), 3-6 October 2005, UNWTO launched a consultation among countries that
had initiated a process of compilation of a TSA. In that opportunity, this initiative
concerned around 60 countries that received a first questionnaire which answers
were presented at this Conference. One of the consensus reached as a
consequence of such presentation was that UNWTO should begin to disseminate
TSA data and find the most practical way to request from countries (basically
National Tourism Administrations _NTAs_ and National Statistical Offices _NSOs_)
an assessment of the compliance of their TSA compilation methods to the TSA
recommended methodological framework (in effect, a brand validation approach).
After the Iguazú Conference, UNWTO requested a second set of clarifications and
information about the TSA design from those countries that had answered the first
questionnaire. In this occasion, this initiative was used to get some insights about
potential misunderstandings regarding the TSA conceptual framework. The answers
provided an important input for the updating process of the existing TSA official
recommendations that lead finally to the TSA: RMF 2008.
The richness of the information gathered by means of these two initiatives (partly
reproduced in chapter 4 “Complementary information” of this document), as well as
the identification of those issues that were attributable to different conceptual gaps
between the different frameworks, namely the SNA, BPM and TSA, paved the way to
a final contribution to the International Workshop on Tourism Statistics held in Madrid
from July 17 to July 20, 2006. During the 2006/2007 period, the Interagency
Coordination Group on Tourism Statistics integrated by UNSD, OECD, Eurostat, IMF,
ILO, WTO, UNECLAC and UNWTO used this input to review and close most of the
gaps that had been identified.
This effort of the international community culminated with the approval in 2008 by the
UN Statistical Commission of the new
International Recommendations for Tourism
Statistics 2008
and the updated
Tourism Satellite Account: Recommended
Methodological Framework 2008
document. Time has now come to present a new
publication gathering a selective set of TSA data produced by different countries
around the world.
As most compilers and users of TSA data know, the formal structure of the TSA is
determined by a set of predefined tables (10 tables) presenting basic statistical data
of economic nature related to the activity of visitors and the industries supplying the
goods and services that they acquire. Therefore, UNWTO has requested from
countries, represented by both their National Tourism Administration and their
National Statistical Office, to provide the official TSA results using the referred tables
guaranteeing at the same time that the concepts used are along the line of those
A significant number of countries (48) participated in this first attempt to collect TSA
data, although only 39 have done so. In addition to those countries, a complementary
ser of other thirteen (13) have been identified as having developed a TSA:
−
Eurostat has published in 4 volumes, the research carried on during
2009/2010 entitled
“Tourism Satellite Accounts in the European Union” (4
volumes).
This research has identified eight (8) additional countries.
−
Asia-Pacific Economic Cooperation (APEC) has also launched a research
on TSA implementation in APEC member countries. Based on the results
of the 2009 APEC TSA survey, a set of five (5) additional countries have
been identified.
)
Consequently, a total of 60 countries have been identified by early 2010 as having
already produced or are currently developing a TSA exercise. Other countries could
also be added to this list in the coming two years.
Australia
Austria
Bahamas
Belgium
Brazil
Canada
Chile
China
Colombia
Cuba
Cyprus
Czech Republic
Denmark
Dominican Republic
Ecuador
Egypt
El Salvador
Estonia
Finland
France
Germany
Greece
Guatemala
Honduras
Hong Kong, China
Hungary
India
Indonesia
Ireland
Israel
Italy
Jamaica
Japan
Kazakhstan
Korea, Republic of
Latvia
Lithuania
Malaysia
Mexico
Morocco
Netherlands
New Zealand
Nicaragua
Oman
Peru
Philippines
Poland
Portugal
Romania
Saudi Arabia
Singapore
Slovakia
Slovenia
Spain
Sweden
Switzerland
Taiwan, Prov. of China
United Kingdom
United States
Uruguay
“TSA data around the World”
will be published regularly every three years and only
in English. The second expected release (by the second quarter of 2012) should take
into account the new TSA:RMF 2008 in terms of tables, terminology and other type of
clarifications with respect to the former 2000 official document.
This publication is the first step taken by UNWTO towards the design of a process of
technical assistance on-line for the countries that have answered the questionnaire in
which support will be provided to their national projects (either through the exchange
of best practices, exchange of national experiences, responses to requests of
clarification concerning the new 2008 Tourism Satellite Account: Recommended
Methodological Framework, etc.). In the course of year 2010, we hope to be in the
position to launch such initiative, as well as others to be defined, by which UNWTO
would put into practice its responsibility as the custodian of the TSA brand.
The document is structured as follows:
-
Chapter 1 provides some overall comments and observations on the TSA
data collected.
-
Chapter 2 offers the results from the questionnaire specifically designed
for this publication that obtained the participation of 48 countries in
answering questions about their present status in TSA development.
-
Chapter 3 presents, in a comparative manner, the collection of TSA data
submitted to UNWTO by those countries (39) which had initiated a TSA
exercise by the time of completing the questionnaire and encompasses a
subgroup of the countries covered in Chapter 2.
-
Chapter 4 includes, for some of them, complementary information that
might be of interest for readers.
-
A basic glossary explaining tourism and the measurement of its economic
contribution is given in Chapter 5 after which an Annex provides some
additional country-by-country information on basic macroeconomic
aggregates and tourism data, as in the UNWTO
Compendium of Tourism
1.
The TSA project around the world: overall comments
1As explicitly mentioned in the cover of the present document, UNWTO is presenting
a preliminary draft of TSA data as compiled by countries around the world. These
general comments are preliminary for three different types of reasons:
- Various additional countries have already carried out a TSA exercise or are in a
very advanced stage towards releasing TSA data in the coming months (that
would be the case of countries such as Brazil, the Dominican Republic, Greece,
etc.). This will hopefully compensate the present bias by which the present 39
countries that provided data (the list of them is provided on page 35) refer mostly
to statistically advanced countries, half of them being European countries;
- We hope also that these new responses help us to focus on some comments
regarding the advance of the TSA Project, on the basis of the answers to the six
series of tables that have been used to structure chapter 2: “Present status”;
- Finally, UNWTO has already developed and would like to advance more with
respondents in a systematic review of the data provided as the present review
has identified some inconsistencies or lack of understanding of the requested
data as mentioned in the following paragraphs, some of which have already
been corrected within the review process developed during May 2009, and
others could easily be improved as a system of exchange of information is
been put in place.
The fact that data was collected using a Word file, and not as an Excel file, explains
many inconsistencies that may have derived from different processes of transcription
and from difficulties in putting data in the proper category. With an Excel file, it is
easier to check right away if the expected relationships between variables are met.
This should be corrected from our part in the future, and we hope to be able to
provide more guidance on how to derive the data in the requested tables from the
standard TSA tables as some data reflect some misunderstanding in that respect.
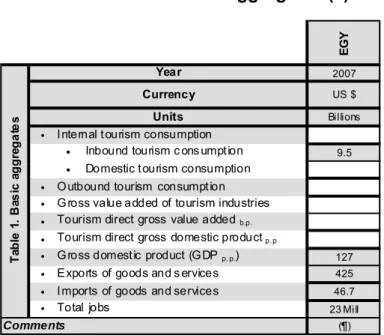
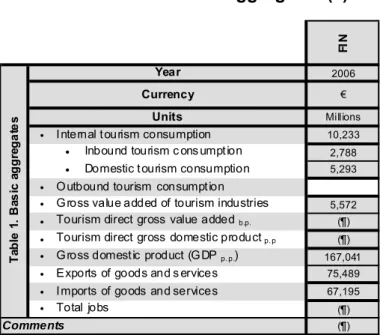
•
For instance, internal tourism consumption is not always equal to the sum of
inbound tourism consumption and outbound tourism consumption. This might be
conceptually correct as internal tourism consumption also includes non assigned
conceptual adjustments associated with non market production, and imputed
values such as second homes. Nevertheless, in some cases, the difference was
excessively big to be assignable to these adjustments items.
•
When confronting, in Table 2 of Chapter 3, the percentages of internal tourism
that inbound tourism consumption and domestic tourism consumption represent
with the numerical data that had been provided in Table 1, the figures did not
always match.
•
In some cases, the data concerning employment could not be readily understood:
Table 1 asked for total employment in the economy (the unit of account used was
not easily understandable, but was to be 1000) while Table 2 asked for the
proportion of jobs in the tourism industries as related to total jobs in the economy,
and there again, the data was not always clear nor consistent with other shares
such as that of Gross value added of tourism industries in Gross Value added, or
that of tourism gross value added in gross value added.
•
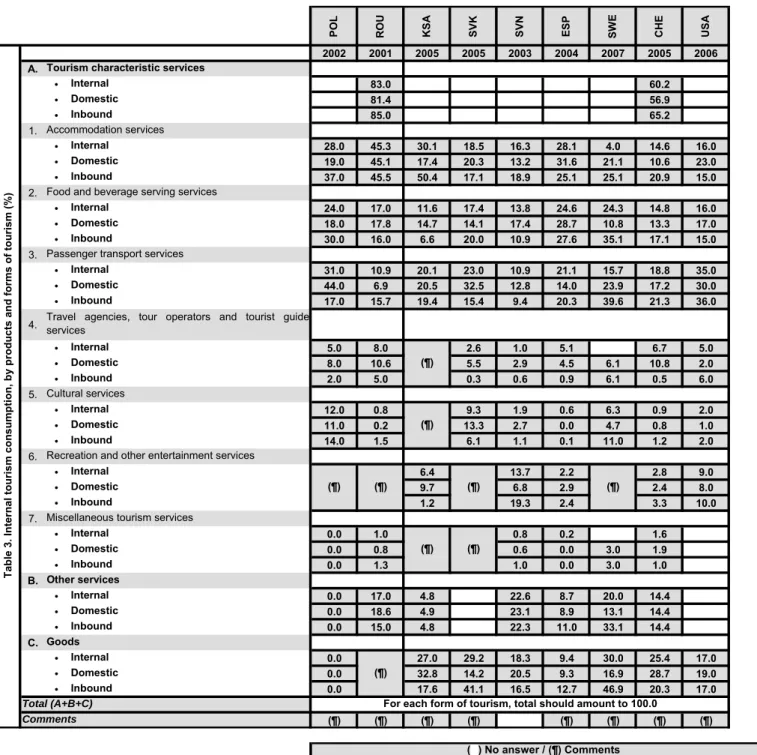
Regarding the breakdowns by products or by forms of tourism for internal tourism
consumption, inbound tourism consumption and domestic tourism consumption,
the breakdown provided not always summed up to 100% as expected, and, when
inconsistent, often summed up to more than 100%.
•
Table 6 focuses on getting information on tourism value added by industry, and
asks for Gross Value Added and Tourism Gross Value added, in both cases
expressed as a % of the corresponding total (Total Gross Value Added for all the
economy, Tourism Gross Value Added in the case of tourism) over all industries.
Various countries seem to have had difficulties in understanding the table, and
often the total percentages over all industries did not add to 100%.
Because of all these reasons, these overall comments are also preliminary and refer
exclusively to those countries that provided the data included in chapter 3 “Selected
aggregates and tables of results” and refer to those that passed the consistency
checks. UNWTO can only thank and congratulate all the countries that, willingly,
have provided their data for this first comparative exercise and thus put their work
under public scrutiny in a feasible manner.
We hope that countries will find it interesting to see how the structure of tourism
within their economy is different (or similar) to that observed in others, and may be,
derive conclusions, either on their compilation procedures, or on the particularities of
their tourism activity.
One first interesting conclusion can be derived from the analysis of the data of the 39
participating countries: All of them provided information on both inbound and
domestic tourism consumption, although not all in absolute value (case of Sweden
that only provided this information in % form), but not all calculated outbound tourism
consumption. In fact, 7 out of 39 countries do not provide information on this variable.
In most cases in which this estimation is not done, it is because it has no effect on
the internal tourism activity that seems to be of major interest for most countries’
tourism policy.
It is interesting to give a ranking of countries in terms of the number of requested data
that have actually been provided: in that classification, Finland leads the pack with
Australia, Mexico, Latvia, Poland and Lithuania following close by. The US trails behind,
as well as Sweden, mainly because they do not compile the breakdown of tourism
consumption between tourists and same day visitors, and their information on the Gross
Value Added of the Tourism Industries is neither provided globally nor by industries.
It is also interesting to rank countries taking into consideration the relative importance
an important international tourism destination. Important tourism destination such as
Spain (42,9%), France (29,9%) or the United States (12,4%) did not meet this
condition, showing that although leading international destination, and leaders in
terms of total inbound tourism consumption, they have an important population, with
a high level of income and that importantly takes domestic tourism trips. The case of
Mexico is also worth mentioning as Inbound tourism consumption only represents
13,7% of internal tourism consumption, which shows the relative importance of
domestic tourism for this economy. For Austria, a country with a relatively small
population, the shares of domestic and of inbound tourism consumption were almost
even, which tends to show also in this case that their domestic tourism is
proportionally very high.
Looking now at the importance of international tourism consumption as compared to
the international trade of goods and services, the level of this relationship depends
both on that of the numerator as well as that of the denominator. Countries might
have an important level of inbound tourism consumption, but if they are strongly
involved in international trade of goods and services, then this relationship might be
lower than expected (case of the USA (7,8%), France (9,7%) or Ireland (4,0%) for
example). The classification obtained is not wholly surprising:
•
Regarding the relationship between inbound tourism consumption and exports of
goods and services, here again Cyprus ranks first, with inbound tourism
consumption representing 33% of the value of exports of goods and services; in
second and third position come New Zealand and Spain, for which this
relationship is 18,3 and 18,2 % respectively. Then comes Australia, with a 13,3%,
followed by Israel (12,1%) and Austria (11%);
•
Regarding
the
relationship between outbound tourism consumption and imports of
goods and services, taking into consideration that some countries do not compile
outbound tourism consumption, the ranking is the following: Cyprus is still ahead,
with a 11,0%, reflecting maybe the relative low level of other imports of goods and
services, followed by Australia (10,2%); then come many different countries which
share is between 5 and 8 %, with a great variety of situations: middle income level
countries such as Ecuador or Colombia, reflecting may be the existence of high
and middle income population, eager to travel abroad, high income countries such
as France, Spain or Japan, reflecting both components, of relatively high
propensity to travel abroad, combined with a high level of imports, followed very
closely by Canada and the United States, with corresponding types of behaviours.
Looking now at the breakdown of tourism consumption by products, some comments
need to be made:
•
Countries have shown difficulties in applying the classification of consumption
expenditure as recommended in TSA-RMF 2000, in particular in the case of
miscellaneous tourism characteristic services, other services and goods as many
countries have merged the three categories. Nevertheless, even the coverage of
the remaining categories lacks the requested homogeneity to make comparisons
globally consistent: for instance, the services provided by second homes are not in
all cases measured, and when they are, they are not classified in the same
tourism services”, while others usually consider such services within
accommodation services; Canada includes vehicle fuel within transportation (within
a functional type of classification, not according to the nature of the product) a view
which is hardly shared by other countries. The classification of goods has been
also different from country to country, so that it is not possible to compare what has
been done. A more serious situation also occurs, serious because it has to do, not
only with the structure of consumption, but also with its level, some countries have
not been able to breakdown the value of packages used by inbound visitors into its
different components: a part to be excluded from inbound tourism consumption as
it does not concern any transaction between a non resident and a resident of the
country of reference, and the remaining value that is part of inbound tourism
consumption (case of the Czech Republic for instance);
•
Some countries (Poland, the Philippines, and New Zealand) only consider the
consumption of tourism characteristic services within tourism consumption. As a
consequence, not only are other non tourism characteristic services and goods
missing from the measurement of tourism consumption, but the relative shares of
the items that are shown in all cases are distorted in the comparison. Additionally,
their overall level of tourism consumption is undervalued.
•
From
table
3,
and notwithstanding the earlier considerations (in particular what
relates to second homes that might or might not be included under accommodation
services), it is interesting to see the relative weight of the expenditure in
accommodation services, in internal tourism consumption, in domestic tourism
consumption and in inbound tourism consumption: it is expected that such share
should represent an important portion of tourism consumption in all circumstances,
and that the share for domestic consumption should be smaller than for inbound
tourism consumption, taking into consideration that non-residents would more
frequently use paying accommodation than non paying accommodation (with family
and friends) or frequently use a more expensive (higher quality) type of
accommodation. This is actually true in most countries, with a spread that might be
quite high as for instance in the Kingdom of Saudi Arabia (50,4% for inbound tourism
consumption vs. 17,4% in the case of domestic), Austria (46,8% (inbound) against
19,4% (domestic)), Cyprus (30,3% (inbound) against 10,0%(domestic)), Canada
(23,9% (inbound) against 12,2%(domestic)) or India (17,8% (inbound) against 3,5%
(domestic)). Nevertheless, there are some important tourism destination where this
does not happen, as Spain (25,1% (inbound) against 31,6% (domestic)), France
((26,0% (inbound) against 28,1% (domestic)), Israel (20,1% (inbound) against 28,1%
(domestic)), or the United States (15,0% (inbound) against 23,0% (domestic)), only
to name a few. What could be the explanations for such differences?
o For each country, the difference might have different explanations: in
the case of Spain, when looking more closely at the structure of tourism
consumption in each of the cases (inbound and domestic), it appears
that passenger transport services, other services and goods represent
a significantly higher share within inbound tourism as compared to
o In the case of France, the strong difference in the shares of
consumption dedicated to cultural services (12,2% (inbound) (among
the highest…) against 7,7%(domestic)), and goods (28,7% (inbound)
against 18,3 %(domestic)), within inbound tourism consumption could
be an explanation to the lower share dedicated to accommodation, as
no comparison is possible, with the presently collected information, on
the absolute level of per capita expenditure.
o In the case of Israel, it might be necessary to review the breakdown of
consumption by product, as there seems to be some anomalies, for
instance in the share of travel agencies services (21,1% in the case of
domestic tourism consumption) that might indicate that packages might
not have been unbundled. Packages usually include accommodation
plus other services.
•
Regarding tables 4 and 5, asking for the breakdown of tourism consumption
between consumption by tourists and that by same-day visitors, it appears that
many countries, either still have not included same-day visitors within their
tourism statistics, because of the particularities attached to their estimation, or
have not broken down the total expenditure of visitors between tourists and
same-day visitors, or, as is the case of Australia, consider that the number of
inbound same-day visitors might be negligible and do not intend any estimation
neither of their flow, nor of their expenditure. In the end, there is only information
for 19 countries in the case of domestic visitors, and 17 in the case of inbound
visitors. Because same-day visitors do not usually spend in accommodation (with
the exception of few countries, there is no consumption of these services, and
when it exists, its share is very small), the structure of consumption of same-day
visitors is structurally different from that of tourists. Structures vary considerably
from country to country and no predominant pattern seems to emerge.
•
Within the 26 countries that compiled table T6 showing, on the one hand, the
shares of the Value Added of Tourism Characteristic Activities within the total
value added of the country, and the shares of each activity within Tourism Gross
Value Added (TGVA), a certain number of country data were not consistent:
either because the shares were clearly inconsistent, (adding to more than 100%)
or being clearly unappropriate, or because only tourism characteristic activities
provided goods and services to visitors, which is another type of inconsistencies.
2 of the “consistent ones” (the Philippines and New Zealand) were found in which
tourism characteristic industries represented less than 50% of total Tourism
Gross Value Added, which leads to questioning the relevance of tourism
characteristic industries to tourism, or points rather to a lack of understanding of
the aggregate. In other countries, the share of tourism characteristic industries
was surprisingly high, often associated with a poor or lack of estimation of
consumption of non tourism characteristic products. As a simple average of the
validated responses (that, as have been said, is not a statistically representative
sample…), the tourism value added of tourism industries would represent around
62% of tourism Gross Value added.
•
On the other hand, a few countries clearly did not understand the question
regarding the share of tourism characteristic activities and other activities
providing goods and services to visitors within total Gross Value Added, as in
some cases (3 countries) Tourism Characteristic Activities represented more than
50% of total Gross Value Added of the economy which is clearly an error of
interpretation. In Cyprus and Spain, that have already been identified as countries
for which tourism occupies an important place within their economy, this share
amounts to 22,4% and 22,2 % respectively. As a simple average of the validated
responses (that, as have been already said, is not a statistically representative
sample…), the value added of tourism industries would represent around 9% of
total value added of the economy.
•
Countries providing data on the share of Tourism Gross Value Added (TGVA)
regarding total Gross Value Added (GVA) of tourism industries rank from 57% up
to 83%, but only few of them (15) identified the components of Tourism value
added, of which only 10 provided fully consistent information. Within these 10
countries, there is an important spread in the relative shares of compensation of
employees, that ranges between 21,3% in Mexico, to 67,8% in Canada. Countries
in which this share exceeds 50% are European countries, and Canada, whereas in
all other regions represented within the validated data, this share is smaller than
50%. It should be interesting to be able to complement this with more information
regarding the characteristics of employment, principally in tourism characteristic
activities, but also in other activities, in particular the importance of non paid family
workers as well as a comparison with the components of Gross Value Added of the
country of reference, so as to be able to give an opinion on Tourism Gross Value
Added as compared to the total economy.
•
Finally, Table 8 focuses on the product breakdown of tourism consumption and
its share in the corresponding supply. It is evident that there is a need for
metadata (i.e. all the related methodological information) and further refinement in
some of the tourism shares presented. Consequently, the data provided show
that as long as there is no full implementation of the product breakdown as
indicated by the international recommendations on the TSA, comparisons must
be made with great caution.
These results and the comments on the specific content of the variables provided by
most of the countries that follow show that, despite the efforts that have been made
over the years, both at international and national level, there is still a very large field
of potential progress towards full international comparability of the TSA results
among countries.
Nevertheless, taking into consideration the emphasis of the new 2008 IRTS and
TSA-RMF on the area of classifications of products and activities, and in recognizing
more clearly the difference between internationally comparable tourism characteristic
activities and products, and those products and activities, though tourism
2. Present status
List of Countries
2Argentina ___________________________________________
ARG
Australia ____________________________________________
AUS
Austria______________________________________________
AUT
Bahamas____________________________________________
BHS
Belgium_____________________________________________
BEL
Canada _____________________________________________
CAN
Chile _______________________________________________
CHL
China ______________________________________________
CHN
Colombia____________________________________________
COL
Costa Rica __________________________________________
CRI
Cuba _______________________________________________
CUB
Cyprus _____________________________________________
CYP
Czech Republic_______________________________________
CZE
Denmark ____________________________________________
DNK
Ecuador ____________________________________________
ECU
Egypt ______________________________________________
EGY
Finland _____________________________________________
FIN
France______________________________________________
FRA
Honduras ___________________________________________
HND
India _______________________________________________
IND
Indonesia
________________________________________
IDN
Ireland______________________________________________
IRL
Israel _______________________________________________
ISR
Italy ________________________________________________
ITA
Jamaica ____________________________________________
JAM
Japan ______________________________________________
JPN
Kazakhstan __________________________________________
KAZ
Latvia ______________________________________________
LVA
Lithuania ____________________________________________
LTU
Malaysia ____________________________________________
MYS
Mexico _____________________________________________
MEX
Morocco ____________________________________________
MAR
Netherlands _________________________________________
NLD
New Zealand_________________________________________
NZL
Oman ______________________________________________
OMN
Philippines __________________________________________
PHL
Peru _______________________________________________
PER
Poland______________________________________________
POL
Romania ____________________________________________
ROU
Saudi Arabia _________________________________________
KSA
Slovakia ____________________________________________
SVK
Slovenia ____________________________________________
SVN
South Africa _________________________________________
ZAF
Spain_______________________________________________
ESP
Sweden_____________________________________________
SWE
Switzerland __________________________________________
CHE
Trinidad and Tobago___________________________________
TTO
United States ________________________________________
USA
2
UNWTO released a questionnaire proposed specifically for the design of the preliminary version of
TSA data
around the World
. It was sent by August 2008 to 84 countries for which there was some type of information
that a TSA was under construction: 48 countries sent their replies to this first module about their respective TSA
present status (Indonesia has requested some extra time to complete them). Six questions were included: only the
answers to Q1 and Q2 are tabulated following this table. Answers to the rest of the questions, as well as
AR G AUS AUT BH S BE L CA N CHL CH N CO L CRI CU B CY P (¶) (¶) (¶) (¶) (¶) (¶) (¶) (¶) (¶) (¶) (¶) (¶) (¶) (¶) (¶) (¶) (¶) (¶) (¶) (¶) (¶) (¶) (¶) (¶) (¶) 2005 2002 2003 2002 2000 2006
Latest year available
Q.2
Comments
Check all boxes that apply.
Based on supply and use tables (SUT) and/or input-output tables (IO).
Interface between visitor consumption and corresponding supply of goods and services has been fully articulated and includes the corresponding reconciliation table (TSA:RMF Table 6).
General methodological approach
Publication of TSA data includes estimates of indirect and induced effects.
TSA is based on econometric or statistical modeling techniques. If this is the case, please indicate the approach and techniques used.
Q.1
Two or more exercises with no integration in National Accounts-- but going beyond the first experimental exercise (or pilot study).
First experimental exercise (or pilot study)
Indicate which one of these cases applies to your present TSA project.
Two or more exercises with integration in National Accounts annual programme of work. In this case, please provide length of TSA historical series available and completeness regarding TSA:RMF tables.
Comments
Present stage of implementation
CZE DNK ECU EGY FIN FR
A
HND IND IDN IRL ISR ITA
(¶) (¶) (¶) (¶) (¶) (¶) (¶) (¶) (¶) (¶) (¶)
Q.2
Check all boxes that apply.
Based on supply and use tables (SUT) and/or input-output tables (IO).
Interface between visitor consumption and corresponding supply of goods and services has been fully articulated and includes the corresponding reconciliation table (TSA:RMF Table 6).
General methodological approach
TSA is based on econometric or statistical modeling techniques. If this is the case, please indicate the
Q.1
Two or more exercises with no integration in National Accounts-- but going beyond the first experimental exercise (or pilot study).
First experimental exercise (or pilot study)
Indicate which one of these cases applies to your present TSA project.
Two or more exercises with integration in National Accounts annual programme of work. In this case, please provide length of TSA historical series available and completeness regarding TSA:RMF tables.
Comments
JAM JP N KAZ LV A LT U MYS MEX MA R NL D NZL OMN PER (¶) (¶) (¶) (¶) (¶) (¶) (¶) (¶) (¶) (¶) (¶) (¶) 2007 2004 2006 2005 2007 (¶) 2007 2001
Latest year available
Q.2
Comments
Check all boxes that apply.
Based on supply and use tables (SUT) and/or input-output tables (IO).
Interface between visitor consumption and corresponding supply of goods and services has been fully articulated and includes the corresponding reconciliation table (TSA:RMF Table 6).
General methodological approach
Publication of TSA data includes estimates of indirect and induced effects.
TSA is based on econometric or statistical modeling techniques. If this is the case, please indicate the approach and techniques used.
Q.1
Two or more exercises with no integration in National Accounts-- but going beyond the first experimental exercise (or pilot study).
First experimental exercise (or pilot study)
Indicate which one of these cases applies to your present TSA project.
Two or more exercises with integration in National Accounts annual programme of work. In this case, please provide length of TSA historical series available and completeness regarding TSA:RMF tables.
Comments
Present stage of implementation
PH
L
POL ROU KSA SVK SVN ZAF ES
P
SW
E
CHE TTO USA
(¶) (¶) (¶) (¶) (¶) (¶) (¶) (¶) (¶) (¶) (¶)
(¶)
(¶) (¶) (¶) (¶) (¶) (¶) (¶)
2007 2002 2001 2005 (¶) (¶) (¶) 2007 2005 (¶)
Latest year available
Q.2
Comments
Check all boxes that apply.
Based on supply and use tables (SUT) and/or input-output tables (IO).
Interface between visitor consumption and corresponding supply of goods and services has been fully articulated and includes the corresponding reconciliation table (TSA:RMF Table 6).
General methodological approach
Publication of TSA data includes estimates of indirect and induced effects.
TSA is based on econometric or statistical modeling techniques. If this is the case, please indicate the approach and techniques used.
Q.1
Two or more exercises with no integration in National Accounts-- but going beyond the first experimental exercise (or pilot study).
First experimental exercise (or pilot study)
Indicate which one of these cases applies to your present TSA project.
Two or more exercises with integration in National Accounts annual programme of work. In this case, please provide length of TSA historical series available and completeness regarding TSA:RMF tables.
Comments
TSA present status: complementary information
ARG
Q.1 Present stage of implementation:
In August 2008 the Secretariat of Tourism of Argentina (SECTUR) and the National Statistics and Census Institute (INDEC) signed an Addendum to the general agreement “Action Plan for the Development of the Tourism Satellite Account of Argentina (TSAA)” establishing actions leading up to the estimation of the TSA for Argentina. The timetable of the project was estimated as lasting from December 2008 to April 2010, and a joint working team comprising SECTUR and the National Accounts Directorate of INDEC was formed.
The preparation of the “Manual for the Implementation of the Argentina Tourism Satellite Account” prepared by National Accounts and Tourism experts and completed in 2006 was used as a background reference.
Q.2 General methodological approach:The TSAA will be estimated using the supply and use tables of the national accounts.
2004 will be the reference year.
Q.3 Institution in charge for compilation:
• Name: Secretariat of Tourism of Argentina and the National Statistics and Census Institute.
• Comments:
The estimation of the TSAA is to be carried out under an Interinstitutional Platform including SECTUR, INDEC, the Argentina Tourism Chamber of Commerce and the National Directorate for Migrations. This platform is formalized in a framework cooperation agreement called “Action Plan for the Development of the TSAA”.
Within this framework, specific agreements (Addendums) are signed annually between SECTUR and INDEC, in which the objectives and the obligations of the parties are established.
In the Addendums the statistical operations to be carried out during the year are set forth. • Survey on International Tourism
• Survey on Hotel and Parahotel Occupancy
• Household Survey on Tourism activity (conducted in 2006) • Estimation of the TSA (2009-2010)
The operations are coordinated and conducted through a joint team comprising SECTUR and INDEC. The funding of the annual operations is the responsibility of SECTUR and their technical execution is the responsibility of INDEC.
Q.4 Basic documentation:
• TSA sources and methods documents: “Manual for the Implementation of the Argentina Tourism Satellite Account”
• Other related publications and studies:
• Survey on Intern)
• Survey on Hotel and Parahotel Occupancy
• Household Survey on Tourism activity
Q.6 Person in charge for TSA:
• Name: Lic. Rodrigo Oliver.
• Title: Coordinator of the Action Plan for the Development of the Argentina Tourism Satellite Account.
• Organization: Secretariat of Tourism of Argentina.
• E-mail:[email protected]
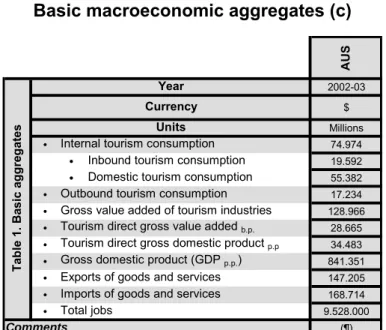
AUS
Latest year available of full scale ATSA: 2003-04 (1July 2003 to 30 June 2004 inclusive).
Q.1 Present stage of implementation:
Australian National Account: Tourism Satellite Account 1997-98 (ABS cat.no.5249.0), was the first Tourism Satellite Account (TSA) for Australia and was released in October 2000. The TSA has since been published annually, with the most recent edition relating to 2006-07 (1 July 2006 to 30 June 2007 inclusive) released in April 2008. The next edition relates to the 2007-08 period and is scheduled for release in April 2009.
Given the detailed level of product and industry used in the Australian TSA (ATSA), it is not feasible to collect the detailed supply side data required to produce a full scale ATSA every year on a timely basis. A full scale benchmark using updated supply and use tables is conducted every 3 years. For the available TSA time series, benchmark years are 1997-98, 2000-01 and 2003-04. The next benchmark will be compiled with respect to 2006-07 in the production of the 2008-09 ATSA to be released in June 2010.
In the other years the demand side data combined with the supply relationships from the benchmark TSA are used to update the key results of the TSA.
Q.2 General methodological approach: As mentioned above, a full scale TSA compilation with a reconciliation between visitor
consumption and the corresponding supply of goods and services is undertaken every three years with the benchmark compilation of the Australian TSA (ATSA). In the remaining years the demand side data combined with the supply relationships from the benchmark TSA are used to update the key results of the TSA.
Q.3 Institution in charge for compilation:
• Name: Australian Bureau of Statistics.
• Comments:
Department of Resources, Energy and Tourism (RET) previously committed to provide ongoing funding for the compilation of the TSA.
The compilation of the TSA is resource expensive and has been supported by frequent Service Industry Surveys undertaken by the ABS. e.g. for accommodation, cafes and restaurants, pubs and clubs etc.
Q.4 Basic documentation - TSA sources and methods documents:
• Explanatory notes for the Australian Tourism Satellite Account:
Q.5 Dissemination formats of TSA data:
• Hard copy – Annual publication(/s):
• Organization: Australian Bureau of Statistics.
• E-mail:[email protected]
AUT
Q.1 Present stage of implementation:
For years 1999 till 2005 TSA-data has been revised on a yearly basis. Since NA data for year (n) have been available in August/September of year (n+1), provisional TSA results are available by November of the year (n+1), i.e., 2004 results were available in November 2005. The preliminary data are currently been revised within the scope of the most recent TSA-results (i.e. 2004 data within the 2005 results). Starting with year 2005 a 2-years-intervall has been envisaged (2007) and stated as being sufficient due to a rather stable development of the tourism industry in Austria.
Starting with year 2004 the economic analysis of the Austrian tourism was extended by estimating the direct and indirect effects of tourism on the overall employment (for the year 2003 only direct effects); results on the contribution of the tourism and leisure industry to the overall employment is available, therefore.
On a yearly basis a Working Group on tourism statistics, whose members are from local tourism and statistical authorities and other main data users, discusses issues related to tourism statistics in general, which also concern TSA-issues. On a more detailed level, TSA-relevant discussions occur within Statistics Austria (in particular NA-department) but also with other institutions, such as WIFO (as one of the compilers of TSA), the Austrian Central Bank (in view of TBoP) or the “Federal Ministry of Economics and Labour” (customer).
TSA for Austria does not deliver all the information for the 10 interlinked tables according to UN-TSA; the development has been concentrating on the “core TSA-Tables” which comprise:
• TSA-Table 1: Inbound tourism consumption by products and categories of visitors
• TSA-Table 2: Domestic tourism consumption by products and ad hoc sets of resident visitors • TSA-Table 4: Internal tourism consumption by products and types of tourism
• TSA-Table 5: Production accounts of tourism industries and other industries • TSA-Table 6: Domestic supply and internal tourism consumption by products • TSA-Table 7: Employment in the tourism industries
Mainly due to lack of data and lack of methodological guidelines the following TSA-Tables are not considered so far: • TSA-Table 8: Tourism gross fixed capital formation of tourism industries and other industries
• TSA-Table 9: Tourism collective consumption by functions and levels of government
Furthermore, the following TSA-Tables are not taken into account, but being planned for the near future:
• TSA-Table 3: Outbound tourism consumption, by products and categories of visitors, since this Table is not part of the internal tourism consumption; however, based on TBoP data (debit) and survey related outbound tourism respective calculations are going to be planned in 2009.
• TSA-Table 10: Non-monetary indicators
Q.2 General methodological approach: As an extension of TSA concepts the “Austrian Institute of Economic Research” (WIFO)
is doing estimates related to the indirect effects of the tourism industry (including employment); furthermore, forecasting are done for the current year and the following year (i.e. based on data of year 2005, for 2006 and 2007). In addition, estimates are made regarding the direct and indirect leisure effects related to the overall economy (activities of residents within their usual environment).
Q.3 Institution in charge for compilation:
• Name:Statistics Austria.
• Comments:
The development of a TSA for Austria is commissioned by the “Federal Ministry of Economic Affairs and Labour” (BMWA) on a contractual basis which is also in charge of tourism. The project is undertaken in a joint project by Statistics Austria (STAT) and the “Austrian Institute of Economic Research” (WIFO) since 2001, starting with the reference year 1999.
The division of TSA tasks between both institutes is as follows:
• Statistics Austria is mainly responsible for doing the basic TSA-calculation based on the UN-TSA, including mainly the estimation of the direct effects of the tourism industry related to the overall economy (incl. employment effects) for the respective year (the most recent for 2005).
• As an extension of TSA concepts WIFO is mainly doing estimates related to the indirect effects of tourism (including employment), forecasts related to the current year and the coming year and estimates related to direct and indirect leisure effects.
Q.4 Basic documentation:
• TSA sources and methods documents:
• A Tourism Satellite Account for Austria. The Economics, Methodology and Results. Statistics Austria and WIFO, Vienna 2001 (English only).
• A Tourism Satellite Account for Austria. The Economics, Methodology and Results 1999-2003. Statistics Austria and WIFO, ISBN 3-901400-55-9, Vienna 2002 (English only).
• A Tourism Satellite Account for Austria. Methods, Results and forecasting for the years 2000-2007, Statistics Austria/WIFO, Vienna 2006 (German only).
• Website
• Other related publications and studies: Franz A., Laimer P., "Tourism Economic Accounts and Real Net Output in
Tourism. Methods and Results", Tourism Journal (Lucius & Lucius, Stuttgart), 2nd year (1998), issue 3, pp. 313-334 (German).
Q.5 Dissemination formats of TSA data:
• Hard copy:
• Annual publication:
• Title:
A Tourism Satellite Account for Austria. Methods, Results and forecasting for the years 2000-2007, Statistics Austria/WIFO, Vienna 2006.
Until reference year 2005: annually; 2007 onwards: biennially.
• Language(s):
German (long version). English (summary version).
• Title: Tourism in figures Austria 2007/08 (leaflet).
• Periodicity: Annually.
• Language(s): German/English (partly).
• Electronic - Internet:
• Website:
(German).
(English).
• Table reference/title:
(English; available in html, pdf and excel format):
(1) The direct and indirect macroeconomic importance of tourism in Austria 2000 – 2007. (2) The direct macroeconomic importance of tourism in Austria 2000 – 2007.
(3) Tourism consumption expenditure by non-resident and resident visitors in Austria 2000 – 2007.
• Language(s): German/English (partly).
Q.6 Person in charge for TSA:
• Name: Peter Laimer.
• Title:Deputy Director, Directorate Spatial Statistics.
• Organization: Statistics Austria.
• E-mail:
BHS
Q.1 Present stage of implementation: We had two preliminary exercises using National Accounts aggregates. The present
stage involves the extraction of the TSA from the Supply and Use Tables.
Q.3 Institution in charge for compilation: The TSA in The Bahamas has a two-tiered inter-agency TSA Development
Management Committee: a working committee and an approval committee. Agencies include the Department of Statistics, the Ministry of Tourism and Aviation and the Central Bank of The Bahamas. The TSA is mainly financed by the Ministry of Tourism.
Q.4 Basic documentation - TSA sources and methods documents: TSA Metadata document includes sources and methods of surveys used e.g. Business Establishments Surveys, Visitor Expenditure Surveys, BOP, Labour Force Reports, Bahamas Living Conditions Survey Government Treasury Accounts, etc.
Q.5 Dissemination formats of TSA data:
• Hard copy - Annual publication:
• Title: The Bahamas Preliminary Tourism Satellite Account. (One issue)
• Language(s): English.
• Electronic - Internet:
• Website:tourismbahamas.org; centralbankbahamas.com
• Table reference/title Tourism Satellite Account.
• Language(s): English.
Q.6 Person in charge for TSA:
• Name: Ms. Pamela Lowe.
• Title:General Manager.
• Organization: Ministry of Tourism.
• E-mail:[email protected]
• Name: Mrs. Clarice Turnquest.
• Title:Assistant Director, Statistics.
• Organization: Department of Statistics.
• E-mail:
BEL
Q.1 Present stage of implementation:
Our last TSA project intended to compile regional TSAs for the 3 regions of Belgium.
5 TSA-tables (Tables 1, 2, 4, 5 and 6) will in the future be provided. A network of inter-institutional cooperation (National Bank of Belgium, Regional Tourism Boards, Ministries responsible for Tourism…) has been put together for our last project.
Q.2 General methodological approach: We used the national Supply-Use table for 2002 (regional Input-Output and Supply-Use
tables not available) as well as the regional accounts which compile production, intermediate consumption and value added.
Q.3 Institution in charge for compilation:
For the regional TSAs, there was an agreement between the two institutions responsible for the TSA compilation (Regional Tourism Boards, that’s-to-say Toerisme Vlaanderen and Office de Promotion du Tourisme de Wallonie et de Bruxelles, and the Ministries in charge of Tourism) as well as an agreement between Office de Promotion du Tourisme de Wallonie et de Bruxelles and Toerisme Vlaanderen for the regional TSA compilation.
We are going to try to compile a TSA for each of the 3 regions (Brussels Region-Wallonia-Flanders) and on the basis of this, we will try to compile a TSA for Belgium.
Person in charge for TSA:
• E-mail:
• E-mail:
Q.1 Present stage of implementation:
Canada has completed the national TSA for 1988, 1992, 1996, 1998, 2000 and 2002. Work on the 2004 TSA is underway. For 1996 and 1998, a provincial/territorial TSA was done, with TSA tables for each of Canada’s 10 provinces and 2 territories (Canada has now 3 territories. The third territory of Nunavut was created in 1999 from the division of Northwest Territories). TSA-RMF Tables 1-6 were completed in each exercise.
in Canada from tax and non-tax sources that is directly attributable to tourism spending in Canada showing amounts due separately to resident and non-resident visitors
4) The Human Resource Module of the TSA – a detailed set of tables showing annual time series (1997+) on number of jobs, hours worked, and labour compensation (both, in total, and directly attributable to tourism spending) in tourism industries with breakdowns by occupation, full-time/part-time status, sex, age group and immigrant status
5) Work has started to link the TSA with Statistics Canada’s environmental accounts in order to estimate greenhouse gas emissions directly attributable to tourism.
Q.3 Institution in charge for compilation:
• Name: Statistics Canada.
• Comments:
The TSA is compiled by staff of the Income and Expenditure Accounts Division in the System of National Accounts Branch of Statistics Canada, Canada’s national statistical office, with funding from the Canadian Tourism Commission (CTC), Canada’s national tourism authority.
The Canadian Tourism Commission also funds the National Tourism Indicators and the module on Government Revenue Attributable to Tourism.
The linkage of the TSA with the environmental accounts and the work on the Human Resource Module of the TSA entail even broader partnerships among Statistics Canada and other national and regional government organizations and industry associations.
Q.4 Basic documentation:
• TSA sources and methods documents.
Canadian Tourism Satellite Account Handbook National Tourism Indicators: Sources and Methods Revisions of the Canadian National Tourism Indicators
• Other related publications and studies.
Canadian Tourism Satellite Account, 2002 National Tourism Indicators, Quarterly Estimates
Human Resource Module of the Tourism Satellite Account, Update to 2006 Government Revenue Attributable to Tourism, 2000 to 2006
The 2001-2006 Revisions and Rebasing to 2002 of the National Tourism Indicators All these documents are available at Statistics Canada’s website:
in English at:
Q.5 Dissemination formats of TSA data- Electronic - Internet:
• Website:
• Table reference/title: The Canadian Tourism Satellite Account.
• Language(s): English and French.
Q.6 Person in charge for TSA:
• Name: Chris Jackson.
• Title: Chief, Research and Development Projects and Analysis Section, Income and Expenditure Accounts Division, System
of National Accounts Branch.
• Organization: Statistics Canada.
• E-mail:
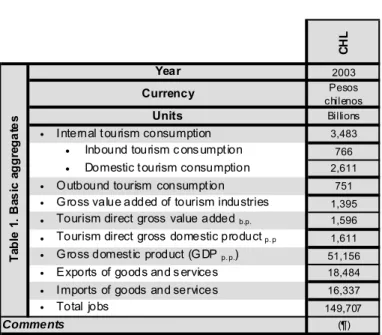
CHL
Q.1 Present stage of implementation:
The TSA in Chile does not form part of the national accounts programme because the institution that prepares the TSA, SERNATUR, is distinct from those that prepare the latter. Nevertheless, the results of the TSA are reviewed in the light of those published by the Central Bank, Dept. of National Accounts. The difficulty lies in that these publications are not disaggregated and the breakdown for each tourism characteristic activity is not known. For example, Hotel and similar services as well as Restaurant and similar services appear together with Retail. The same is true of transport services, which are not broken down by type of transport.
Nevertheless, for the reference year of the TSA, it was possible to analyse it at the level of each Tourism Characteristic Activity, because the Central Bank was also compiling its reference year.
For the subsequent years, the Central Bank has been asked to share part of the basic information for the preparation of the national accounts which are also part of the production accounts of the Tourism Characteristic Activities, stated in Table 5. The reference year is 2003, having made a projection for 2004 in a second exercise. An estimate for 2005 is available.
Q.2 General methodological approach:
The methodology applied in T6, assumes that all supply by TCA is for final consumption (no business tourism consumption). Given that the TSA of Chile does not include an input-output framework, it is not possible to know intermediate demand for the output of such activities. In line with the work on national accounts, although this level is not large, it is necessary to state it explicitly.
Q.3 Institution in charge for compilation:
• Name:SERNATUR.
• Comments: The responsibility for preparing and publishing the TSA belongs to SERNATUR; the funding for it comes from
the Corporación de Promoción Turística de Chile. For the reference year 2003, there was an interinstitutional agreement with the Central Bank and the National Statistics Institute (INE). Both institutions continue to provide basic information requested yearly for the TSA compilation .
Q.4 Basic documentation:
• TSA sources and methods documents: Tourism Satellite Account 2003, Projection 2004, Estimate 2005. Available at
www.sernatur.cl/portalinstitucional/estudios
• Other related publications and studies: Inbound Tourism Behaviour, various years, same website.
Q.5 Dissemination formats of TSA data:
Q.6 Person in charge for TSA:
• Name: Cecilia Arias De Pol.
• Title: Commercial engineer.
• Organization: SERNATUR.
• E-mail:
• Name: Gabriela Morales Concha.
• Title: Commercial engineer, consultant.
• Organization: SERNATUR
• E-mail:
CHN
Q.1 Present stage of implementation:The Jiangsu TSA is a provincial TSA, using 2002 as the reference year, JSTSA-2002 is a
full-fledged TSA, including all the accounts recommended by the TSA: RMF except tables 8 and 9. The JSTSA-2002 is an adaptation of the international guidelines to the Chinese context.
Q.3 Institution in charge for compilation:
• Name:Jiangsu Provincial Tourism Bureau, & Xian Jiaotong University
• Comments: Inter-institutional cooperation between the government and research institute is necessary.
Q.4 Basic documentation - TSA sources and methods documents:
• Research group for Jiangsu Provincial Tourism Satellite Account (2006). Report for Jiangsu Provincial Tourism Satellite Account (JSTSA-2002). Nanjing: Jiangsu People’s Publishing House.
• Research group for Regional TSA guidelines (2006). Guidelines for regional Tourism Satellite Account in China (2005).
Nanjing: Jiangsu People’s Publishing House.
Q.6 Person in charge for TSA:
• Name: H Name: Mingyao Li.
• Title: Deputy Director.
• Organization: Jiangsu Provincial Tourism Bureau.
• E-mail:
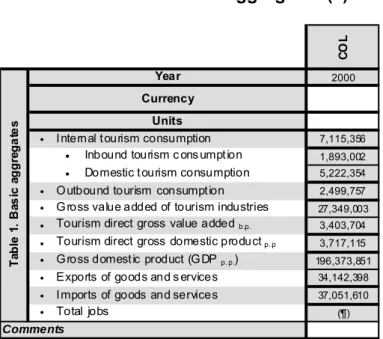
COL
Q.1 Present stage of implementation: A first exercise for year 2000 integrated with the national accounts annual program of
work has been developed. A second exercise for year 2005 is underway.
Q.3 Institution in charge for compilation:
• Name:Departamento Administrativo Nacional de Estadística – DANE.
Q.4 Basic documentation:
• TSA sources and methods documents:
• Other related publications and studies:
Q.5 Dissemination formats of TSA data- Electronic – Internet:
• Website:
• Table reference/title
• Language(s) Spanish.
Q.6 Person in charge for TSA:
• Name: Humberto Mora.
• Title: Coordinator of Regional and Satellite Accounts.
• Organization: DANE.
• E-mail:
CRI
Q.1 Present stage of implementation:The information of the tables of the Tourism Satellite Account is not available, as work is
being done on the creation of an experimental account.
Q.3 Institution in charge for compilation:
• Name:Costa Rica Tourism Board.
• Comments: 1st Interinstitutional Committee: Institute for National Statistics and Census; Costa Rica Tourism Board; Central
Bank of Costa Rica and Directorate-General for Migrations. Q.4 Basic documentation:
• TSA sources and methods documents:
• Other related publications and studies:www.visitecostarica.com
Q.5 Dissemination formats of TSA data- Comments: There has been no dissemination of the results.
Q.6 Person in charge for TSA:
• Name: Orlando Muñoz Recalde.
• Title: Information Management.
• Organization: Costa Rica Tourism Board.
• E-mail:
Q.1 Present stage of implementation:An exercise was carried out in 1997 and was part of the calculations of the change of the
base year for the National Accounts. Since then, the collection of information has proceeded as well as the calculation of relative indicators that are used for different purposes, even when they are not, strictly speaking, placed within the format of TSA tables.
Q.2 General methodological approach: For the TSA the information collected as part of the System of Statistical Information
(SIE-N) was used, as well as the accounting records of tourism entities, specific research on activities such as transport, private accommodation, and certain other specific studies, with the aim of complying with the TSA-RMF.
• TSA sources and methods documents:
• International Movement of Passengers. • Receipts from International Tourism. • Accommodation at tourism facilities. • Selected Accounting Indicators. • Indicators of Average Occupancy.
• Other related publications and studies:
• International visitor arrivals (Monthly).
• Main International Tourism Indicators (Quarterly). • Tourism. Indicators by Territory (Biannual). • Cuba’s Statistical Yearbook (AEC)(Annual). • Economic and Social Outlook of Cuba (Annual).
• Comments: The forms, as well as the methodological indications and the publications are available on ONE’s website:
Q.5 Dissemination formats of TSA data:
• Hard copy - Annual publication:
• Title: Statistical Yearbook of Cuba (AEC).
• Language(s): English and Spanish.
• Electronic – Internet – Website:
Q.6 Person in charge for TSA:
• Name:María Isabel Arocha Santana.
• Title: National Statistician “A”
• Organization: National Statistics Office (ONE)
• E-mail:
CYP
Q.1 Present stage of implementation: TSA tables 1 to 6 are available from 2003 to 2006 and we are currently working on the
TSA tables 7 to 10 for the same years.
Q.3 Institution in charge for compilation:
• Name: Statistical Service of Cyprus.
• Comments: The TSA project was implemented with the cooperation of CTO (Cyprus Tourism Organisation) and the Central
Bank of Cyprus. Q.4 Basic documentation :
• TSA sources and methods documents
• Survey On Passenger Departure
• Survey On Passenger Arrivals –
• Survey On Outbound Arrival • Household Budget Survey • Supply And Use Tables
• Other related publications and studies:
Q.6 Person in charge for TSA:
• Name:Dora Kyriakides.
• Title: Chief Statistics Officer.
• Organization:Statistical Service of Cyprus.
• E-mail:
CZE
Q.1 Present stage of implementation:
TSA tables 1 to 7 are fully covered whereas table 10 is only partially covered.
TSA tables are compiled annually and data for years 2003 to 2006 are available. All data are preliminary and will be revised. In addition to the 10 tables recommended in the TSA, a Tourism Employment Module is compiled.
Q.2 General methodological approach:
TSA figures are calculated only at national level, no regional breakdown is available at the moment.
Only direct effects are measured and published. Indirect effects are not calculated. Leisure activities are not considered either.
Q.3 Institution in charge for compilation:
• Name: Czech Statistical Office.
• Comments: The Czech TSA is compiled by Czech Statistical Office in cooperation with the Ministry for Regional
Development which finance border surveys for the measurement of inbound tourism Q.4 Basic documentation:
• TSA sources and methods documents:
• The Czech TSA
Czech TSA is available only in Czech language; tables with results are available in Czech/English version).
• The Czech Natio
• Other related publications and studies:
Q.5 Dissemination formats of TSA data:
• Hard copy – Other (s):
• Title:
“Tourism Satellite Account in the Czech Republic 2003-2005”.
(Methodology and tables of the Czech TSA; data in this publication have already been revised)
• Periodicity: Irregular.
• Language(s): Czech.
• Electronic – Internet:
• Website: http://www.czso.cz/csu/redakce.nsf/i/tabulky_satelitniho_uctu_cestovniho_ruchu (the most important source of