Economics Master's thesis Daniel Palander 2015 Department of Economics Aalto University School of Business Powered by TCPDF (www.tcpdf.org)
Abstract of master’s thesis
Author Daniel Palander
Title of thesis An economic value chain analysis of Namibian diamonds Degree MSc
Degree programme Economics
Thesis advisor(s) Pertti Haaparanta, Matti Liski
Year of approval 2015 Number of pages 140 Language English
PURPOSE OF THE STUDY
The Offshore Development Company under the Ministry of Trade and Industry in Namibia initiated this study to assess the suitability of value chain analysis as a tool for identifying local beneficiation possibilities in the Namibian mineral sector. Diamonds are an important contributor to the Namibian GDP and export earnings and were thus chosen as the study subject. The purpose of the study is twofold; to create knowledge on how value chain analysis can be applied to mineral sector research in Namibia, and to carry out a descriptive analysis of Namibian diamond industry value creation.
A literature review of value chain analysis is carried out, as well as a review of global diamond industry studies to set the case of the Namibian diamond industry into perspective.
RESULTS
The Namibian diamond value chain is divided into four stages of processing: (1) rough diamond mining, (2) sorting, valuating and trading of rough diamonds, (3) cutting and polishing of rough diamonds, and (4) jewellery manufacturing and retail. Diamond mining produces gem quality diamonds for the global jewellery end market and is found relatively successful in creating national value added. The main incentive for cutting and polishing companies to locate in Namibia is the access to rough diamonds. Namibia is currently not competitive in productivity terms in this middle part of the chain where companies create substantial revenues but low value addition due to limited local processing and global market realities. Locally active cutting and polishing companies sell only a small share, approximately 0,4 %, of their output as inputs to Namibian jewellery manufacturers. Despite low volumes of inputs, the end of the chain is able to create the highest per carat value addition and revenue increases in the chain. This is in line with global industry studies indicating that largest margins are created in the beginning and end of the chain. Calculations suggest that increasing the volume of Namibian origin diamonds reaching local jewellery manufacturing and retail holds substantial local value addition potential. Policy efforts should focus on quality over cost competence and easing the joint search for this in the middle and end of the chain.
Value chain analysis is found to be a viable tool for mapping the creation and distribution of economic benefits at different stages of a particular mineral sector value chain. Assessing relative importance of chain links in national value creation is also possible. The main challenge of value chain analysis is the acquiring of accurate financial input-output data from all chain participants. The creation and collection of such national data for policy building purposes is important.
Table of contents
1 Introduction ... 5
2 Mining and diamonds in the Namibian economy ... 9
2.1 Namibia is a middle income country with an open economy ... 9
2.2 Namibia’s economy is built on mining and minerals drive export income ... 11
3 Theory of value chain analysis ... 13
3.1 Origins, definitions and theory of value chain analysis ... 13
3.2 Value chains are examined through descriptive and analytical tools ... 17
3.2.1 Descriptive tools of value chain analysis ... 18
3.2.1.1 Input-output structure, mapping the chain and financial and economic analysis . 18 3.2.1.2 Geographic concentration ... 19
3.2.2 Analytical tools of value chain analysis ... 23
3.2.2.1 Barriers to entry, trade and rent... 24
3.2.2.2 Governance structures ... 27
3.2.2.3 Systemic efficiency ... 30
3.2.3 Value chain development tools ... 32
3.2.3.1 Benchmarking ... 32
3.2.3.2 Upgrading... 33
3.3 The concept of value ... 34
3.4 Globalization and value chain analysis in policy planning ... 37
3.5 From theory to a limited value chain analysis of Namibian diamonds ... 41
4 A limited economic value chain analysis of Namibian diamonds ... 42
4.1 The global diamond value chain ... 43
4.1.1 The global diamond value chain has eight stages ... 45
4.1.2 High concentration upstream, fragmentation downstream ... 47
4.1.3 Rough diamond sales are carried out through three main channels ... 48
4.1.4 Global diamond trading revolves around six diamond hubs ... 50
3
4.1.6 Global diamond mining is concentrated geographically and company-wise ... 53
4.1.7 Financial analysis of the global diamond value chain... 58
4.2 The Kimberley Process tackles the problem of conflict diamonds ... 60
4.3 The Namibian diamond market and the call for local value addition ... 62
4.3.1 The legislative and policy environment ... 67
4.4 Methodology of research ... 70
4.5 Descriptive analysis of the Namibian diamond value chain ... 75
4.5.1 Mining of rough diamonds ... 76
4.5.2 Sorting, valuating and trading of rough diamonds ... 79
4.5.3 Cutting and polishing of rough diamonds ... 85
4.5.4 Diamond jewellery manufacturing and retail ... 89
4.5.5 A complete depiction of the Namibian diamond value chain ... 94
4.6 Financial and economic analysis ... 96
4.6.1 Employment ... 96
4.6.2 A small volume of Namibian diamonds reach the end of the value chain ... 97
4.6.3 Cutting and polishing creates large revenues but low value addition ... 98
4.6.4 Relative measures of revenue creation and value addition ... 102
4.6.5 Distribution of value added in the Namibian economy ... 104
4.6.6 Value added potential of the diamond jewellery sector in Namibia ... 106
4.7 Industry opinions on characteristics and challenges of the value chain ... 110
4.7.1 Governance structure of the Namibian diamond value chain ... 110
4.7.2 Barriers to entry, trade and rent in the Namibian diamond value chain ... 113
4.7.3 Challenges of rough diamond production and trading ... 116
4.7.4 Challenges of the Namibian cutting and polishing industry ... 118
4.7.5 Challenges of jewellery manufacturing and retail in Namibia ... 122
5 Conclusions ... 126
4 Table of figures
Figure 1: The eight stages of the diamond value chain (Bain & Company, Inc., 2011,p. 19 )... 45
Figure 2: The final market of synthetic diamonds is in industrial applications (Bain & Company, Inc., 2014, p. 34) ... 46
Figure 3: The diamond value chain is concentrated upstream and fragmented downstream (Bain & Company, Inc., 2011,p. 21 ) ... 47
Figure 4: Considering volumes and value shows greater concentration, also downstream (Bain & Company, Inc., 2014, p. 29) ... 48
Figure 5: Major players sell 50-90 % of rough diamonds through long term contracts (Bain & Company, Inc., 2013, p. 31) ... 49
Figure 6: Global diamond trade revolves around six hubs (Bain & Company, Inc., 2013, p. 40) ... 51
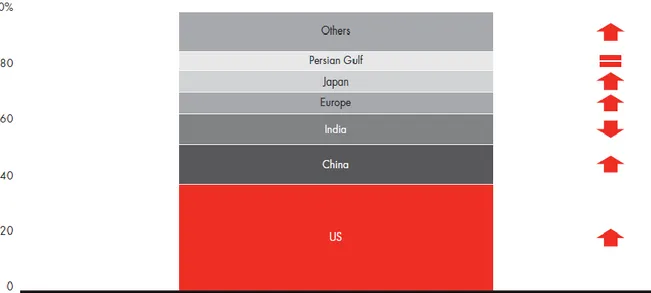
Figure 7: USA, China and India account for approximately 60 % of global diamond jewellery consumption (Bain & Company, Inc., 2014, p. 5). ... 53
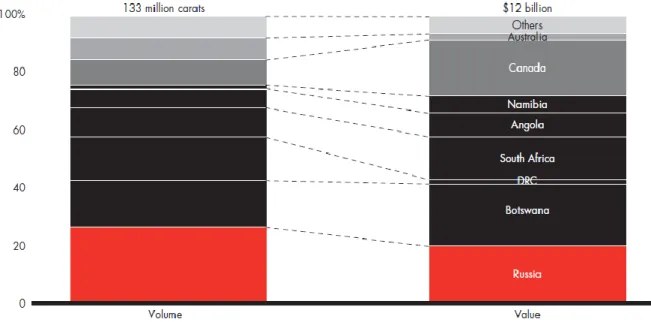
Figure 8: Africa and Russia account for 70 % of global rough diamond output (Bain & Company, Inc., 2011, p. 30) ... 54
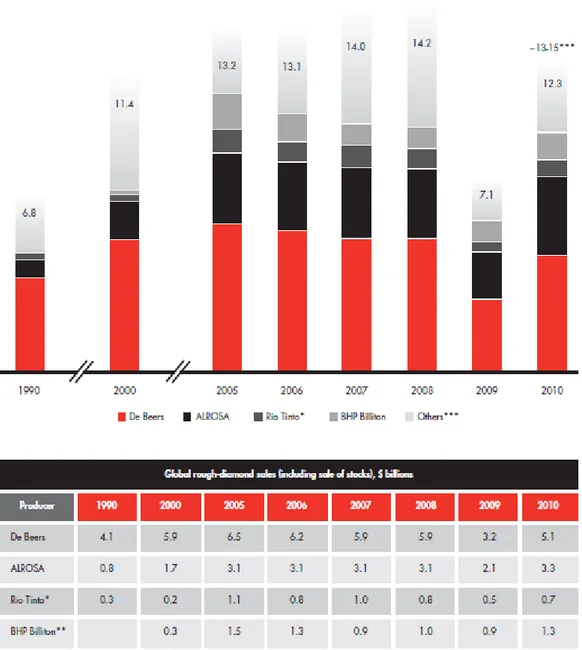
Figure 9: De Beers is the global leader in value of produced rough diamonds (Bain & Company, Inc., 2011, p.31) ... 55
Figure 10: The complete global diamond value chain in 2011 (Sherbourne, 2013, p. 222 )... 57
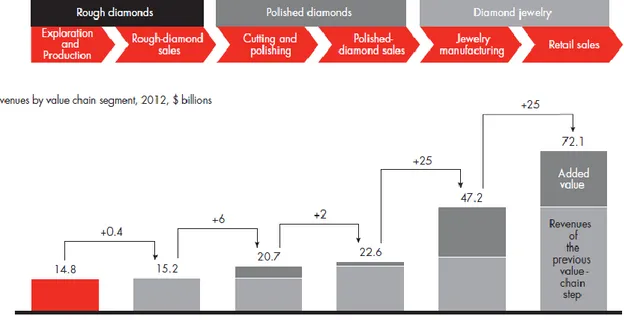
Figure 11: Revenues increase fivefold from rough diamond sales to jewellery retail (Bain & Company, Inc., 2013, p. 3) ... 58
Figure 12: Highest value addition is achieved at the end of the chain (Bain & Company, Inc., 2013, p. 5) ... 59
Figure 13: Highest margins are achieved in mining and jewellery retail (Bain & Company, Inc., 2013, p. 6) ... 60
Figure 14: De Beers and the Namibian government both have a 50 % stake in NamDeb Holdings (Chamber of Mines of Namibia (2013), p. 30) ... 62
Figure 15: Demarcation of the Namibian diamond value chain and the issues analysed ... 70
Figure 16: Financial data collection form presented to value chain agents ... 72
Figure 17: Open question form presented to value chain agents ... 74
Figure 18: Total Namdeb Holdings production of diamonds in carats, 2008-2013 (Chamber of Mines of Namibia, 2013) ... 76
Figure 19: Large diamonds above 2 carats account for 5 % of mining output volume but 50 % of value (Bain & Company, Inc., 2011, p. 34) ... 77
Figure 20: Diamond production in Namibia, crts (2008 – 2013) (Chamber of Mines of Namibia, 2013) (Kimberley Process, 2014) ... 78
Figure 21: Difference of Namdeb output and NDTC sales, 2008 – 2013... 79
Figure 22: NDTC sightholders and annual purchase allocations 2008 – 2011 (Sherbourne, 2013) ... 81
Figure 23: NDTC total and local sales, mNAD (2008 – 2013) (NDTC, 2014) ... 83
Figure 24: NDTC local sales as percentage of total sales, estimated share of aggregated parcels in local sales (2008 – 2013) ... 83
Figure 25: Cutting and polishing companies holding an EPZ licence, NDTC sightholders 2012 – 2015 (ODC and Sherbourne (2013)... 85
Figure 26: Cutting and polishing sample of four companies represent on average 15 % of total local rough diamond sales... 86
Figure 27: Cost structure of global cutting and polishing (Bain & Company, Inc., 2011, p. 45) ... 88
Figure 28: Labour costs account for approximately 77 % of direct cutting and polishing costs excluding price of diamonds ... 88
Figure 29: Global cutting and polishing cost per carat in different regions (Bain & Company, Inc., 2014, p. 14) ... 89
Figure 30: India and China are the largest and fastest growing manufacturers of jewellery (Bain & Company, Inc., 2011, p.49) ... 90
Figure 31: USA dominates the market in demand for diamond jewellery, India and China grow fastest (Bain & Company, Inc., 2011, p. 50) ... 91
Figure 32: Diamond prices vary considerably according to carat size, colour, clarity and cut (Bain & Company, Inc., 2013, p.43) ... 93
Figure 33: Value chain stages, agents, relationships and volume and value flows of Namibian diamonds in 2012 ... 94
Figure 34: Exchange rates for Namibian dollar to US dollar conversions (Bank of Namibia, 2014) ... 96
Figure 35: Employment in diamond mining and cutting and polishing sectors (Chamber of Mines of Namibia, 2013) (NDTC, 2014) ... 96
Figure 36: Carat volumes of Namibian diamonds in each value chain step (2011 & 2012) ... 97
Figure 37: Cutting and polishing creates substantial revenues from NDTC local sales ... 98
Figure 38: Despite substantial revenue creation, cutting and polishing contributes little to value addition ... 100
Figure 39: Volume and value addition trends in cutting and polishing ... 102
Figure 40: Revenue received for an average Namibian diamond carat, USD (2012) ... 103
Figure 41: Value added per carat of output for each diamond value chain step (NAD/crt) ... 104
Figure 42: Distribution of diamond industry value added to actors in the Namibian national economy (2012) ... 105
Figure 43: The potential value addition of the Namibian diamond jewellery sector (2011 & 2012) ... 107
5
1
Introduction
Diamonds are both historically and in the present day debates of national economics a defining topic in Namibia. These discussions are set in the broader scope of the Namibian mining sector, which has pre and post-independence been the main driver of growth for the relatively young nation. With considerable mineral riches in uranium, copper, zinc and lead among others in addition to diamonds, the country is very much part of the ongoing quest of emerging and developing countries to turn nature’s bounty into a foundation of sustainable and inclusive socioeconomic growth within a diversified economy. This thesis is set within the framework of these goals as value chain analysis (VCA) is seen to provide insight into understanding the realities and development possibilities of strategically important sectors of the Namibian economy. The National Planning Commission of Namibia (NPC) has identified value chain analysis as a viable tool for examining future possibilities of the mineral sector and diamonds within the mineral sector as a strategically important industry (NPC, 2004) (NPC, 2008) (NPC, 2012). The NPC’s view on the importance of mining within the national economy is validated by a recent study by Humavindu & Stage (2013), which acknowledges mining as a key sector based on input-output and Social Accounting Matrix (SAM) analyses. The importance of mining in general and diamonds specifically for the Namibian economy is further studied in chapter 2.
Based on the above, the purpose of this thesis is to map economic theory of global production, trade and value chain analysis, find key aspects of how value chain analysis can be applied to the context of Namibia, and carry out a limited economic analysis of the value chain of diamonds in Namibia. The research is carried out in cooperation with the Offshore Development Company (ODC) under the Ministry of Trade and Industry of Namibia (MTI). A definition of a value chain is given by Kaplinsky & Morris (2002): “The value chain describes the full range of activities, which are required to bring a product or service from conception, through the different phases of production (involving a combination of physical transformation and the input of various producer services), delivery to final consumers, and final disposal after use”. It is already evident in this definition that the act of production itself is only a part of value chain analysis. Roduner (2005) further emphasizes this aspect by stating that the value chain as a concept tries to understand the vertical integration and linkages of production and distribution processes. This description highlights the importance of discussing economic theory and empirics parallel to more pragmatic value chain analysis literature, as it brings required substance depth to the various complex matters VCA intends to tackle. It will
6
be shown that the fall of transportation costs coupled with scale effects produces regional differentiation (Krugman & Venables, 1995) but also increase the complexity of production, which gives rise to coordination and communication costs that affect integration of production sometimes in the opposite direction, raising the importance of proximity (Baldwin in WTO, 2013). This dispersion affects countries with different levels of costs and technology quite differently, with claimed benefits very often ambiguous (Li & Liu, 2014) (Baldwin & Robert-Nicoud, 2014). These effects must also be measured empirically in multiple new ways, which then result in conclusions parting from conventional wisdom on e.g. trade balances, gain distributions and advantages of developing countries participating in global production (Hummels;Ishii;& Yi, 2001) (Daudin;Rifflart;& Schweisguth, 2011) (Baldwin & Lopez-Gonzalez, 2013) (Kümmritz, 2015). In addition to geographical dispersion complex production processes and their participants are affected in a multitude of ways through technological change. Again, these effects vary depending on the local or global scope of the technological change, what part of the chain is examined and what kind of transmission means the change has (Costinot;Vogel;& Wang, 2013). Also, standard models and their variations show that from a system-wide efficiency perspective individual companies may make inefficient decisions due to coordination failures, the size of the value chain or limited information on other chain participants (Baldwin & Venables, 2013). Combined, these aspects of practical and theoretical analysis offer a comprehensive picture of value chains within the framework of global production, trade and development. It is these linkages and the actions and relations of actors in the chain this thesis goes on to study within the diamond industry of Namibia.
In essence, VCA is both a descriptive and an analytical tool (Kaplinsky & Morris, IDRC, 2002). A descriptive or heuristic tool helps in understanding what the world is like, and from this perspective VCA describes which actors are present in the chain, what activities they carry out, what kind of flows of goods, services and money they create, and what are the revenues received and costs incurred. Aggregating this actor specific data paints a picture of the importance of the different steps of production with regard to value creation, employment and national and international linkages. Secondly, VCA seeks to understand the stages where the economic activities are acted out and thus answers the question of why the world is organized as it is found to exist. These business environment issues are key analytical constructs in understanding how value is created and distributed in modern global value chains. There are two main categories for analysing the economic environment. First, barriers to entry, trade and rent focus on entities limiting the possibilities of actors to enter, exit and exist within value
7
chains. These are closely linked to capabilities of companies and countries active within the chain and also arise from competitive forces as suggested by the capability window of Sutton (2007b) where a threshold of quality is created under which companies cannot sell even by lowering prices. On a broader level it is then related to the suggestions of Neary et al. (2015) who state that on the long run the cost versus quality trade-off does not exist. The second category discusses governance structures examining the relative power of actors to influence the nature of the entire chain and the inter-firm division of tasks, capital, capabilities and value (Gereffi & Korzeniewicz, 1994). Again, from a more general perspective governance is related to aspects of contractual agreements and the economics of the firm and the market (e.g. (Baker;Gibbons;& Murphy, 1994) (Williamson, 2005). Based on both descriptive and analytical tools, VCA suggests ways of developing the value chain, namely through different forms of benchmarking and upgrading. Chapter 3 broadens and deepens these stylized aspects of VCA by carrying out a literature review.
The theoretical foundation mapped in chapter 3 paves the way for an empirical study of the Namibian value chain of diamonds in chapter 4. In this case study the diamond value chain is divided into four steps: (1) production of rough diamonds, (2) sorting, valuating and trading of rough diamonds, (3) cutting and polishing of rough diamonds, and finally (4) jewellery manufacturing and retail. The case study is limited to Namibia and mostly remains in the sphere of descriptive analysis, namely mapping active companies, trade flows, revenues and costs as well as employment effects. Analytical tools – barriers to entry, trade and rent as well as governance structures – are nevertheless touched upon, as the analysis involves descriptions of the legal and market environment, relative powers of chain actors and measures of these actors in affecting the distribution of activities, capabilities and rents within the chain.
The Namibian case is set into perspective with comparison to the recent global diamond industry analysis (Bain & Company, Inc., 2011) (Bain & Company, Inc., 2012) (Bain & Company, Inc., 2013) (Bain & Company, Inc., 2014) (McKinsey & Company, 2014). These industry analyses contrast and complement the Namibian case where a slightly modified value chain depiction is used as the Namibian diamond industry bears certain peculiar characteristics. The global value chain is often divided into at least six steps, whereas the Namibian chain is better described by a four step structure following a division of meaningful company and activity boundaries. The data collected in Namibia in 2014 in cooperation with the ODC includes financial and economic data from the single oligopolistic actor, NamDeb Holdings, who governs the two first steps of the Namibian chain; rough diamond production, and sorting,
8
evaluating and trading of rough diamonds. Data on cutting and polishing of rough diamonds was received from four companies. A case example of a jewellery manufacturing and retail company paints a crude but vital picture of the realities of an end of the chain actor in Namibia. The fact that at least some responses were uncovered for all steps of the value chain provides important foundations for future research and allows for at least a partial view of the challenges present throughout the chain. This is an important consideration as the thesis is intended to function as a prefeasibility study into VCA in the context of Namibian mineral sector industrial development, and is thus more concerned with formulating the right questions and tools for industry benchmarking and upgrading than providing exact answers and policy interventions. Initial findings and opinions of chain actors on upgrading are reported under the case example. Chapter 5 concludes and discusses possibilities for future research. The bibliography of sources is presented in chapter 6.
9
2
Mining and diamonds in the Namibian economy
This chapters frames the later value chain analysis by providing information on the Namibian economy in general and on the importance of the mining sector and diamonds in particular. The economics of diamonds in Namibia, with background on the global diamond industry, how Namibia ties into it, and the relevant Namibian legal and policy structures, are further described and developed in chapter 4.
2.1 Namibia is a middle income country with an open economy
Namibia is located in southern Africa. According to the World Bank (2013) it had 2,303 million inhabitants in 2013 and the GDP in current USD was 12,58 billion, which stands for a per capita figure of 5 462 USD. This positions the country among the upper middle income countries in WB classification. The rise to the middle income group has been recent and fuelled by the fast GDP growth throughout the 2000s. The pre-financial crisis annual GDP growth figures for 2002-2008 averaged 5,7 %, and also rebounded quickly after a contraction of 1,1 % in 2009 to 6,3 % in 2010. Since then growth has been steady, with yearly figures between 4 – 5 % and future projections indicating similar numbers. (OECD/AfDB/UNDP, 2014). An important characteristic of the Namibian economy, and a consideration to be kept in mind parallel to high growth figures, is the fact that Namibia has one of the most unequal income distributions on the African continent, with a Gini coefficient of 0,63 (Humavindu & Stage, 2013). The Humavindu & Stage figure however seems to be from as far back as 2003 with a drop witnessed since to 0,61 by 2009, which according to the World Development Indicators is the latest figure (World Bank, 2015). The inequality issue has been targeted in national plans, and according to the Vision 2030 (NPC, 2004) the final goal is at an ambitious 0,3. During the NDP3 term the goal of 0,58 was reached, but the gap between the poorest and the richest income groups only narrowed marginally (NPC, 2012). The country also continues to battle with high unemployment, which stood at 36,7 % in 2004, 51,2 % in 2008 and 27,4 % in 2012 (Namibia Statistics Agency, 2013). The national unemployment estimates, however, deviate quite significantly from the modelled ILO estimates, which in 2012 and 2013 stood at 16,7 % and 16,9 % respectively. In addition to unemployment and the previously noted high income differences, absolute poverty is also a serious concern for Namibia. For 2011 the World Bank (2015) figures state that 15,9 % of the population lived on under the USD 3,10 a day and 9,7 % on less than USD 1,90.
10
From another angle on the least privileged sections of the population, the child poverty rate reached 34,4 % in 2009/10 (Namibia Statistics Agency, 2013). In this regard the Namibian economy is very dualistic in nature, with a modern market sector based on capital intensive industrial production on one hand, and a traditional subsistence farming sector on the other (Humavindu & Stage, 2013).
When looking at foreign trade, it is evident that Namibia has a high degree of openness with a trade to GDP ratio of 84,7 % in 2012 and in general a rate that has hovered in the vicinity of 90 % (OECD/AfDB/UNDP, 2014). Namibian trade policy is to a great extent governed by the South African Customs Union (SACU) Common External Tariff. Historically the main trade destination for exports has been South Africa, but in 2013 the peak position was handed to Botswana, with South Africa second and the European Union third. This development and sudden change is, in fact, quite relevant in the scope of this thesis as the main reason was the decision of the global diamond giant De Beers to relocate its main diamond trading centre from South Africa to Gaborone in Botswana, which turned the flow of rough diamonds from Namibia to the new destination (OECD/AfDB/UNDP, 2014).
Trade destinations aside, an important characteristic of Namibian foreign trade has for years been a positive current account balance, which is offset by a deficit on the capital and financial account side. Namibia has thus for a long time been an exporter of capital with excess savings, setting it in quite a different situation in comparison to most other developing countries. Capital scarcity is in this regard not a major concern for Namibia; if good investment opportunities arise, domestic savings are available for such projects (Humavindu & Stage, 2013). It has to be stated though, that the trade balance is in fact negative and only pushed to positive by SACU based current transfers, namely duties and tariffs levied on imports from outside the SACU area distributed among the member countries. These transfers have been dropping in relative importance, which according to the national accounts has even turned the overall current account balance to deficit and the capital and financial account to surplus since 2009 (Bank of Namibia, 2014). The same trend, though pushing the overall current account balance to deficit only in 2013, is also visible in the OECD data (OECD/AfDB/UNDP, 2014).
11
2.2 Namibia’s economy is built on mining and minerals drive export income
Mining has historically been a fundamental building block of the Namibian economy. Oldest written accounts of mineral riches in Namibia date back to 1761, and in 1790 gold and copper were found in the area of modern day Rehoboth. The first copper mine was established in 1856 near Windhoek, but it took until 1906 for Namibia to work its way to the world map of mining when the copper mine of Otavi Mienen und Eisenbahn Gesellschaft (OMEG) was established in the Otavi region. The finding of diamonds near Lüderitz on the Southern coast in 1908 was also a momentous turning point, which set in motion the long history of diamond mining in the country. It is from this history the nation inherited a well-established mining industry as it gained its independence in 1990. Vast deposits of diamonds and uranium along with copper, zinc and lead were mined by international mining giants De Beers, Anglo American, Rio Tinto among smaller companies. At this stage the industry contributed around a fifth of total national production and employed more than 14 000 people. (Sherbourne, 2013).
Since the first steps of the nation, the importance of mining to the Namibian economy has been gradually diminishing, but remains a strong backbone of the industrializing country. Calculated at the current prices of 2013, the average GDP contribution of mining and quarrying from 1990 to 2012 has been 10,4 %, and has also in the past few years been rather steady around the 10 % mark (Bank of Namibia, 2013) (National Statistics Agency, 2013). When it comes to employment, the absolute numbers of employment by the mining industry have not, in fact, changed significantly from the early years of independence. What is a significant structural characteristic, though, is that the industry contributing a tenth of national production only employed 1,8 % of the work force at the time of the last available labour survey in 2012, in absolute terms 11 240 people (Namibia Statistics Agency, 2013).
Within the production of minerals, diamonds are undeniably in the league of their own, alone contributing on average 7 % to total GDP in current prices of 2013 during the time of independence from 1990 to 2012. Save a dip below 4 % in 2009, the contribution has also remained relatively stable in recent years, rebounding to an above average 8,36 % in 2012 (Bank of Namibia, 2013). The importance of these precious stones to the nation’s economy becomes even more evident when foreign trade is examined. Within the time window of 2004 – 2013 minerals and ores accounted for, on average, 57 % of total exports, out of which diamond exports alone were 49 %, thus standing for 29 % of total exports. Even though slightly lower, the average export contribution for diamonds alone in more recent 2010 – 2013 was still 22 %, giving a relatively stable rule of thumb that roughly a quarter of Namibian export
12
earnings are pulled in by diamonds. (Bank of Namibia, 2014). What becomes evident for diamonds later in the analysis, and very much applicable to ores and minerals, is that most raw material commodities are exported out of the country in unprocessed or semi-processed form (Humavindu & Stage, 2013).
Due to the current importance of the mining sector, but also to still untapped possibilities available from natural riches, the mineral sector has been targeted as a strategic sector in the Namibian policy sphere. Humavindu & Stage (2013) argue that unlike in the past where the Namibian government has aimed at developing industries across the board, sector identification and selection is increasingly important. It is evident from the National Development Plan 4 and the latest Namibian Industrial Policy that a sectoral approach is indeed chosen to guide the nation towards an industrialized future as envisioned in the Namibian Vision 2030 (NPC, 2012) (Namibian Ministry of Trade and Industry, 2012). The relevance of this to the thesis at hand is that mineral beneficiation, fundamentally local value addition of minerals within the manufacturing industry, is stated as a strategic target within NDP4. Furthermore, a value chain analysis of rough as well as cut and polished diamonds is stated as a concrete tool to further the goal of local value addition. Identified practical goals, discussed further under the diamond value chain findings, include increasing the supply of rough diamonds from the present 10 % to 20 % and enabling Namibia to become a larger producer of jewellery (p. 101, NPC, 2012). A detailed account and further discussion on the history of local value addition and the relevant legal and policy structures are found in chapter 4.
In this instance it is beneficial to state that the choice of mineral processing as a strategic target for industrial policy development is contested by the key sector analysis of linkages within the Namibian economy carried out by Humavindu and Stage (2013). At the present moment mining is identified as a key sector for labour income, but this is rather a result of the absolute size of the sector than a reflection of the sector’s forward and backward linkages. When linkages are considered, transport and communications and certain sectors of manufacturing are rather identified for positive policy support returns. Humavindu & Stage do, however, make some cautionary notes due to the nature of the Namibian economy. As the economy is small in absolute terms and many sectors only consist of a few companies, entries and exits of single companies may largely affect the linkages and the relative importance of those sectors. The small size also means that if rapid expansion happens, especially within the present larger sectors, such as mining, domestic markets might struggle to meet the input demands of the suddenly growing industries due to capacity constraints.
13
3
Theory of value chain analysis
3.1 Origins, definitions and theory of value chain analysis
The early origins of VCA can be seen in Leontief’s input - output models of the 1950s and regional economic research of the 1960s, which focused on industrial linkages and spatial relations of regions and economies. The concept of value chains was also used in the 60s and 70s in charting and analysing the paths of development for mineral exporting economies (Girvan, 1987). Another relevant strand of economic research is Wallerstein’s (1974) World Systems Theory, which has contributed to e.g. the global commodity chains thinking of Gereffi et al. (1994). In the 1980s the previous work on value chains was followed by that of Michael Porter, who used the concept in describing how individual enterprises would be able to obtain competitive advantage by upgrading specific parts of its value-creating activities (Rudenko, 2008). Porter also developed the idea further to explain how the same break-down could be used to upgrade national capabilities in relation to global competitiveness (Kaplinsky, 2000). A more recent body of work and approach to value chains is the above mentioned global commodity chains school of thought, which begun in the work of Gereffi et al. (1994) borrowing much of its thoughts from world system analysis. It is these later developments of the past 20-30 years, building on a long lineage of research, Roduner (2005) describes as a systematic attempt within the English-, German- and French-speaking research communities to describe and analyse the vertical integration and disintegration of production and distribution processes in the global context. It is in support and contrast additional definitions of value chains are in order.
In its simples form a value chain is defined in the work of Schmitz (2005) as “the sequence of activities required to make a product or provide a service”. This definition is, however, only a starting point and requires further development to become relevant for analytical and policy purposes. In the modern production and distribution process context it is firstly useful to add the term global to describe the fact that value-adding activities of individual products are often carried out in different parts of the world. A second consideration, and an important assumption to justify also the relevance of this thesis, is that some activities and stages in the chains add more value than others. Thirdly, continuing on the previous assumption, some actors in the chain have more power than others and are thus able to govern and capture more value than others. Another commonly accepted and initially more thorough definition of value chains comes from the work of Kaplinsky and Morris (2002): “The value chain describes the full
14
range of activities, which are required to bring a product or service from conception, through different phases of production (involving a combination of physical transformation and the input of various producer services), delivery to final consumers, and final disposal after use”. Also in this definition is seen that the act of production is only one aspect of value addition. Roduner (2005) emphasizes this further by defining the value chain as “a sequence of organizations that are involved in consecutive production activities”. In these definitions the idea of tracking the path of a product from raw materials through production and consumption to disposal is very much present with an important addition of analysing the relationships of organizations involved in the production.
In addition to the above definitions of value chains that look at production from organizational perspectives it is important to see how economic theory and empirics look at value chains. As the scope of this thesis is ultimately in studying how countries, particularly developing countries, participate and are affected by value chains, literature is summarized from this perspective.
As stated by Kümmritz (2015) theoretic literature relevant in the context of this thesis mainly discusses a setting where a global value chain (GVC) is set up between a lower technology low-wage country, often called “South” in models, and a technologically more sophisticated high-wage country, “North”. These differences in labour costs and technology levels create incentives for dividing tasks between the two countries or production locations. North benefits from South’s lower labour costs, but also from increased specialization as it is able to concentrate on those tasks it has core competence in. Together these create productivity improvements for North. Similarly, South also gains from specialization, but in addition from technological development, which materializes through learning-by-doing or spillover effects. Theories are, however, to some extent in disagreement on gains of GVC participation. Some notes on these follow.
A theoretical model by Li & Liu (2014) describes how a global value chain evolves over time. In their model both North and South move up the global value chain, but the modes of obtaining this shift differ. Furthermore, the gains in the case of North actually depend on initial conditions. To summarize Li & Liu, North offshores some tasks to South where factor prices are lower. These tasks are within or marginally beyond the technological reach of South, which in fact sets in motion a learning-by-doing technological improvement process that makes the offshoring of more tasks possible. The process continues until production converges to a steady
15
state. In this way South has obtained a move higher in the value chain by carrying out more and increasingly sophisticated tasks, whereas the gains realized by North follow from specializing in fewer but highly sophisticated tasks. The ambiguity of the overall effect for North follows from the fact that before the steady state is reached there is a period during which Northern welfare is actually decreasing. As an increasing number of tasks shift to South there is a downward pressure on Northern wages due to constant factor endowments. This negative terms of trade effect may push the aggregate benefit of higher GVC participation also to negative.
Baldwin & Robert-Nicoud (2014) introduce a model where in contrast to Li & Liu (2014) the benefits to South are ambiguous. Similarly to the above model North is technologically superior, but shifting tasks to South is advantageous due to exogenous variation in trade costs. What occurs is that the North is able to use its more sophisticated technology with lower wages of South. Northern terms of trade improve in addition to a rise in Northern output, which follows from the fact that North’s effective labour endowment increases when tasks that were before carried out in North are now performed by South. The ambiguous gain for South follows from this as the previous should lead to a proportional decrease in Southern output. This result is, however, not set in stone as Baldwin & Robert-Nicoud also introduce a variant of their model where technological spillovers give rise to overall output in both countries as technologies converge. Kümmritz (2015) also poses a further important comment, especially for the developing country context, whereby research on absorptive capacity shows that spillover effects require a fostering environment, which might not be the case for low and middle income nations.
Taking into consideration the above summarized theoretical context, Kümmritz (2015) proposes that irrespective of the exact mechanism GVCs have the possibility of generating gains for participating countries, and that the final answer needs to be approached through empirics. Kümmritz seeks to answer the question using two sources of data, the World Input-Output Database and the OECD Inter-Country Input-Input-Output tables, that extensively cover nations at different levels of development. His paper ultimately studies the effect of GVC participation on the domestic economy of countries. Firstly, he finds that the higher the GVC participation the higher the industry-level domestic value added. Second, his analysis indicates that the positive effects of participation in GVCs is independent of the position of countries within the GVC, meaning that both selling and source countries benefit from forward and backward linkages. On a further note, however, he finds that high income countries benefit
16
more from sales linkages while middle-income country benefit is higher from backward linkages. A third key finding highly relevant for this paper is that low-income countries seem to have no gain effect from GVC participation. Kümmritz, however, does treat this result with care as the data only shows that the countries in the sample have on average not benefitted, and it cannot be stated that none of the countries would have gained from GVC participation. In addition to above presented basic theoretic background and empirical findings following from them, some notes on more general GVC literature is in order. The above discussed Kümmritz (2015) paper is particularly relevant for this thesis as it deals in benefit gains of individual countries, but the more general empirical findings on GVCs focusing on measures of participation and the development of GVCs over time are important to set the stage of global trade changes captured by value chain research.
One of the primary GCV participation measures used was developed by Hummels, Ishii & Yi (2001) who studied the OECD IO tables of 35 industries in 10 countries from 1970 to 1990. They coined the so called vertical specialization (VS) measure, which calculated the foreign value added content in exports of sample countries. Hummels et al. found that during the data time span VS had grown an average of 30 % and was also responsible for most of the total export growth of the sample countries. The Hummels et al. VS measure was further formalized by Daudin, Rifflart & Schweisguth (2011), who calculated the VS1 measure, which reveals the share of domestic value added in foreign exports. Daudin et al. figures also confirm that countries are increasingly taking part in GVCs. More recently, and similar to the Hummels et al. approach, Baldwin & Lopez-Gonzalez (2013) studied the World Input Output Data from 1995 to 2009 to find three measures uncovering GVC patterns. The import content of exports is in essence the same as VS, whereas import content of production and factor content trade reveal new constructs in global trade. The sample data confirms the importance of GVCs as production is more and more international.
Measuring trade balances also changes as global trade is increasingly best understood through value chains where goods may cross national borders in various phases of completion. Johnson & Noguera (2012) show that compared to trade balance calculations in gross terms, value added balances put bilateral trade in very different light with often much lower imbalances. As an example Johnson & Noguera state the US-China relationship, where the trade imbalance in VA is up to 40 % smaller than in gross terms. This fact of trade being more and more in value added instead of gross terms has other important implications. Timmer, Erumban, Los, Stehrer &
17
Vries (2014) show that world trade organized in GVCs shifts the factor composition of production away from unskilled labour and favours skilled labour and capital. Also, studied from the value added perspective, countries’ revealed competitive advantage (RCA) differs substantially from standard RCA characteristics.
This section has set a backdrop to value chain analysis as understood through definitions, relevant theoretical models and empirical findings confirming that value chains are relevant in describing and analysing modern trade. The above outlined research does, to some extent, surpass the scope and depth of this thesis. The main aim is to study the national diamond value chain in Namibia and as such this study will not analyse e.g. the measures of GVC participation of Namibia. Relevant aspects are however discussed, particularly as some remarks are made on initial policy suggestions.
The above definitions, models and empirical findings can be used to identify key aspects and determinants of value chains that give rise to analytical constructs within value chains. These determinants are now collected from different strands and schools of value chain analysis to give a better view into the topic of VCA and to arrive at a more focused map on how this thesis analyses the Namibian diamond value chain.
3.2 Value chains are examined through descriptive and analytical tools
As pointed out in the introductory chapter to the thesis, value chain analysis offers both descriptive and analytical tools, where descriptive aspects try to explain what the world studied is like, whereas analytical considerations delve deeper into the questions of why the world is structured as perceived. From these present state descriptions it is still possible to separate tools of how to bring about change in existing and future value chains. (Kaplinsky & Morris, 2002). In this chapter heuristic or descriptive tools of input-output structure, chain mapping and
geographic concentration are introduced.
The change of value chain analysis from a heuristic tool to an analytical construct is done through studying governance structures, barriers to entry, trade and rent and systemic efficiency.
In reference to ways of changing value chains, the tools of benchmarking and upgrading are discussed.
The chapter closes with discussion on the concept of value, key methodological considerations and the global importance of value chains for policy planning.
18 3.2.1 Descriptive tools of value chain analysis
Mapping and describing the way a value chain is structured is in itself an important task as it provides a framework of what data to gather for further analysis. The tools used and the information extracted are thus a fundamental building block of more sophisticated analysis. Knowledge of why the world exists as witnessed – studied through analytical tools – has to be preceded by an accurate vision of what the world is like – studied through descriptive tools. 3.2.1.1 Input-output structure, mapping the chain and financial and economic analysis The basic starting point for understanding a value chain begins with tracking the flow of raw materials, intermediate goods and finished products and how these are linked to knowledge in in the process of value creation (Rudenko, 2008). In addition to defining and tracking the flows of components that comprise the final goods, this determinant also involves the mapping of the chain, meaning the division of production into stages and activities and assigning these to individual companies or agents and actors as they are often called. In many cases the various activities and stages can be grouped into principal functions that simplify the chain and can be represented in e.g. a commodity flow chart. At this stage the value chain is thus a simple flow chart describing the flow of components and activities as they are transformed into final goods by a group of actors holding varying capabilities within principal functions. The mapping should also include some reference to the nature of ties the agents have with one another. In addition to the flow of goods in the chain, financial analysis is here also regarded as part of input-output analysis and thus descriptive tools. What volumes are moved at what prices, entailing what costs as well as destinations of goods and monetary flows are here considered as part of this stage of value chain analysis (McCormick & Shmitz, 2001) (Kaplinsky & Morris, 2002).
In the case of the Namibian diamond industry structure identification and mapping produced a relatively straight forward four principal function or stage structure with rough diamonds being the raw material turned into diamond jewellery. This structure, including the companies involved, their activities, financial flows and ties are described and analysed in chapter 4.
19 3.2.1.2 Geographic concentration
Geographic concentration refers to the global and regional dispersion of activities and to characteristics that determine which actors carry out these activities (Rudenko, 2008). Value chain analysis is closely related to a lineage of economic discussion and theory, which looks at the way production choices are made with respect to concentration or dispersion of benefits following from scale economies, transportation and trade costs and factor endowments. As Krugman & Venables (1995) state, conventional wisdom has long argued that while particular groups within economies can suffer from global integration of production, it in the aggregate benefits all nations. Critics of this view have on the contrary posited that integration creates winners and losers within nations giving rise to increasing inequality. On the global scale, then, the world economy will be divided into a rich core and a poor periphery where the wealth of the former comes at the expense of the latter. A much later opposite continuation of this unequal distribution of benefits argument is that, in fact, globalization is primarily advantageous to the periphery and the core bears the cost of this.
To address these opposing cases Krugman &Venables build a theoretical model where regional differentiation is brought about by the interaction of scale economies and changes in transport costs. Their analysis shows that indeed both conventional wisdom and the opposing arguments receive some backing from theory, with the dynamic borne out of phases of shifts in global production and trade. Firstly, the system is brought to a state of division into a core and a periphery only after a certain critical level of integration is achieved. This critical level is in the Krugman & Venables model achieved as transport costs fall from a very high level where regions are virtually self-sufficient in two types of goods, agricultural and manufactured, to levels where trade between them is economical. In addition, relative size differences for any arbitrary reason in e.g. the manufacturing sector produce scale benefits which lead to this type of production gravitating to that region. If transportation costs fall under some critical level, the world will spontaneously organize itself into an industrialized core and a deindustrialized periphery. Even if a slight sidestep to later empirics and theory from a purely theoretical world, this part of the Krugman & Venables model is closely related to what Baldwin discusses under the second unbundling (e.g. WTO, 2013) and the subsequent globalization paradox. Validating the discussed theoretical model, Baldwin states that cheap transportation favours large scale production, which is complex in nature and the coordination of this complexity is made easier by extreme proximity. This actually means that the fall of transport costs brings about a rise in another cost type, namely coordination costs, which makes concentration of production
20
important in more ways than before. Returning to Krugman & Venables, this division leads to unequal development between regions as scale advantages in the industrialized region drive up labour demand and real wages while they are pushed down in the deindustrialized region. In this regard, when differentiation takes hold the income of the core rises at the expense of the periphery.
The dynamic does not, however, end there. If transportation costs still keep falling the gravitational centre of manufacturing starts losing its competitive edge as the periphery offers a lower wage rate. At some point the reverse dynamic takes hold as lower labour costs more than offset the location and transportation costs. Again a temporal leap to Baldwin is relevant. Baldwin notes that up until the mid-1980s the wage differences between the developed and developing nations had grown vast, which made the geographical dispersion of production profitable. The second key ingredient alleviating the coordination of complexity problem was ICT. Together wage differentials, still falling transportation costs and ICT coordination technologies began to melt the glue of proximity, which led to globalization’s second unbundling as coined by Baldwin. In the Krugman & Venables model, a convergence of wages between the core and the periphery also follows. In this way the advantage of the core has eroded and the income growth of the periphery may happen at the expense of the core.
Technological change as described by Baldwin and the subsequent possible welfare loss of the core in the final phase of the Krugman & Venables model receives partial backing from the workhorse model of supply chains by Costinot, Vogel & Wang (2013). The authors build a simple theory of trade with sequential production, multiple countries, one factor of production and final good within a production process which is subject to mistakes to capture technology differences between countries. The model shows that, firstly, countries with lower levels of mistakes specialize in later stages of production where failure is more costly. The effects of technological change, separated into global and local, are then created and studied in four ways. First, global technological changes are modelled by “complexity”, captured through an increase in the length of the production process, and by “standardization”, captured through a uniform decrease of failure rates throughout the chain. The findings from these adjustments show that increased complexity and standardization result in all countries moving up the value chain, but also in opposite effects on global inequality. An increase in complexity raises inequality across all nations while an increase in standardization decreases inequality. Standardization, however, benefits poor countries depicted in the model by higher failure rates proportionately more. Actually, Costinot, Vogel & Wang find that standardization may lead to immiserizing growth,
21
or a welfare loss, in the technologically advanced countries. Local technological changes, on the other hand, produces ambiguous results on welfare effects. Again, the authors consider two forms of local change; first, labour-augmenting technical progress, and second, “routinization” referring to a decrease in country’s failure rate. What is found is that these have very different effects at the bottom and at the top of the chain. At the bottom countries may move up or down the chain but the direction of the move determines the change in the inequality of nations. At the top, local technological development always moves the nation up in the chain, but the inequality of nations may either fall or rise. What the authors find surprising is that at the bottom rich countries benefit disproportionately more from being pushed up the chain, but at the top this is not so.
Returning again to Krugman & Venables, the authors offer several points of caution as their above introduced theoretical model is a highly simplified depiction of complex international trends and changes. The first is highly relevant from the perspective of value chain analysis; as even conventional free trade advocating models admit, barriers to trade, natural or artificial, may change the positive aggregate benefit effects of integration. Definitions, creation and impacts of barriers to trade and entry are discussed later in this chapter. Second, the model assumes an exogenously defined division of regions into “South” and “North” (introduced in chapter 3.1 in (Kümmritz, 2015) (Li & Liu, 2014) (Baldwin & Lopez-Gonzalez, 2013)) which then brings about the differentiation into core and periphery regions. As the authors state, the changing roles of e.g. southern parts of USA and Europe, Japan and East Asia show that there is continuous redefining of the core and periphery and what currently seems a growth in the geographical area of the core or even the emergence of several separate cores. Third and fourth, the model does not include capital and in the form introduced by Krugman & Venables does not use actual figures from empirical studies.
The above models by Krugman & Venables and Baldwin can also be amended with insights provided by Baldwin & Venables (2013), who discuss the division of value chains into two extremes, spiders and snakes, according to characteristics of the production process. In a snake a sequential process of production adds value through operations that are carried out in a predetermined order. Spiders in contrast are systems with many limbs of separate smaller processes where parts of the final product are assembled and have to come together only for final assembly. As Baldwin & Venables point out, pure snakes or spiders are rarely met, and most production processes or value chains exhibit characteristics of both. The distinction of
22
analysis of these two extremes is, however, useful as it produces differences in insights into global production.
The snake and the spider share some characteristics that should be discussed first. In both cases geographic location is determined through the interplay of international differences in production costs and co-location costs following from unbundling. As previously indicated, reductions in international costs of trade, communication or coordination facilitate relocation of production, but Baldwin points out that this is not necessarily continuous or monotonic. Parts of production may move against their comparative costs to capture unbundling benefits, or “overshoot”, which means that reshoring can occur later on as unbundling costs fall. For Baldwin & Venables this overshooting is due to coordination failure, but the above introduced Costinot, Vogel & Wang model argues the opposite; overshooting is not necessarily a coordination failure, but reflects the fact that in a perfectly competitive model with sequential production and in the presence of trading frictions, firms must offshore a sufficiently large set of stages to find the fragmentation across borders profitable. According to Baldwin & Venables both spiders and snakes may, however, also exhibit coordination failures when individual companies carry out inefficiently little offshoring even after unbundling costs have fallen. This happens when companies cannot be sure that if they were to offshore activities the critical links they are tied to would follow. According to the authors, this suggests incentives for vertical integration or other forms of coordinating actions that could minimize costs.
Where spiders and snakes differ is the amount of trade they potentially create. As parts in spiders only cross borders twice, trade is bounded by twice the value of the final output and does not necessarily rise as frictions fall. The snake is different, as falling frictions may divide the snake into ever smaller production stages that arise from engineering details, separations costs and comparative cost differences. The snake also has a further characteristic, upon which continuous relocation following from falling trade frictions causes polarization of activities into labour- and capital intensive production regions. As Baldwin & Venables state, the effect of this on factor prices is beyond the scope of their paper, but points towards factor price convergence. This polarization does not, according to them, hold for the spider.
In the context of this thesis geographical concentration and the above theoretical models with their later applications become more relevant when the entire global diamond value chain is examined. The global industry level approach receives, however, limited attention in this thesis as the main aim is to analyse the diamond value chain within the national borders of Namibia.
23
The above raised issues will to some extent still be discussed as geographic concentration from the Krugman & Venables point of view is particularly relevant for the middle market of the diamond industry, and the entire global diamond value chain exhibits characteristics of the snake as discussed by Baldwin & Venables (2013). In addition, the related creation and existence of barriers to entry and trade introduced in this chapter are particularly topical to the diamond industry at large and also to Namibia in particular. They will thus be discussed from a theoretical perspective later in this chapter and pertaining to the findings on the Namibian diamond industry in chapter 4.
3.2.2 Analytical tools of value chain analysis
The previous subchapter explained tools within value chain analysis that are descriptive in nature, shedding light on the data based existence of the world as it is witnessed. Even though a fundamental building block of understanding what kind of value, how it is created and to whom dispersed within the chain, an explanation is also needed for why things happen as they are perceived to. Analytical tools of value chains try to answer these questions. Kaplinsky (2000) and Kaplinsky & Morris (2002) describe the following three characteristics of value chains that have to be taken into account and the analytical tools intend to tackle.
Firstly, value chains create and distributes rents, which are dynamic in nature. The concept of rent describes, in short, the process of returns generated to owners of scarce resources. This process is dynamic, which means that scarcity can be created, changes hands from owner to owner, and the barriers containing scarcity are eroded by forces of competition. These issues are further discussed under the tool of barriers to entry, trade and rent.
Second, effective value chains entail some form of governance, which means that agents within chains are not equal with respect to how much power they hold in deciding who produces what, at what price and when. These abilities of agents to influence the actions of other agents are dealt with under governance structures, which give aid to classifying different types of value chains and in understanding how power differences are created.
The third consideration deals with the broader scale of global value chains competing with each other. Systemic efficiency draws our interest to the fact that successful value chains are characterized by efficiency throughout the chain, thus systemic, instead of point-specific efficiency of individual agents, steps or processes. This aspect of value chains involves again elements of governance, but also draws insights from the reality of interconnectedness in global production witnessed in recent decades.
24 3.2.2.1 Barriers to entry, trade and rent
The concept of rent, in the context of value chains, is based on the fundamental economic reality of scarcity. The original idea of economic rents was put forth by the classical economists, e.g. Ricardo, who saw that economic rents are based on the unequal ownership and access to scarce resources. In addition to this view, Schumpeter argued that scarcity can be constructed through intentional actions of entrepreneurs. Entrepreneurial surplus is collected by those agents in the economy who are able to create new combinations of goods withholding larger returns to buyers, i.e. these entrepreneurs take part in the process of innovation. Innovation is driven forward by the search of so called super profits or entrepreneurial surplus that the innovator is able to reap after the innovation as competition has not yet caught up with the new combination. It is important to note that these profits are not static, meaning that competitors will copy the original innovation and in time prices are pushed down, the abnormal returns normalized and producer surplus transformed into consumer surplus. This dynamic nature of rents is the driver of capitalism and creates cycles of continuous change, where new innovations always replace the old ones. (Kaplinsky, 2000).
Based on these realities of the economy, barriers to entry, trade and rent arise. These are then created in two ways. Firstly, the process of innovation creates dynamic barriers to rent as entrepreneurs are able to beat their competition. Secondly, barriers to entry refer to the ability of agents to protect themselves from competition. This can happen through acquiring scarce resources, e.g. land, minerals, technical capabilities or knowledge, creating better processes, e.g. logistics and economies of scale, or constructing other barriers exemplified by branding, certification schemes, designation of origin, etc. (Roduner, 2005).
These barriers limiting competition and thus affecting the boundaries of value chains have been changing rapidly in past decades. Many countries have been developing their industrial capabilities and new entrants such as China and India have risen to the front of global competition. These developments have to a great extent been responsible for falling barriers to entry, trade and rent and changes in the nature of these barriers. They are less and less found in production and increasingly in activities such as design, branding and marketing. (Kaplinsky & Morris, 2002).
The above views from somewhat practically oriented value chain analysis literature benefit from contrasting arguments of more theoretical value chain and industrial organization research in the field of economics. Firstly, as suggested by Sutton (2007a), there are theoretical caveats
25
in the Schumpeterian competition model as discussed above in Kaplinsky (2000). To summarize, when it comes to industrial organization industries can be seen as divided into two discrete categories, to those where advertising and R&D are not important, and those where they are of paramount importance. This model, referred to as the “endogenous sunk costs model”, in essence states that even if entry to markets or value chains is in principle free, some industries exhibit characteristics where sizeable initial sunk costs in e.g. R&D or marketing limit the number of firms. As discussed later in chapters on the global diamond industry and the case study of Namibia this has significant bearing on the diamond value chain where various steps of the chain entail large sunk costs in the form of agreements, capital investments or marketing efforts. These sunk costs consequently act as barriers to entry and have to be taken into account when e.g. designing national policy interventions aiming at higher GVC participation.
Sunk costs are not the only barrier arising from industry characteristics and actions of individual companies. The dynamic innovation process as discussed above by Roduner (2005) can also be developed to a more detailed level. Sutton (2007b) examines a theoretical model where a firm’s survival is determined by two factors, quality and productivity, where the latter can be in general terms be understood as cost competitiveness. What Sutton finds is a so-called capability window defined at the higher boundary by the highest level of quality or productivity obtained by any firm, and limited at the lower end by a threshold level under which firms cannot sell anything even by lowering their prices. This process is shown in a model of three phases closely related to the one described by Krugman & Venables (1995) and Baldwin (WTO, 2013) in a previous chapter on geographic concentration. The first phase is that of trade liberalization, which induces a selection effect on firms or countries, where those falling under the threshold of capability suffer a “shakeout” effect and cannot remain in the market (This shakeout effect is further studied in Sutton (2007a)). In essence, the capability threshold creates a barrier to entry for firms or countries under which they cannot access the value chain of global production. A key point from Sutton is that wage level differences can even fully offset different levels of productivity, but cannot do the same for quality. An implication of this is, as also stated by Krugman & Venables (1995), that the first phase of global integration can be welfare reducing for countries that do not have adequate capabilities and can thus not participate in global production. The second phase is characterized by the fact that wage and capability differentials between regions create high incentives for low-capability countries to invest in capability, but also for high-capability countries to shift this capability to countries
26
with lower wages. As Sutton points out, this second phase is argued to carry the benefits of globalization to the so-called mid-capability-level countries, even if the determinants of speed and effectiveness of this process are not very well understood. The final third phase, called the escalation phase by Sutton, withholds an adjustment of firms into the new global environment as they now have access to more markets than before and have to adjust to the new capability requirements of the global market. Sutton also argues, as introduced above in the model of endogenous sunk costs (Sutton, 2007a), that it is at this point that the barriers created by sunk costs are also raised as they are integral in determining the optimal levels of productivity and quality. The third phase may then entail further shakeouts particularly in highly concentrated markets, defining the capability windows for global markets or GVCs.
Combining the findings of Sutton (2007a and 2007b) and Neary et al. (2015), conclusions highly relevant for this paper are arrived at. Firstly, access to global value chains is closely related to an entry level of capability, which has to be obtained to even exist in the chain. Second, this in reality means that the choice between low wages (high productivity) and quality does not exist. There are limits to how far production cost competitiveness can aid in capturing more value in GVCs, but no limits to what can be achieved through obtaining higher quality. Third, theoretical and empirical findings on cost- versus quality-based competence by Neary et al. (2015) suggest that export industries producing differentiated products exhibit first and foremost quality-based competence, whereas those in non-differentiated-goods industries exhibit cost-competence. In both industry categories companies thrive by focusing on those goods where they have core competence, which would be expected also from the arguments of Sutton based on the moving quality window of GVCs. These findings from Neary et al. give rise to an argument that “one-size-fits-all” type of policy interventions would not be suitable for promoting export industries or higher participation in GVCs.
The above introduced barriers to entry, trade and rent are very relevant in the analysis of the global and the Namibian national diamond value chains. There are those barriers that are easily defined, such as legal frameworks, government policies and international agreements on diamond trade. The other subset are those that are brought to life by industry specific characteristics in investments, access to endowments, capabilities and quality considerations arising from market dynamics or through conscious efforts of companies in trying to build barriers to rent. In all of the above cases they are tightly linked to relative capability and power differences individual actors hold within the chain, which are discussed next under governance structures of value chains.