HOUSEHOLD INDEBTEDNESS AND ITS
IMPLICATIONS FOR FINANCIAL STABILITY
Don Nakornthab (Project Leader)
The South East Asian Central Banks (SEACEN) Research and Training Centre
© 2010 The SEACEN Centre
Published by The South East Asian Central Banks (SEACEN) Research and Training Centre
Lorong Universiti A 59100 Kuala Lumpur Malaysia Tel. No.: (603) 7958-5600 Fax No.: (603) 7957-4616 Telex: MA 30201
Cable: SEACEN Kuala Lumpur Website: http://www.seacen.org
Household Indebtedness and Its Implications for Financial Stability
by Don Nakornthab
ISBN: 983-9478-83-4
All rights reserved. No part of this publication may be reproduced, stored in a retrieval system, or transmitted in any form by any system, electronic, mechanical, photocopying, recording or otherwise, without the prior permission of the copyright holder.
FOREWORD
The near collapse of the U.S. financial system that allowed U.S. households to become overextended and over-indebted has prompted a renewed interest on the issue of household debt sustainability and its bearing on financial stability. In many SEACEN countries, with rapid increases in household indebtedness over the past decade, the U.S. experience serves as a reminder of what may go wrong if the risk to the financial system that stems from the rise in household indebtedness, is not handled properly.
This research volume represents an attempt by The SEACEN Centre to have a proper understanding of household debt developments and their implications to financial stability in SEACEN member countries with an ultimate goal of helping policy makers to put in place preemptive measures to address any vulnerability that may arise while reaping the economic and welfare benefits of increased household indebtedness. It is the first study that compares and contrasts developments of household debt and household credit risk across SEACEN countries in a uniform manner. We hope that the findings and suggestions of this study will be valuable for policy makers with concerns on the maintenance of financial stability.
This collaborative research was led by Dr. Don Nakornthab, Team Executive, Macro Surveillance Team, Monetary Policy Department of the Bank of Thailand and concurrently Visiting Research Economist of The SEACEN Centre and participated by 7 country researchers of 5 SEACEN member central banks. The SEACEN Centre wishes to express its sincere gratitude to the project leader and participating member central banks and their country researchers for actively participating in this project and preparing the integrative report and country chapters respectively. The country researchers are namely Mr. Mao Sokanyn of the National Bank of Cambodia; Ms Nazreen Abdul Ghani of Bank Negara Malaysia; Ms Diwata Miguela E. Samarita of Bangko Sentral ng Pilipinas; Ms Fang Huei-Jung of the Central Bank of the Republic of China and Dr. Wanvimol Sawangngoenyvang, Ms Pimporn Thungkasemvathana and Ms Siriporn Siripanyawat of the Bank of Thailand respectively. The useful comments and suggestions of the external reviewer, Dr. Ram Kishen S. Rajan, Associate Professor, School of Public Policy, George Mason University, are also gratefully
acknowledged. Appreciation also goes to staff members of the Research and Learning Contents Department of The SEACEN Centre for their assistance.
The views expressed in this study, however, are those of the authors and do not necessarily reflect those of The SEACEN Centre or the SEACEN member central banks/monetary authorities.
Dr. A. G. Karunasena August 2010
Executive Director The SEACEN Centre Kuala Lumpur
TABLE OF CONTENTS Page Foreword iii Table of Contents v Executive Summary x
P
P
P
P
PAR
AR
AR
ART I:
AR
T I:
T I:
T I:
T I: INTEGRA
INTEGRATIVE REPOR
INTEGRA
INTEGRA
INTEGRA
TIVE REPOR
TIVE REPOR
TIVE REPORT
TIVE REPOR
T
T
T
T
CHAPTER 1: HOUSEHOLD INDEBTEDNESS AND ITS IMPLICATIONS FOR FINANCIAL STABILITY
By Don Nakornthab
1. Introduction 3
1.1 Background 3
1.2 Objectives 4
1.3 Research Design and Organisation of the Study 4
2. Data Sources and Caveats 5
3. Facts about Household Debt in the SEACEN Region 7
3.1 Household Debt Trends 8
3.2 Household Indebtedness Trends 9
3.3 Purposes of Household Debt 12
3.4 Sources of Household Debt 13
4. Forces Driving Household Indebtedness in the SEACEN
Region 14
4.1 Macroeconomic Environment 17
4.2 An Easing of Credit Constraints on the Side of Financial
Institutions 18
4.3 Lower Interest Rates 21
4.4 Rising Real House Prices 22
4.5 Econometric Results 25
4.6 Individual Country Results 26
5. Implications for Financial Stability 27
5.1 Financial System’s Exposure to the Household Sector 27
6. Policy Implications 32 6.1 Balancing Costs and Benefits of Increased Household
Indebtedness 32
6.2 Enhancing Household Debt Information 33
6.3 Strengthening Household Credit Risk Assessment 35
6.4 Macro-prudential Regulation and Supervision 36
7. Concluding Remarks 37 References 39 Appendix 42
P
P
P
P
PAR
AR
ART II:
AR
AR
T II:
T II:
T II: COUNTR
T II:
COUNTR
COUNTR
COUNTRY CHAPTERS
COUNTR
Y CHAPTERS
Y CHAPTERS
Y CHAPTERS
Y CHAPTERS
CHAPTER 2: HOUSEHOLD INDEBTEDNESS AND ITS
IMPLICATION FOR FINANCIAL STABILITY IN CAMBODIA
By Mao Sokanyn
1. Introduction 47
2. Literature Review 48
3. Facts about Household Debt in Cambodia 48
3.1 Aggregate Trends (Time Series) 49
4. Forces behind the Rise of Household Indebtedness 56
4.1 Demographic Changes 56
4.2 Home Ownership and House Price 56
4.3 Inflation Rate 59
4.4 Foreign Direct Investment 60
4.5 Tourism 62
4.6 Unemployment Rate 62
4.7 GDP Growth 63
5. Banking System in Cambodia 64
6. Conclusion 66
CHAPTER 3: HOUSEHOLD INDEBTEDNESS AND ITS
IMPLICATIONS FOR FINANCIAL STABILITY IN MALAYSIA
By Nazreen Abdul Ghani
1. Introduction 67
3. Facts About Household Debt in Malaysia 69
3.1 Aggregate Trends (Time Series) 69
3.2 Sources of Household Debt 71
3.3 Financial Institution (Supply-Side) Perspectives 71 4. Forces Behind the Rise of Household Indebtedness in Malaysia 73
5. Assessment of Household Debt Vulnerability 77
5.1 Aggregate Debt Repayment Ratio 77
5.2. Aggregate Asset-to-debt Ratio 79
5.3 NPL Rates of Different Types of Consumer Loans of
Commercial Banks 79
5.4. Model of Banking System’s Household Loan NPL Levels
Using Aggregate Data 80
6. Implications to Financial Stability 83
7. Policy Implications 84
8. Conclusions 86
References 87
Appendix 88
CHAPTER 4: IMPLICATIONS ON FINANCIAL STABILITY OF HOUSEHOLD CREDIT ACCUMULATION IN THE PHILIPPINES
By Diwata Miguela E. Samarita
1. Introduction 89
1.1 Overview 89
1.2 Measures Implemented to Address Risks to Household
Lending 92
1.3 Impact of the Measures 94
2. Review of Related Literature 95
3. Philippine Household Credit Accumulation 97
4. Factors behind the Rise of Household Indebtedness 102
4.1 Output 103
4.2 Inflation 105
4.3 Interest Rates 105
4.4 Unemployment 107
5. Assessment of Household Debt Vulnerability 107
5.1 Methodology 107
5.2 Results 109
6. Conclusion and Policy Implications 116
CHAPTER 5: HOUSEHOLD INDEBTEDNESS AND ITS IMPLICATION TO FINANCIAL STABILITY IN TAIWAN
By Huei-Jung Fang
1. Introduction 121
2. An Overview of Household Debt in Taiwan 122
2.1 Trend and Features of Household Debt in Taiwan 122 2.2 Forces behind Household Debt and its Implications on
Financial Stability 124
2.3 Facts about Household Debt in Taiwan 126
3. Review of Literature 128
4. An Empirical Model of Household Debt 129
4.1 The Data 129
4.2 Results of the Empirical Study 130
5. An Empirical Model of the NPL Ratio of Household Loans 135
5.1 The Data 135
5.2 Results of the Empirical Study 136
6. Stress Tests and Policy Implications 141
7. Conclusion 143
References 145
Appendix 146
CHAPTER 6: HOUSEHOLD INDEBTEDNESS AND ITS
IMPLICATIONS FOR FINANCIAL STABILITY IN THAILAND
By Siriporn Siripanyawat, Wanvimol Sawangngoenyuang and Pimporn Thungkasemvathana
1. Introduction 149
1.1 Financial Stability Perspective 150
2. Literature Review 151
3. Facts about Household Debt in Thailand 153
3.1 Data 153
3.2 Purposes of Household Debt 158
3.3 Supply Side Perspective (Data from Formal Sources of
Loans) 162
4. Forces Behind the Rise of Household Indebtedness 170
4.1 Household Characteristics 171
4.2 Macroeconomic Variables 176
4.4 Government Policies 180
4.5 An Empirical Model of Household Debt 181
5. Assessment of Household Debt Vulnerability 185
5.1 Household Debt Burden 185
5.2 Quality of Consumer Loan (Delinquency Rate and NPL
Ratio) 187
5.3 An Empirical Model of Consumer Loan’s NPL 189
6. Conclusion and Policy Implications 193
References 197
EXECUTIVE SUMMARY
During the past few years, many SEACEN countries have experienced rapid increases in household debt/household credit, both in absolute terms and relative to the size of the economy and household income. In many cases, these developments reflect the SEACEN countries’ financial sector deepening and are positive for economic activities and welfare. However, the rise in household debt also comes with a downside. Excessive household indebtedness makes households vulnerable to shocks which may lead to financial instability as vividly illustrated by the recent global financial crisis.
Against this backdrop, the main aim of this study is to garner a better understanding of the evolution of household debt and its potential consequences on financial stability in SEACEN countries. Among the specific issues investigated in the integrative report and the five country papers representing a spectrum of SEACEN countries (Cambodia, Malaysia, the Philippines, Taiwan and Thailand) are developments of household indebtedness in the SEACEN region including assessments from the demand-side and the supply perspectives, factors behind these developments, assessments of risks posed by household debt to financial stability, and policy implications for central banks/monetary authorities.
The findings of this study suggest that the threat of a household-debt-induced instability in this part of the world is remote. Most importantly, the levels of aggregate household indebtedness in SEACEN countries do not appear excessive relative to their economic fundamentals. A large part of the developments in household indebtedness in SEACEN countries can be explained by countries’ stages of economic development and the contemporaneous macroeconomic and financial environments. At the same time, the shares of household loans in total bank loans are low to moderate in general. Finally, there appears to be no signs of significant stress on either household balance sheets or financial institutions’ household credit portfolios at the moment. The majority of household loans are in collateralised residential mortgages which have low risk in the absence of a property price bubble.
Nevertheless, regional policymakers cannot afford to be complacent, but need to remain vigilant against increases in household indebtedness and financial institutions’ household credit risk. This is because a number of forces are likely to contribute to strong increases in household indebtedness and increased household balance sheet vulnerability in the period ahead. First, post-crisis economic
recovery will provide support for further household debt accumulation. Second, given the low-to-moderate share of household loans to total bank loans, there is much room for further increases. Third, with house prices poised for a fresh new up-cycle, robust growth in mortgage loans is expected. Fourth, continued financial innovations and the region’s adoption of the Basel II Accord which favours consumer loans over unrated corporate loans will further tilt bank loan portfolios towards household loans. Finally, against the expected increase in household debt relative to household income will be the uptrend in interest rates associated with the normalisation of monetary policy stances in many countries.
Beyond country-specific recommendations that appear in the country papers, the study suggests four main policy implications to ensure that the risk to financial stability posed by increases in household indebtedness is well contained. First, the authorities need to strike a balance between greater household credit access and heightened threats to financial stability as being too cautious will likely forgo the many benefits of household debt including economic growth opportunity. Second, the study highlights the inadequacy of household debt information in many SEACEN countries, ranging from the absence of centralised credit information system, limited loan categorisation and relevant financial indicators, to the non-existence of micro (household level) data. Given that the ability to detect and assess the threats to financial stability arising from developments in household debt early on depends critically on the availability of timely and comprehensive information on household debt, much can be gained from investing in data enhancements. Third, because the market cannot always be counted on for accurate risk assessment, authorities with concerns for the maintenance of financial stability need to have some tools for their own vulnerability assessment of the household sector. Among the tools advocated by this study are sensitivity/scenario analysis and stress testing, of which simple examples are presented in the Taiwan and the Thailand country papers. Finally, drawing on the lessons from the recent global financial crisis, the study suggests that the authorities adopt macro-prudential regulation and supervision which takes a financial-system-wide perspective on top of the traditional institution-specific micro-prudential one.
PART I:
PART I: INTEGRATIVE REPORT CHAPTER 1
HOUSEHOLD INDEBTEDNESS AND ITS IMPLICATIONS FOR FINANCIAL STABILITY
by
Don Nakornthab*
1. Introduction 1.1 Background
During the past few years, many SEACEN countries have experienced rapid growth in household debt/household credit. In one aspect, an increase in the level of household indebtedness is desirable given its favourable effects on economic activities and welfare. However, excessive household indebtedness weakens and poses significant risk to household balance sheets. Given sufficiently weak household balance sheets and strong enough shocks, households may face in order of severity cash-flow problems, loan default, insolvency, and foreclosure, resulting in depressed consumption spending and financial instability if the financial system’s exposure to the household sector is high enough. The downside of household debt is especially important in economies that lack strong macroeconomic fundamentals and/or have inadequate prudential regulations of the financial system.
Perhaps the most vivid example of the fallout of excessive household indebtedness on financial stability is the recent global financial crisis which originated in the United States. In the period leading up to the worst global calamity in seventy-odd years, U.S. household indebtedness rose to an unprecedented level. During this period, U.S. households became increasingly vulnerable to negative economic shocks, particularly those in the upper end of the distribution of the ratio of debt to income, i.e., the sub-prime borrowers. With the turn of the interest rate cycle coupled with the decline in house prices,
___________
*. Head, Macro Surveillance Team, Bank of Thailand. The views expressed in this report are the author’s and not necessary those of the Bank of Thailand or The SEACEN Centre.
many of these borrowers ran into payment difficulty, eventually leading to widespread defaults that triggered a severe financial crisis in the world’s most advanced economy.
Given the significant potential impact of household indebtedness on financial stability, it is no surprise that much of the research on household debt during the past decade has been put forth by central banks. Examples are Ariyapruchya (2007, Bank of Thailand), Barnes and Young (2003, Bank of England), Dynan and Kohn (2008, FRB), Rinaldi and Arellano (2006, ECB) and RBA (2003). With contributions from Indonesia, Korea, Malaysia, the Philippines, and Thailand, BIS (2009) represents the most comprehensive collection of work on household debt in SEACEN countries to date. Yet, the five individual country papers in the volume differ substantially in their data coverage and focus, rendering cross-country comparison beyond a snapshot of high-level indicators difficult. On the other hand, Kusmiarso (2006), whose country papers are more uniform, focuses exclusively on housing and mortgage loans. With thirteen out of sixteen SEACEN countries covered1, this study can thus be regarded as the first study to compare and contrast developments of household debt across the SEACEN countries.
1.2 Objectives
The objective of this study is to have a better understanding of the degree of indebtedness of households, the forces behind changes in the level of household indebtedness, and the consequences household indebtedness on financial stability in the SEACEN countries. In particular, issues related to the sustainability of household debt, household balance sheet vulnerability and impacts of household indebtedness on banks’ loan losses will be examined so as to enable policymakers to put in place strategic measures to address adverse implications from the development in household debt while at the same time balancing the benefits gained from it.
1.3 Research Design and Organisation of the Study
This study is a collaborative project of The SEACEN Centre and the member central banks and monetary authorities. Under this collaborative arrangement, the researcher(s) of the member banks or monetary authorities are responsible for preparing the country chapters based on the agreed guidelines. Meanwhile,
___________
1. The exceptions are Brunei Darussalam, Myanmar, and Papua New Guinea which do not have the required data.
the project leader from The SEACEN Centre prepares an overview and regional analysis, based on his own literature research and the findings in the country papers.
This report of the research project comprises two parts. Part One (this chapter) covers the overview and regional analysis. Part Two contains all the country chapters which are contributed by the researchers nominated by the member banks or monetary authorities.
The rest of this chapter is organised as of follows. Section 2 discusses data sources and data caveats. Section 3 details facts about household debt across SEACEN countries. Section 4 examines the various factors that have been identified by the literature as having been important driving forces of household indebtedness globally within the context of the SEACEN economies. Section 5 provides an assessment of risks to financial stability. Policy implications are discussed in Section 6. Section 7 provides concluding remarks.
2. Data Sources and Caveats
Most of the household debt data that appear in this chapter are from the SEACEN member central banks themselves, either from the contributed country papers or from separate surveys completed by non-participating central banks (Appendix 1). The rest are from public sources such as Bloomberg, CEIC, central banks’ financial stability reviews/reports, and the International Monetary Fund’s Financial Soundness Indicators (FSI) homepage. While it is impossible to check the accuracy of all self-reported data, reasonable care has been taken to ensure the integrity of these data by means of cross-checking with primary and other published sources as well as correspondences with member banks’ contact persons.2
Constrained by the non-participating country survey, most of the data analysed in this chapter are in annual frequency and cover the period from 2003 to 2008. The choice of the start year of the survey was motivated by a concern about data requirement for certain non-participating countries and the fact that it was around this time that the rise in household indebtedness started to get noticed for its bearing on financial stability. The end year was dictated by the time the survey was conducted which was in 2009 Q3. In retrospect, the survey would
___________
2. When the self-reported data differ from those from published sources but the differences are not too large, the former are used. The latter are used only when the discrepancies cannot be explained by data revisions and different data definitions.
have been made less comprehensive3 at the benefit of a longer survey period so as to get a longer-term perspective for countries with available data. For example, in Korea, the surge in household debt took place between 1998 and 2002 whereas in Taiwan, the increase in household debt had been more gradual from 1987 to 1996.
In developed countries, data on household debt generally come from two sources, namely, the household debt section of the household or consumer finance survey and financial institutions data. The former has advantage of being comprehensive in nature and highly suitable to micro-level studies. The latter has advantage of having less bias of under-reporting and of containing data suitable for default study. So the two data sources complement each other nicely. Unfortunately, in a number of SEACEN countries, the survey data do not exist while the financial institutions data are usually confined to loans extended by commercial banks. Given that households also borrow formally from non-commercial bank sources such as government agencies, development banks, finance companies, and mortgage brokers and informally from relatives, friends, and money lenders, the amount of commercial banks’ household loans inevitably understates the total amount of household debt and consequently total household debt burden. The extent of the understatement depends on the importance of the non-commercial bank sources in providing financing to households which varies from country to country.
Given the different providers of household debt, in this chapter, three commonly interchangeable words will be distinguished. As a generic term, the word “household debt” is used. When the providers of household debt include both financial and non-financial institutions, the word “household liabilities” is used. Finally, when household debt comes from only financial institutions, the word “household loans” is used.
Aside from the issue of the providers of household debt, it is important to distinguish between household loans and consumer loans (loans to households for consumption purposes: residential mortgages, auto loans, credit card loans, student loans, personal loans, etc.). The latter is obviously a subset of the former which also includes loans to households for business purposes. In gauging total
___________
3. Specifically, the survey has six parts: (1) basic household debt data, (2) sources of household debt, (3) home ownership data, (4) macro and financial variable data, (5) commercial bank loan data, and (6) government policies related to household debt. Ex post, it turned out that the survey was too ambitious, for most of the questions beyond part (4) were left blank, reflecting the difficulty in getting, if not the dearth of, relevant data across SEACEN countries.
household debt burden, it is therefore more correct to use the household loan figures. Unfortunately, in most countries, the publicly-accessible loan data are ones classified by purposes rather than ones classified by borrower entities. So researchers are often left with consumer loans to work with. This issue is quite important for many SEACEN countries where there are a large number of unincorporated small- and medium- enterprises (SMEs). In Taiwan, for example, roughly one-fourth of household loans are for business purposes. Using the amount of consumer loans instead of total household loans would substantially understate household indebtedness in the case of Taiwan.
In the analysis that follows, where data permit, the figures on household liabilities are chosen over the figures on household loans which in turn, are chosen over the figures on consumer loans. This ensures that the largest possible amount and the most complete picture of household debt are obtained in any country. An exception is Thailand, where household loans are used rather than household liabilities used by the country researchers, as rich households which account for the major share of debt are underrepresented in the survey data (Ariyapruchya, 2007). Yet doing so does have a drawback. Since household debt figures in different countries may be of different bases, cross-country comparisons will be compromised to a certain extent.
Finally, it should be noted that beyond a couple of headline comparisons, the required data for a comprehensive cross-country analysis are extremely scarce. The important missing data are household disposable income, household assets, household debt payment, characteristics of indebted households, and non-performing loan (NPL) ratios of household loans. This lack of data greatly reduces the breadth and depth of the analysis to follow.
3. Facts about Household Debt in the SEACEN Region
The sixteen SEACEN countries differ widely in their economic and financial structure and stage of development. The same can be said about the structure of household debt and the extent of household indebtedness. This section compares and contrasts developments of household debt across SEACEN countries from 2003 to 2008 in four key dimensions: (1) the growth of nominal and real household debt, (2) the extent of household indebtedness as measured by the ratio of household debt to GDP and the ratio of household debt to household disposable income, (3) the structure (purposes) of household debt, and (4) the sources of household debt. Comparisons of household leverage, household debt service, and household NPL rates are deferred to Section 5 when risks to financial stability will be assessed.
3.1 Household Debt Trends
Of the sixteen SEACEN countries, the nominal amount of household debt was obtained for thirteen countries: Cambodia, Fiji, Indonesia, Korea, Malaysia, Mongolia, Nepal, the Philippines, Singapore, Sri Lanka, Taiwan, Thailand, and Vietnam. Of these thirteen countries, Cambodia, Mongolia, and Vietnam have data available only for certain years. All in all, ten countries have data available throughout the 2003-2008 period.
Table 1
Amount and Growth of Household Debt, 2003-2008
Sources: country papers; non-participating-country surveys; MAS Financial Stability Review (2003 figure); Nepal Rastra Bank’s Banking and Financial Sector Statistics; Author’s calculation Note: Consumer loan data for Nepal and Sri Lanka do not include household mortgage loans.
Table 1 shows the nominal amounts of household debt in the thirteen SEACEN countries with full or partial data along with the compound annual growth rates (CAGRs) and average real GDP growth rates for the period in which the country data are available. Over the five-year span, the level of household debt in the region increased across the board. The CAGRs range from a low of 3% per annum for Singapore to 103% per annum for Cambodia. The simple arithmetic average of the CAGRs for the whole sample is 24%, equivalent to a doubling of household debt every three years (Average 1). Excluding five countries with CAGRs higher than 20% (Cambodia, Indonesia, Mongolia, Nepal, and Sri Lanka), the average CAGR (Average 2) comes down to 10%, noticeably lower but still significant.
While such rates of increase in household debt easily make headline news, economically what matters is not the nominal but real household debt. To account for the effect of price changes, the nominal household debt in each country is deflated by the country’s headline consumer price index during the corresponding period. Taking inflation into account, Cambodia still retains the position as the country with the highest CAGR of 86%. At the other extreme, real household debt was essentially flat throughout the period in Singapore. Taken as a group, the simple averages of real household debt growth for the whole and the high-growth-excluded samples are 16% and 5%, respectively.
While the real growth rates are still substantial, an important observation emerges if we look at the corresponding average real GDP growth rates of the two samples. Once we take out the five high-growth countries, the average real household debt growth in the remaining countries is the same as the average real GDP growth for the group. In other words, real household debt appeared to simply keep up with economic growth for this group of countries during this period. Individually, this growth pattern applies to Korea, Malaysia, Taiwan, Thailand, and Vietnam while Fiji had real household debt growth significantly above real GDP growth and the Philippines and Singapore experienced the opposite.
3.2 Household Indebtedness Trends
In principle, the growth rate of household debt should be evaluated in conjunction with the debt level. Fast growth from a small base is generally less worrisome than moderate growth from a high base. This is because households with high debt are more vulnerable than households with low debt. One way to make the debt levels comparable across countries is to convert them into a common currency unit, say the USD. Yet such conversion ignores the fact that 10,000 USD of debt, while being marginal in some countries, may be significant in others.
Internationally, the ratio of household debt to GDP and the ratio of household debt to household disposable income are commonly used to compare the extent of household indebtedness across countries. The former ratio measures household debt against the size of the aggregate economy and hence is only a rough indicator of household indebtedness. The latter ratio is more reflective of the actual household debt burden, but has the availability of the household disposable income data as its limitation.
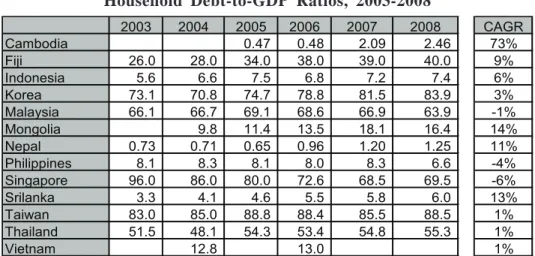
Table 2 displays the ratios of household debt to GDP for the same set of countries in Table 1. From the Table, we can divide the thirteen SEACEN countries into three groups according to their levels of the debt-to-GDP ratio: low-debt (below 20% debt-to-GDP ratio: Cambodia, Indonesia, Mongolia, Philippines, Nepal, Sri Lanka and Vietnam), moderate-debt (20-50% debt-to-GDP ratio: Fiji) and high-debt (over 50% debt to debt-to-GDP ratio: Korea, Malaysia, Singapore, Thailand, and Taiwan).
Against this backdrop, it is obvious that only the low- and moderate-debt groups experienced significant increases in the level of household indebtedness during the study period. Most notably, the ratio of household debt to GDP increased five times in three years in the case of Cambodia. In contrast, countries in the high-debt group hardly saw major increases in household indebtedness. With the exception of Korea, the CAGRs of the high-debt countries were 1% or below. For benchmarking comparison, it is noteworthy that the corresponding CAGRs during this five-year period for the U.S. (debt-to-GDP ratio of 106.6), the U.K. (98.5), and Australia (110.2) were 2%, 3%, and 6%, respectively.
Standing out in Table 2 is Singapore whose CAGR was -6%. In 2003, Singapore was the most indebted SEACEN country with the ratio of household debt to GDP at a staggering 96%. Over the next four years, however, the country managed to bring down the ratio significantly. The remarkable decline in Singapore’s debt-to-GDP ratio was attributable to lackluster growth of
Table 2
Household Debt-to-GDP Ratios, 2003-2008
Sources: country papers, non-participating-country surveys, MAS Financial Stability Review (2003 figure), Author’s calculation
household loans (primarily mortgages and auto loans as credit card and non-secured personal loans recorded strong growth during the period) between 2003 and 2007 in the face of the buoyant economy.
The story of Singapore is different from those of the Philippines and Malaysia which also experienced negative CAGRs. In the two countries, the negative CAGRs were due mainly to a decline in the 2008 debt-to-GDP ratio. From the country papers, it is garnered that the declines were attributable to the global financial crisis which led to a marked curtailment in banks’ loans to households for non-consumption purposes. Omitting the 2008 observations, their CAGRs would be slightly positive, in line with the rest of the countries in the high-debt group.
Table 3 shows the ratio of household debt to household disposable income for six countries with data along with four developed economies of Australia, Japan, the U.K., and the U.S. As mentioned earlier, the debt-to-disposable-income ratio is a better indicator of household indebtedness. Against this metric, it is notable that households in Korea, Malaysia, and Taiwan are already as indebted as households in the benchmark developed economies while Indonesia’s and the Philippines’ are still way below, with Thailand somewhat in between.
Table 3
Household Debt to Household Disposable Income Ratios, 2003-2008
Sources: country papers, non-participating-country surveys, MAS Financial Stability Review (2003 figure); BNM Financial Stability and Payment Systems Report 2009; BOK Financial stability Report; CEIC; Author’s calculation.
3.3 Purposes of Household Debt
Turning to the composition of household debt, Figure 1 shows that residential mortgages are the largest component of household debt in most of the SEACEN countries, accounting on average for about one half of total household debt. The sole exception is Indonesia where other personal loans, mostly auto loans, double the amount of mortgage loans, reflecting the underdevelopment of the mortgage market in the country.
Figure 1
Composition of Household Debt in Selected SEACEN Countries, 2008
Sources: country papers; non-participating country surveys
Note: For countries with insufficient data classification, the labels other personal loans and others include the missing loan categories
Incidentally, in several other countries where data permit classification, auto loans represent the second largest component of household debt. The dominance of mortgage and auto loans can be explained by their collateralised nature which helps ameliorate the information asymmetry problems. Nevertheless, in many countries, credit card loans and non-secured personal loans have been growing rapidly in recent years, reflecting in part the region’s improved retail credit risk management capabilities. Still, credit card loans as a share of total household loans/consumer loans remain small in most countries. The most notable exception is the Philippines where credit card loans are only a short way behind mortgage loans. While credit card loans in the country has not reached the scale seen
in Korea where the share of credit card loans in total household loans was 45% in 2002 just before the eruption of the Korean credit card crisis in 2003 (Kang and Ma, 2008), nonetheless their growth and high level have prompted close monitoring by the authorities.
It is noteworthy that for countries where data on household business loans are available, that is, Taiwan, Thailand, and the Philippines (under the “others” label), the proportions of household loans ranged from 24% for Taiwan to 36% for Thailand. This suggests potential for the understatement of total household debt burdens in other SEACEN countries for which household debt figures do not include household loans for business purposes.
3.4 Sources of Household Debt
From the collected data, commercial banks are by far the largest formal provider of household debt in any country. While this is not surprising, it is noteworthy that in a number of SEACEN countries, government development banks or specialised financial institutions do play quite an active role in providing funds to households. In Thailand, for example, the Bank for Agriculture and Agricultural Cooperatives is the main creditor of Thai agricultural households. In Fiji, a similar role was assumed by the Fiji Development Bank whose mandates also extend to SMEs. In Nepal, a whopping 47 out of 59 development banks lend to households. In these three countries, the levels of household loans extended by various government development banks amounted to 68%, 25%, and 14% respectively of the levels of household loans extended by commercial banks at the end of 2008.
Public sector involvement is most visible in the area of housing finance. These include the Fiji Housing Authorities, the Treasury Housing Loan Division of the Malaysian Ministry of Finance, the National Housing Fund in Korea, the Housing Development Board in Singapore, the Government Housing Bank in Thailand, and the Home Development Mutual Fund (Pag-IBIG Fund) in the Philippines. It is noteworthy that the first four entities are not financial institutions.
Playing a tertiary role to commercial banks and government lenders in formal household lending are private non-bank financial institutions. Multinational credit specialists such as Aeon and GE Capital have been quite an instrumental force in the exploding area of personal finance. Japan’s Aeon, perhaps the most aggressive of all credit specialists, has operations in Indonesia, Malaysia, Philippines, Taiwan, Thailand and Vietnam. In contrast, domestic non-bank financial institutions have a stronger hold in traditional secured lending such as
housing and auto loans. In Nepal, finance companies as a group are even more dominant than development banks, reminiscent of the role played by finance companies and credit fanciers companies during pre-1997-crisis Thailand.
Data on informal sources of household debt are available for Sri Lanka, Taiwan, Thailand, and Vietnam. Conceivably, the share of informal debt sources are related to a country’s stage of financial development and this is borne out by the data. In Taiwan and Thailand, where the degree of financial deepening as reflected by the countries’ banking system assets-to GDP-ratios is very high, the informal sources accounted for 5% and 11% respectively of total household debt in 2008/2009 according to the country papers. In contrast, the informal sources accounted for 39% of total household debt in 2004 in Sri Lanka, where the banking system is much smaller (Central Bank of Sri Lanka, 2004). According to Bain and Company (2007), only 2% of Vietnam’s 84 million people have ever taken out a bank loan and about half of rural loans are from informal sources.
Looking at changes in the importance of the informal sources over time is also revealing. In Thailand, prior to the introduction of the government-directed village fund scheme in 2002, the informal sources accounted for 19% of household debt. In Sri Lanka, 60% of household debt in 1987 came from the informal sources. These and the aforementioned data suggest potential roles played by the informal sector in Cambodia, Indonesia, Mongolia, and the Philippines where retail banking is still nascent.
4. Forces Driving Household Indebtedness in the SEACEN Region
In this section, certain factors that have been identified in the literature as being the important driving forces behind the rise in household indebtedness worldwide during the past two decades are examined. A combination of summary statistics, graphs, and simple regressions are used to assess, the role of these factors in explaining household indebtedness in the SEACEN countries.
The theoretical foundation of most empirical analyses of household debt is the Modigliani and Brumberg (1954)’s life cycle model augmented by the presence of some borrowing constraints to allow for credit market imperfection. In this framework, the observed household debt is jointly determined by the demand-side and the supply-demand-side factors. The demand-demand-side factors comprise demographic variables such as age, educational attainment and homeownership, expected future income path, the cost of borrowing, wealth, and risk perception. The supply-side factors comprise the degree of financial access, the ability and willingness
to lend to households by financial institutions, credit market efficiency, related regulation, and financial innovation.
Before examining some of these factors in detail, it is worth noting that a number of these factors correlate with a country’s stage of economic development. Households in rich countries generally have both greater need for and better access to credit than households in poor countries. Figure 2, which plots the 2008 ratios of household debt to GDP of the thirteen SEACEN countries and the four benchmark developed economies of Australia, Japan, the U.K., and the U.S. against each country’s log nominal GDP (PPP) per capita, clearly confirms the hypothesized positive relationship between the level of household indebtedness and a country’s stage of economic development.
Figure 2
Household Debt-to-GDP Ratio versus Log GDP (PPP) per Capita, 2008
Note: 2006 data for Vietnam
Source: Table 2; CEIC; World Economic Outlook database; Author’s calculation
A simple regression equation relating the two variables indicates that their correlation is rather tight. Log GDP (PPP) per capita explains 87 percent of the variation in the debt-to-GDP ratio across the seventeen countries.4 Thus,
___________
4. Dropping the observations of the four developed economies reduces the fit slightly, with the R2 coefficient down to 0.86.
we may conclude from Figure 2 that on average the levels of household indebtedness in SEACEN countries primarily reflect the stages of economic development.
If the fitted line were to be taken as a benchmark for the ideal level of household indebtedness given a country’s stage of development, then among the thirteen SEACEN countries, Fiji and Thailand would be classified as having excessive debt while Indonesia, the Philippines, Singapore, and Sri Lanka would be classified as having too little debt. Nevertheless, given that the data on household debt used here are of different bases and that GDP (PPP) per capita is unlikely to be the sole determination of household debt, these inferences should be viewed as only indicative.
Regardless of the applicability of the above regression, Singapore, the richest country in the sample on a GDP (PPP)-per-capita basis, is so far off from the fitted line that makes it an outlier (noting that the x-axis is in a logarithmic scale). Dropping Singapore from the sample improves R2 to 0.91. Interestingly, using the 2003 data instead of the 2008 data finds the Singapore observation sitting nicely on the regression line. The Singapore experience demonstrates that a very rich country is not always synonymous with a highly indebted country (another notable example is Japan) and that it is possible to significantly reduce household indebtedness in a span of a few years.
Given that countries grow over time, there is a natural tendency for the ratio of household debt to GDP to increase over the years. The logarithmic relationship of Figure 2 implies that the rate of the increase tends to be progressively smaller as a country becomes richer. That poorer countries tend to experience faster increases in indebtedness bodes well with the stylised facts documented in Sector Three.
On the other hand, the fact that the debt-to-GDP in Australia, the U.K., and the U.S. increased at a greater pace than those of the high-debt SEACEN countries suggests that increases in household indebtedness in the three developed countries were perhaps more than warranted by their GDP (PPP) per capita. Indeed, it is the “abnormal” increases in household indebtedness in many advanced countries that prompted investigation into the issue of rising household debt. To this end, the literature attributes much of the rise in household indebtedness in advanced countries during the past two decades to four common factors: (1) the tranquil macroeconomic environment during the Great Moderation period where strong growth amidst low inflation and low macroeconomic volatility led to confidence in future income prospects and higher risk appetite, (2) an
easing of credit constraints associated with financial deregulation and financial innovations, (3) the decline in nominal and real interest rates associated with (1) and (2) that reduced respectively the initial loan repayment ratio and the real funding costs of financial institutions and households, and (4) increases in real house prices that encouraged housing purchases and necessitated larger borrowings. These four factors are discussed in turn in the following within the context of SEACEN economies.
4.1 Macroeconomic Environment
It is undeniable that the five-year period leading up to the global financial crisis in 2008 was a relatively prosperous one for the SEACEN region especially when compared to the period right after the 1997 financial crisis. Indeed, for a number of SEACEN countries, this period could be dubbed the “Great Recovery” period. With the sole exception of Fiji, real GDP growth rates of the thirteen SEACEN economies during the 2004-2008 period would be an envy of many regions in the world (Table 4). However, in terms of inflation, the situation is not so favourable. For most SEACEN countries, inflation had been rising throughout the study period partly due to rising oil prices. In fact, with exceptions of Indonesia and Korea, the average annual inflation rates for 2004-2008 were higher than those for 1998-2003. Thus, while robust economic growth mattered for increases in household indebtedness (with the exception of Singapore, obviously), we may rule out lower inflation as part of the explanations for the rise in household debt in the SEACEN region during the study period.
Table 4
Real GDP Growth and Inflation Rates, 1998-2008
4.2 An Easing of Credit Constraints on the Side of Financial Institutions
In tandem with the robust economic growth during the study period were strong increases in bank lending in many SEACEN countries. For the 1997-crisis-hit countries, it was the resumption in bank loan growth after years of painful tightening. For others, particularly the less developed ones, it was a consequence of financial deepening where loan growth twice real GDP growth was not uncommon.
These developments suggest an easing of overall credit constraints on the side of financial institutions during the study period. On top of greater demand for credit, banks were more able (due to better health) and more willing (due to the robust economic environment) to lend out. Given the increased flexibility, it is not at all a surprise to see a general expansion in household loans during this period. An important question with regards to household loans, however, is whether they grew more or less than financial institutions’ overall loan portfolios.
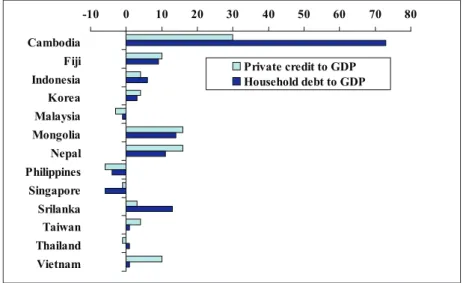
Figure 3 plots the 2003-2008 CAGRs of the ratios of deposit money banks’/ other depository corporations’ private credit to GDP in the thirteen SEACEN countries along with the CAGRs of the ratio of household debt to GDP from Table 2. With an exception of Thailand, the two CAGRs were in the same directions. Positive (negative) growth in private credit to GDP is associated with positive (negative) growth in household debt to GDP.
In seven countries (Cambodia, Indonesia, Malaysia, the Philippines, Sri Lanka, and Thailand), the CAGRs of household debt to GDP outpaced the CAGRs of private credit to GDP, suggesting shifts towards household credit in these countries during the study period. Of the other six countries where household debt grew less than private credit, the most notables are Singapore and Vietnam.
While enlightening, Figure 3 should not be taken as definite because the sources of private credit and the source of household debt in a number of countries are different. Hence, the two figures are not exactly comparable. For example, the household debt figures in several countries correspond to commercial bank loans which are only a subset of private credit extended by deposit money banks/ other depository corporations.
Table 5 looks at the changes in the share of household loans/consumer loans to total loans extended by SEACEN’s commercial banks. Focusing on bank loans circumvents the problem of different bases. Nevertheless, one should keep in mind that it ignores the possible substitutions between borrowings from banks and non-bank lenders. That banks lend more to households does not always mean that household debt will increase in aggregate. For example, in Singapore, much of the increase in financial institutions’ housing loans during the study period was at the expense of the decline of housing loans extended by the Housing Development Board (HDB) as a result of government policy to encourage market-based lending for HDB properties. Looking at housing loans extended by financial institutions in Singapore alone, therefore, misses the fact that total housing loans in Singapore hardly grew during the period.
Figure 3
2003-2008 CAGR of Deposit Money Banks’ Private Credit to GDP and Household Debt to GDP in Selected SEACEN Countries
Source: IFS lines 22d and 99b; Table 2; Central Bank of the Republic of China (Taiwan); author’s calculations
Table 5
Commercial Banks’ Household Loans as Percent of Total Loans, 2003-2008
From Table 5, it is evident that the majority of SEACEN countries saw an increasing proportion of household loans in bank loan portfolios between 2003 and 2008. The exceptions are Fiji, Korea, Philippines, and Singapore of which only Fiji and Singapore experienced trend declines. Singapore’s experience is again striking. Despite the gain from housing loans for HDB properties and strong increases in personal loans during this period, the share of household loans in total loans extended by Singapore’s banks continually lost ground to corporate loans.
In developed economies, the booming securitisation market, the availability of products that facilitate mortgage equity withdrawal, and the push into sub-prime lending in the case of the U.S all favoured household over corporate lending. While none of these apply to SEACEN countries, there are other forces that work in favour of higher shares of household loans in financial institutions’ loan portfolios during the study period.
First, the bases are small. In developed countries, household loans generally account for more than a half of total loans extended by financial institutions. Of the SEACEN countries in our sample, only Malaysia has the share of household loans exceeding the 50 percent mark. Given the small bases, it is not much a surprise to see increasing shares of household loans in a number of SEACEN countries.
Second, improved credit information infrastructure (a number of countries have established before or during the study period, credit bureaus or central credit registries after the 1997 Asian crisis) and improved retail credit risk management technologies such as the adoption of credit scoring models, have made it easier for financial institutions to manage household credit exposures relative to corporate credit exposures.
Third, in several SEACEN countries, the economies during the study period were largely driven by consumption and net exports, for investment spending were relatively subdued partly as a result of the pre-1997 investment booms (International Monetary Fund, 2006). This led many banks in these countries to adopt a retail credit growth strategy that focused on lending to households.
Finally, a number of SEACEN countries have undertaken policy initiatives to increase greater household financial access in their countries. This includes Malaysia’s Financial Masterplan (launched in 2001), Thailand’s Financial Sector Master Plan (2004), and the Indonesian Banking Architecture (2004). Taking all these forces together, it is fairly safe to conclude that part of the increased household indebtedness in SEACEN countries during the study period has been supply-driven.
4.3 Lower Interest Rates
In addition to the easing of credit constraints on the financial institution side, the literature attribute much of the increase in household indebtedness in developed economies to the easing of credit constraints associated with the decline in nominal interest rates and the reduction in real borrowing costs associated with the decline in real interest rates. See, for example, Debelle (2004) and RBA (2003). The impact of the former on household debt undertaking is rather straightforward. When households face credit constraints in the form of ceilings on debt service, a lower nominal interest rate means households can borrow more for the same level of income. On the other hand, the effect of the latter is theoretically ambiguous. While the decline in real interest rates reduces the cost of borrowing, it also reduces the returns on and hence income from household financial assets which in turn discourages borrowings. Nevertheless, Kent et al. (2008) find that developed economies that experienced larger declines in real interest rates from their peaks tended to experience larger increases in the debt-to-income ratio, suggesting that in the real world the substitution effect outweighs the income effect.
Table 6
Nominal and Real Lending Rates, 2003-2008
Note: Real lending rates are calculated using same-year CPI inflation rates Source: IFS line 60p; Author’s calculation
Table 6 shows the level of the nominal and the real lending rates in SEACEN economies between 2003 and 2008. During this period, nominal lending rates in most SEACEN countries exhibited a slight upward trend. Thus, like inflation, the nominal interest rates were likely to act as a brake on household debt accumulation rather than as a positive contributor during the study period.
On the other hand, real lending rates in a number of countries displayed a downward trend during this period as the nominal lending rates rose less than what would be predicted by the Fisher effect. In light of the experiences of developed countries, the fall in real lending rates was likely a boon to the buildup of household debt in these SEACEN countries. In addition, given that the populations of SEACEN countries are younger than those in developed countries, changes in real interest rates likely had greater effects on household debt accumulation in SEACEN countries than in developed countries.
4.4 Rising Real House Prices
The rise in house prices features prominently as one of the major explanations for the rise in household indebtedness in developed economies. For the SEACEN region, seven countries have published real house prices or equivalent data: Indonesia, Korea, Malaysia, Philippines, Singapore, Taiwan, and Thailand. During the 2003-2008 period, the CAGRs of nominal house price indices in the seven countries ranged from a low of 3% for Thailand to a high of 10% for the Philippines, with a simple average of 6%. While the number is impressive, it
is worth noting that it is below the 10% average CAGR for nominal household debt for this set of countries.
More importantly, when it comes to the level of household indebtedness, what matters is real house prices rather than nominal house prices. Here the data paint a much less upbeat picture (Figure 4). Only the Philippines, Singapore, and Taiwan saw significant increases in real house prices during this period. In Korea, Malaysia, and Thailand, real house prices were rather flat while in Indonesia real house prices had been dropping throughout the period. Consequently, one cannot say that rising real house prices were a general trend in SEACEN countries during the study period.
Finally, when one compares the movements in real house prices in these seven countries to the changes in the ratio of household debt to GDP in Table 2, there even seems to be some negative correlation. Singapore, whose real house prices grew the second fastest, experienced a decline in the debt-to-GDP ratio while Indonesia, with continual real house price declines, experienced strong increases in the debt-to-GDP ratio.
Figure 4
Real House Prices in Selected SEACEN Countries (Index, 2003 = 100)
Note: Taiwan (Sinyi Housing Price Index); Singapore (Private Property Price Index); Philippines (Colliers’ Makati Residential Capital Values); Malaysia (NAPIC House Price Index); Korea (Kookmin Bank’s Housing Purchase Price Index); Thailand (GHB SDH with Land Index); Indonesia (Bank Indonesia House Price Index)
Source: country papers; non-participating country survey; WEO; Author’s calculation
4.5 Econometric Results
The discussions thus far focus on the individual factors separately. Table 7 reports the results of pooled OLS regressions of the ratio of household debt-to-GDP on different combinations of log nominal debt-to-GDP (PPP) per capita, real house price, the real lending rate, inflation, and the nominal lending rate. Here, the variable log nominal GDP (PPP) per capita is taken not only as the level of a country’s well-being, but also as a proxy for the country’s degree of financial market flexibility on the supply side. The estimation covers six countries with available house price data with the exception of Singapore, namely, Indonesia, Korea, Malaysia, the Philippines, Taiwan, and Thailand, for the period from 2003 to 2008, for a total of 36 observations. The limited data points render pooled regression the most appropriate option for the modeling purpose.
(1) (2) (3) (4)
Log Nominal GDP per capita 19.5128*** 19.6367*** 19.6024*** 19.5747***
(9.974) (10.03) (9.709) (9.937)
Real housing price index -0.1977 -0.1948 -0.2022
(-1.210) (-1.185) (-1.193)
Real lending rate -2.9525*** -2.6220***
(-3.386) (-3.144)
Inflation -4.2403*** -1.3873* -3.9427***
(-6.185) (-1.739) (-6.117)
Nominal lending rate -2.7406*** -3.6830***
(-3.309) (-5.703) Constant -66.0596** -68.2314** -65.7368** -89.5012*** (-2.359) (-2.441) (-2.283) (-4.392) Observations 36 36 36 36 Adjusted R-squared 0.935 0.934 0.930 0.934 F 126.1 124.5 155.2 165.3 t-statistics in parentheses *** p<0.01, ** p<0.05, * p<0.1 Table 7
Estimation Results from Pooled Regression of the Debt-to-GDP Ratio on Potential Explanatory Variables
In general, the regression results concur with the earlier discussions. All regression coefficients except that of real house price are significant and are of the expected signs. Despite strong economic growth and falling real interest rates in the six sample countries, rising inflation and nominal lending rates served to hold down increases in household indebtedness while changes in real house
price appeared unrelated to the dynamics of the household debt-to-GDP ratio during the study period. Quantitatively, a 1%-growth in nominal GDP (PPP) per capita is associated with an increase of the household debt-to-GDP ratio by 0.2 percentage point which may be regarded as the underlying trend growth in household indebtedness. A 100-basis point reduction in the real and the nominal lending rate boosts the ratio of household debt to GDP by about 3 percentage points while a reduction of the inflation rate by the same magnitude increases the ratio by about 4 percentage points.
4.6 Individual Country Results
Three of the five country papers (the Philippines, Taiwan, and Thailand) contain time series estimation of household debt evolution in the respective countries. The data used in the country estimations are in quarterly frequency and cover a longer period than the above panel data estimation. The three papers also use the amount of household debt as the dependent variable as opposed to the use of the ratio of household debt to GDP in this chapter.5
In both the Taiwan and the Thailand studies, an estimated error correction model is employed. In the Taiwan study, the dependent variable is the log real household debt while in the Thailand study, the log real consumer loans is used. For Taiwan, it is found that the long-run dynamics of real household debt is governed by real house price, the housing stock, the unemployment rate and the nominal lending rate while changes in real household disposable income also matter for the short-run dynamics.
For Thailand, farm price and real GDP explain most of the variation of real consumer loans in the long-run. The significance of farm price as an explanatory variable may be due to the fact that a little below 40 percent of Thai households are agricultural households. For the short-run estimation, changes in house price and lagged consumer loans also play a role.
Due to a shorter data set, an OLS regression methodology is chosen for the case of the Philippines (the Philippines data set is from 2001 Q1 to 2009 Q1 whereas the Taiwan and the Thailand data sets are from 1997 Q2 and 1998
___________
5. In other words, the country researchers are interested in modeling the evolution of household debt while the integrative chapter is interested in modeling the evolution of household indebtedness which is more customary in the literature. The country researchers’ modeling strategy was motivated by an attempt to have some linkages between a household NPL model and a household debt model in a way that a stress test can be performed without assuming path of household debt that may be inconsistent with assumptions on other macro and financial variables.
Q3, respectively, to 2009 Q2). In this case, however, three dependent variables are used: credit card loans, residential real estate loans, and total household loans, all in nominal terms. Household consumption, as measured by private consumption expenditure (PCE), is found to be the most important explanatory variable for all three cases. The nominal lending rate has a significant effect on credit card and residential real estate loans, but not on total household loans.
In terms of the overall goodness of fit, the three estimated models are no different than the long-run equations in the Taiwan and the Thailand cases where over 90 percent of the variations of the dependent variables can be explained. Nevertheless, the results for the Philippines highlight the fact that aggregate household loans may behave differently from the individual components and that in a more rigorous exercise, regressions of different loan types should be pursued. Without the estimation results of credit card and residential real estate loans, one may conclude wrongly from the estimation results of total household loans, that the lending rate is irrelevant to the determination of household debt in the Philippines.
5. Implications for Financial Stability
How severe household indebtedness may affect financial stability basically depends on two considerations – the ability of households to service their debts and the exposures of the financial system (not just commercial banks’) to household debt. In the U.S., banks thought they were safe because they had off-loaded household credit risk through securitisation, only to see the risk remain in the form of market risk through their exposures to the ABS and the CDO assets.
5.1 Financial System’s Exposure to the Household Sector
In the SEACEN region where the securitisation markets remain miniscule with an exception of Korea, there is little worry about capital market exposure. In light of data unavailability, only exposures of commercial banks will be examined in this integrative report and the country papers. Given that commercial banks are the largest formal providers of household loans, this focus is justified. In more comprehensive work, it is important to keep in mind, however, that other types of financial institutions with systemic importance need to be considered as well. In some countries, this would include certain state development banks while in others, it may be the finance companies that need scrutiny. Nakornthab (2006), which looks at credit risk of Thailand’s Bank for
Agriculture and Agricultural Cooperatives, provides an example of such assessments.
From Table 5, we know that in most SEACEN countries, commercial banks’ exposures to the household sector are low to moderate. Only Korea, Malaysia, and Taiwan have shares of household loans to total loans greater than 40 percent. The low proportions of household loans in the aggregate loan portfolios plus the fact that household loans are generally less risky individually but more diversified collectively than corporate loans, mean that risk to financial stability posed by household loans in SEACEN countries is lower than that posed by corporate loans.
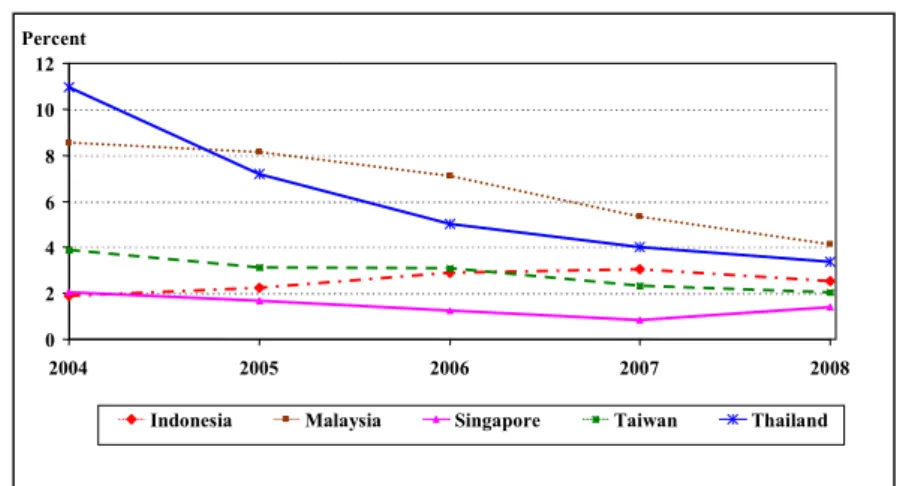
Figure 5 shows commercial banks’ non-performing loan (defined as loans more than three months past due) ratios in a subset of SEACEN countries from 2004 to 2008. These ratios are lower than those of total loans (data not shown), reflecting lower credit risk of household loans relative to corporate loans. More importantly, the ratios exhibit a general downward trend which indicates declining household credit risk during the period.
Figure 5
Non-performing Loan Ratios in Selected SEACEN Economies, 2004-2008
Source: country papers; non-participating-country surveys
Note: Singapore’s NPL figures were calculated as weighted averages of NPL ratios for housing and professional and private individual loans
Still, compared to the international standard of 2 percent or below NPL ratio in normal times (in which Singapore is a good example), the NPL ratios of the other SEACEN countries, particularly Malaysia and Thailand, appeared somewhat high. Nevertheless, it should be noted that parts of the high NPL ratios in Malaysia and Thailand were legacies of the 1997 Asian financial crisis when NPL ratios in the two countries were in double digits.6 In terms of delinquency rates (generally defined as one to three months past due; data not shown), which are better indicators of default risk although not of the overall credit quality of the loan portfolio, the situations were closer to international norms.
The composition of household loans/consumer loans also matters greatly for the credit risk of the loan portfolio. In general, the order of increasing default risk is from mortgage loans to household business loans to unsecured personal loans, as reflected by their increasing interest rates. Taking the re-sale value of the collaterals and the time of foreclosure and liquidation which together determine loss given default into account, the expected loss rates also follow the same order. Thus, household loan portfolios loaded with mortgage loans will, in general, be of better quality than household loan portfolios loaded with personal loans. The exception is when there is a bust of a property price bubble that has led to excessive mortgage loan growth and inflated collateral values. This explains why the NPL ratio of mortgage loans in Thailand is higher than those of other consumer loans even though their delinquency rate has been the lowest for quite some time.
Against this backdrop, banks in the Philippines appear most vulnerable in terms of household credit risk, as their household loan portfolios are loaded by non-mortgage loans (Figure 1). The situation is further aggravated by the fact that the rate of consumer credit defaults in the Philippines almost triples the average in Asia (Estayo, 2008). In light of these observations, it is not a surprise to note that Bangko Sentral ng Pilipinas is keen on establishing a credit bureau to improve discipline in the credit market as well as launching the country’s first consumer finance survey to address the consumer credit data gap (Tan, 2008).
5.2 Household Debt Service Ability
This subsection looks at two key indicators of household debt service ability. The first is the debt-to-financial-asset ratio which is a measure of household
___________
6. Indonesia, the other country in this sample that was also affected by the 1997 crisis, did a better job at cleaning up banks’ balance sheets.
leverage. The second is the debt service ratio, defined as household debt payment to disposable income, which is a measure of household debt service obligations. Due to data availability, only a small subset of SEACEN countries can be examined. Tables 8 and 9 presents the evolution of the two indicators in these SEACEN countries along with those in benchmark developed economies from 2003 to 2008. Table 9 also reveals that the debt service ratio is the hardest indicator to acquire, with only five SEACEN countries reporting the data.
It is important to keep in mind before we proceed that the numbers reported in Tables 8 and 9 are averaged figures. Typically, debt burden falls disproportionately harder on low-income borrowers which also have few, if any, financial assets. Thus, the numbers may mask the extent of the risk facing the economies.
Table 8
Household Debt to Household Financial Assets Ratio, 2003-2008
Table 8 reveals a striking fact. Households in Indonesia, Korea, Malaysia, and Thailand appear more leveraged than the “over-extended” western households. For US$1 of financial asset, households in the four countries, on average, take on more than 40 cents of debt compared to twenty-some cents for the four benchmark developed economies. In terms of movement, the ratio is increasing in Indonesia, the Philippines, and Thailand, roughly stable in Korea, Malaysia, and Taiwan, and declining in Singapore.
Source: country papers; non-participating-country surveys; Federal Reserve Board; Financial Stability Reports of Australia, and the U.K.
The high debt-to-financial-asset ratios in several SEACEN countries reflect in part the tendency for SEACEN households to have most of their assets in the form of real assets, of which the majority are real estates. If total assets are used in place of financial assets, the situation would appear less overstretched. For example, Thailand’s ratio of household debt-to-total assets is 12 percent while Indonesia’s is a marginal 2 percent. Nevertheless, given that real assets are generally much more difficult to liquidate than financial assets, households are still vulnerable to shocks even though they may be solvent,
Table 9
Household Debt Service Ratios, 2003-2008
Source: country papers; non-participating-country surveys; Federal Reserve Board; Financial Stability Reports of Australia, Korea, and the U.K.
Still, one cannot look at Table 8 in isolation. From Table 2, it is recalled that Indonesian household debt-to-disposable-income ratio, while growing strongly, was still below 10 percent as of 2008. This means they can easily take on even more debt. The light debt burden of Indonesian households is confirmed by Table 9 which shows that the ratio of interest payment on loans to household disposable income in Indonesia households is 1.5 percent compared to 8 percent in Korea and roughly 10 percent in developed economies.
To have a more complete picture of household debt service obligations, we need to add principal repayment on top of interest payment before dividing by disposable income. This is because the interest-only debt service ratio may provide a misleading picture of household debt burden in a low interest rate but high debt environment. In this case, the benchmark for comparison is the U.S. financial obligations ratio published by the Federal Reserve. Here it should be noted that the debt service ratios for both Malaysia and Taiwan are strikingly high at roughly 40 percent, more than twice the level of the U.S. and Thai ratios and higher than a general rule of thumb of a 30-percent ceiling on the ratio of debt payment to income.