Association Between Hospital Process
Performance and Outcomes Among Patients
With Acute Coronary Syndromes
Eric D. Peterson, MD, MPH Matthew T. Roe, MD, MHS Jyotsna Mulgund, MS
Elizabeth R. DeLong, PhD, MS Barbara L. Lytle, MS
Ralph G. Brindis, MD Sidney C. Smith, Jr, MD Charles V. Pollack, Jr, MD, MA L. Kristin Newby, MD, MHS Robert A. Harrington, MD W. Brian Gibler, MD E. Magnus Ohman, MD
A
SSESSMENT OF QUALITY INhealth care delivery plays an increasingly prominent role in contemporary medical practice. Government agencies, pro-fessional societies, accreditation orga-nizations, and major insurers all have published sets of performance indica-tors, including process of care mea-sures proposed to be reflective of insti-tutional quality of care.1 - 4 These performance indicators are now used for determining hospital referral pat-terns5in public reports,6and even for determining hospital reimburse-ment.7,8Although widely used, these process-based performance systems are based on the concept that more consistent use of selected therapies by hospitals will result in better patient outcomes. However, to date, there has been limited published evidence dem-onstrating that hospital process
perfor-Author Affiliations:Duke Clinical Research Institute, Duke University Medical Center, Durham, NC (Drs Pe-terson, Roe, Delong, Newby, Harrington, and Ohman, and Mss Mulgund and Lytle); Kaiser-Permanente Health System, San Francisco, Calif (Dr Brindis); Uni-versity of North Carolina, School of Medicine, Chapel Hill (Dr Smith); Pennsylvania Hospital, University of
Pennsylvania, Philadelphia (Dr Pollack); and Univer-sity of Cincinnati School of Medicine, Cincinnati, Ohio (Dr Gibler).
Corresponding Author:Eric D. Peterson, MD, MPH, Duke Clinical Research Institute, 2400 Pratt St, Room 7009, Durham, NC 27705 ([email protected] .edu).
Context Selected care processes are increasingly being used to measure hospital qual-ity; however, data regarding the association between hospital process performance and outcomes are limited.
Objectives To evaluate contemporary care practices consistent with the American College of Cardiology/American Heart Association (ACC/AHA) guideline recommen-dations, to examine how hospital performance varied among centers, to identify char-acteristics predictive of higher guideline adherence, and to assess whether hospitals’ overall composite guideline adherence was associated with observed and risk-adjusted in-hospital mortality rates.
Design, Setting, and Participants An observational analysis of hospital care in 350 academic and nonacademic US centers of 64 775 patients enrolled in the CRUSADE (Can Rapid Risk Stratification of Unstable Angina Patients Suppress Adverse Out-comes With Early Implementation of the ACC/AHA Guidelines) National Quality Im-provement Initiative between January 1, 2001, and September 30, 2003, presenting with chest pain and positive electrocardiographic changes or cardiac biomarkers con-sistent with non–ST-segment elevation acute coronary syndrome (ACS).
Main Outcome Measures Use of 9 ACC/AHA class I guideline-recommended treat-ments and the correlation among hospitals’ use of individual care processes as well as overall composite adherence rates.
Results Overall, the 9 ACC/AHA guideline-recommended treatments were ad-hered to in 74% of eligible instances. There was modest correlation in hospital per-formance among the individual ACS process metrics. However, composite adherence performance varied widely (median [interquartile range] composite adherence scores from lowest to highest hospital quartiles, 63% [59%-66%] vs 82% [80%-84%]). Com-posite guideline adherence rate was significantly associated with in-hospital mortal-ity, with observed mortality rates decreasing from 6.31% for the lowest adherence quartile to 4.15% for the highest adherence quartile (P⬍.001). After risk adjustment, every 10% increase in composite adherence at a hospital was associated with an analo-gous 10% decrease in its patients’ likelihood of in-hospital mortality (adjusted odds ratio, 0.90; 95% confidence interval, 0.84-0.97;P⬍.001).
Conclusion A significant association between care process and outcomes was found, supporting the use of broad, guideline-based performance metrics as a means of as-sessing and helping improve hospital quality.
mance is an accurate marker of centers with better patient outcomes.9,10
Non–ST-segment elevation (NSTE) myocardial infarction (MI) acute coro-nary syndrome (ACS) accounts for more than 1.6 million annual admis-sions, representing up to 75% of all cases of MI in US hospitals.11 Appro-priate care for patients with NSTE ACS is informed by a wealth of recent ran-domized controlled trials whose find-ings have been summarized into na-tional clinical practice guidelines by the American College of Cardiology/ American Heart Association (ACC/ AHA).11 Despite this evidence, prior studies have demonstrated gaps in the use of evidence-based care of NSTE ACS that are wider than those observed in patients with ST-segment elevation MI.12To date, however, no informa-tion has been available for defining the degree to which NSTE ACS care var-ies among individual hospitals or for demonstrating an association be-tween hospitals’ NSTE ACS process per-formance and patient outcomes.
Using data from a large quality im-provement initiative, the CRUSADE (Can Rapid Risk Stratification of Un-stable Angina Patients Suppress Ad-verse Outcomes With Early Implemen-tation of the ACC/AHA Guidelines) National Quality Improvement Initia-tive,13,14we characterized the degree to which contemporary NSTE ACS care is consistent with guideline recommenda-tions as well as the variation in specific care processes among 350 US hospitals. We evaluated the degree to which hos-pital performance varied among indi-vidual process metrics and identified hos-pital characteristics that were predictive of higher adherence to guidelines. Fi-nally, we assessed whether hospitals’ overall measure of composite adher-ence to these ACC/AHA guideline met-rics was associated with observed and risk-adjusted in-hospital mortality rates.
METHODS Data Source
CRUSADE is an ongoing voluntary, ob-servational data collection and quality improvement initiative, which began
January 1, 2001.13-16CRUSADE cen-ters collect and submit clinical infor-mation regarding the in-hospital care and outcomes of patients with NSTE ACS with high-risk clinical features. All patients must present at a CRUSADE hospital within 24 hours of ischemic symptoms lasting at least 10 minutes in combination with either positive car-diac markers (troponin or creatine ki-nase) or ischemic ST-segment electro-cardiographic changes (ST depression or transient ST-segment elevation). Participating institutions are in-structed to submit consecutive eli-gible patients to the CRUSADE data-base; however, global onsite validation was not feasible. All participating institutions were required to comply with their local regulatory and privacy guidelines and to submit the CRUSADE protocol for review and approval by their institutional review board (or the equivalent). Because data were used pri-marily at the local site for quality im-provement, all sites were granted a waiver of informed consent under the common rule. The data coordinat-ing center had data use agreement with each site to analyze the ag-gregate deidentified data for research purposes.
Data are abstracted by a trained data collector at each hospital using stan-dardized definitions. Variables in-clude demographic and clinical infor-mation, including clinical presentation, medical history, treatments adminis-tered, as well as associated major con-traindications to evidence-based thera-pies, and in-hospital outcomes. Once collected, deidentified data are en-tered via a Web-based data collection tool and aggregated into an analytical database.17
Various procedures were used to monitor and improve the data quality of the CRUSADE database. At point of entry, values that exceed expected ranges or are inconsistent with other data prompt notification. Additionally, quarterly site reports summarize any data quality problems observed in sub-mitted data. Sites reporting with out-lier mortality results (beyond those
predicted) and variable case submis-sion rates also receive routine notifica-tion and follow-up to ensure that enrollment is nonselective and all adverse events are reported. The resultant degree of missing data are quite low, averaging less than 5% across all collected data elements. Additionally, in 2002, a formal audit was conducted of 25% of randomly selected CRUSADE sites. Trained monitors reabstracted information and found an overall agreement rate of 94.8% between submitted data and reabstracted results.
Study Population
Between January 1, 2001, and Septem-ber 30, 2003, 427 CRUSADE hospi-tals enrolled 77 760 patients with NSTE ACS. We excluded 9155 patients who transferred from a participating hospi-tal, because longitudinal end point as-sessment was not possible. We further restricted this analysis to CRUSADE hospitals that had submitted at least 40 records and having at least 1 reported death during the study period to de-fine a threshold for stable site-level per-formance assessment (77 hospitals and 3830 patients were excluded), result-ing in 64 775 patients with NSTE ACS who were treated at 350 CRUSADE hos-pitals.
Statistical Analyses
dying anytime during their hospital stay were excluded from the discharge care assessment. Patient composite adher-ence scores were then calculated as the sum of correct care, provided from the patient’s total number of eligible oppor-tunities. Results were then summated at the hospital level. Although composite scores were analyzed as continuous vari-ables, hospitals were also divided for de-scriptive purposes into quartiles based on these continuous variables.
Demographic and clinical character-istics, medication and procedure use, and in-hospital mortality were com-pared among these hospital adher-ence quartiles. Median values with in-terquartile ranges (IQRs) were used to describe continuous variables, and numbers (percentages) were reported for categorical variables. The associa-tions between baseline characteristics and hospital features and composite hospital scores were assessed using lin-ear regression. The correlation to the adherence rates of the hospitals for in-dividual process measures and be-tween adherence rates and in-hospital mortality were assessed using Pearson correlation coefficients. The associa-tion between hospital composite score quartiles and unadjusted outcomes was assessed using the Cochran-Armitage test for trend.
Adjusted mortality rates were deter-mined by using the generalized linear mixed model method.18 The
general-ized linear mixed model uses a hierar-chical approach to allow adjustment not only for risk factors but also within and between site effects. We adjusted for risk factors, which included age, sex, body mass index (calculated as weight in kilograms divided by height in meters squared), race, insurance status, family history of coronary disease, hypertension, dia-betes mellitus, current/recent smoker, hypercholesterolemia, prior MI, prior percutaneous coronary intervention, prior coronary artery bypass graft (CABG) surgery, prior congestive heart failure, prior stroke, renal insuf-ficiency (defined as serum creatinine level⬎2.0 mg/dL [⬎176.8 µmol/L]), blood pressure, heart rate, ST segment (depression, transient elevation, or neither), presenting signs of conges-tive heart failure, posiconges-tive cardiac markers, and a patient’s propensity to be treated at a top quartile center. The propensity score was constructed using multivariable logistic regression and contained those patient character-istics associated with being treated at a leading center. We then added a hos-pital characteristic, the composite adherence score for the hospital caring for the patient, to the mortality model. TheCindex for the overall mortality model was 0.82.
Additionally, we performed a series of sensitivity analyses. We repeated analyses after limiting our population to those patients with a documented MI based on an increased troponin or creatinine kinase assay within 18 hours of admission and again after limiting our sample to high-risk elderly patients aged 65 years or older. We then repeated our analyses after excluding any patient who died within the first 24 hours of hospitalization and again after including use of in-hospital revascularization proce-dures as a covariant in the mortality modeling analysis. We also repeated analyses after expanding our patient sample to all 427 CRUSADE centers, including those with less than 40 cases, and repeated once again after limiting the sample to those centers
performing CABG surgery (n = 238 hospitals and n = 53 989 patients), in which rates of censure due to transfer were less than 5%.
Finally, we performed a matched-pair propensity analysis as an alterna-tive means of adjusting our findings for potential patient selection bias among sites. Specifically, using the propensity score noted above, we matched pairs of patients treated at leading centers vs treated at nonlead-ing centers. Matchnonlead-ing was performed using the greedy algorithm with a maximum of a 5-digit match. We then assessed observed mortality rates among the similar matched patient pairs.
A 2-sidedP⬍.05 was established as the level of statistical significance for all tests. All analyses were performed by using SAS software version 8.2 (SAS Institute, Cary, NC).
RESULTS
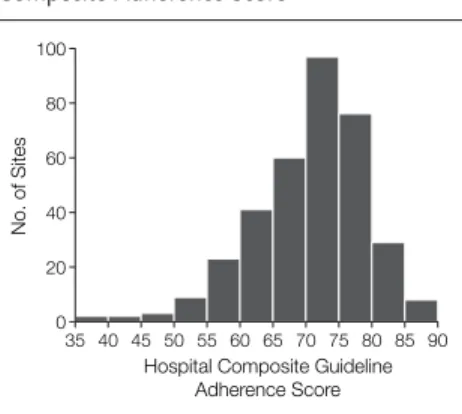
Our overall analysis sample comprised 64 775 patients with NSTE ACS who presented to 350 CRUSADE hospitals. The median number of patients treated per center was 139, and the median number of opportunities to provide 1 of the 9 guideline-based treatments was 1042 per center. Overall, care deci-sions were consistent with guideline recommendations in 74% of total treat-ment opportunities. Composite guide-line adherence scores, however, varied considerably among US hospitals (FIGURE1). The hospitals in the high-est quartile (quartile 4) had a median (IQR) composite adherence score of 82% (80%-84%) compared with 63% (59%-66%) for hospitals in the lowest adherence quartile (quartile 1).
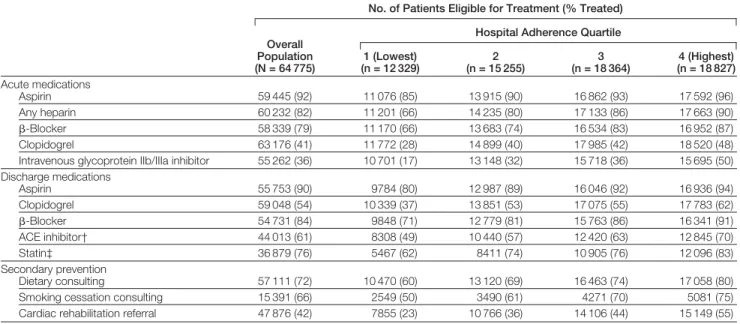
TABLE1shows the variability in the use of individual guideline-recom-mended therapies among patients with-out contraindications. Hospitals with the highest composite adherence score (quartile 4) had higher average perfor-mance on all the acute, discharge, and secondary prevention metrics. Within the acute measures, aspirin exhibited the lowest degree of variance, although the difference between the first and fourth
Figure 1.Frequency Distribution of Sites’ Composite Adherence Score
100
60
40 80
20
0
Hospital Composite Guideline Adherence Score
No. of Sites
35 40 45 50 55 60 65 70 75 80 85 90
quartiles remained significant. In con-trast, there were 2- to 3-fold differ-ences in the use of newer ACS
thera-pies, such as intravenous glycoprotein IIb/IIIa inhibitors and use of clopido-grel at discharge. Use of secondary
pre-vention interpre-ventions also tended to be 20% to 30% higher among hospitals in quartile 4 vs hospitals in quartile 1.
Table 1.Variation in Care Processes by Hospital*
No. of Patients Eligible for Treatment (% Treated)
Overall Population (N = 64 775)
Hospital Adherence Quartile
1 (Lowest) (n = 12 329)
2 (n = 15 255)
3 (n = 18 364)
4 (Highest) (n = 18 827)
Acute medications
Aspirin 59 445 (92) 11 076 (85) 13 915 (90) 16 862 (93) 17 592 (96)
Any heparin 60 232 (82) 11 201 (66) 14 235 (80) 17 133 (86) 17 663 (90) -Blocker 58 339 (79) 11 170 (66) 13 683 (74) 16 534 (83) 16 952 (87) Clopidogrel 63 176 (41) 11 772 (28) 14 899 (40) 17 985 (42) 18 520 (48) Intravenous glycoprotein IIb/IIIa inhibitor 55 262 (36) 10 701 (17) 13 148 (32) 15 718 (36) 15 695 (50)
Discharge medications
Aspirin 55 753 (90) 9784 (80) 12 987 (89) 16 046 (92) 16 936 (94)
Clopidogrel 59 048 (54) 10 339 (37) 13 851 (53) 17 075 (55) 17 783 (62) -Blocker 54 731 (84) 9848 (71) 12 779 (81) 15 763 (86) 16 341 (91) ACE inhibitor† 44 013 (61) 8308 (49) 10 440 (57) 12 420 (63) 12 845 (70)
Statin‡ 36 879 (76) 5467 (62) 8411 (74) 10 905 (76) 12 096 (83)
Secondary prevention
Dietary consulting 57 111 (72) 10 470 (60) 13 120 (69) 16 463 (74) 17 058 (80) Smoking cessation consulting 15 391 (66) 2549 (50) 3490 (61) 4271 (70) 5081 (75) Cardiac rehabilitation referral 47 876 (42) 7855 (23) 10 766 (36) 14 106 (44) 15 149 (55)
Abbreviation: ACE, angiotensin-converting enzyme.
*Quartiles grouped by equal number of hospitals based on overall composite adherence (n = 87 for lowest and highest performing quartiles and n = 88 for middle 2 quartiles). All
Pfor trend⬍.001 for medication use across hospital quartiles.
†In patients with hypertension, diabetes mellitus, documented left ventricular ejection fraction of less than 40%, and/or presenting coronary heart failure. ‡Use among patients with history of dyslipidemia or documented low-density lipoprotein level of more than 100 mg/dL (⬎2.59 mmol/L).
Table 2.Baseline Characteristics by Hospital Adherence Quartile*
Characteristics
Overall Population (N = 64 775)
Hospital Adherence Quartile
1 (Lowest) (n = 12 329)
2 (n = 15 255)
3 (n = 18 364)
4 (Highest) (n = 18 827)
Age, median (IQR), y 68 (56-79) 70 (57-80) 69 (57-79) 69 (57-79) 67 (55-77)
Female sex 26 240 (41) 5448 (44) 6309 (41) 7368 (40) 7115 (38)
Nonwhite† 11 778 (19) 2943 (25) 2546 (18) 2851 (17) 3420 (19)
Insurance, self-pay 4162 (6) 787 (6) 875 (6) 1045 (6) 1455 (8)
At admission
Systolic BP, median (IQR), mm Hg 144 (123-165) 142 (121-163) 143 (123-164) 145 (125-166) 144 (123-165) Heart rate, median (IQR), beats/min 82 (70-98) 84 (71-100) 82 (70-98) 82 (70-98) 80 (68-96) Conditions
CHF on admission 14 568 (22) 3019 (24) 3689 (24) 40 476 (22) 3784 (20) ST depression 25 632 (40) 4612 (37) 6588 (43) 7527 (41) 6905 (37) Hypertension 44 673 (69) 8499 (69) 10 608 (70) 12 459 (68) 13 107 (70) Diabetes mellitus 21 179 (33) 4184 (34) 5032 (33) 5933 (32) 6030 (32) Renal insufficiency 9039 (14) 1712 (14) 2155 (14) 2665 (15) 2507 (13)
Dyslipidemia 30 290 (47) 4676 (38) 7062 (46) 703 (47) 9849 (52)
Obesity (BMI⬎30) 20 347 (31) 3416 (28) 4740 (31) 5871 (32) 6320 (34) Current/recent smoker 17 490 (27) 2965 (24) 4094 (27) 4871 (26) 5485 (30) Family history 22 798 (35) 4127 (34) 5769 (38) 6218 (34) 6684 (36)
Prior MI 20 004 (31) 3587 (29) 4747 (31) 5970 (33) 5700 (30)
Prior CHF 12 230 (19) 2673 (21) 2920 (19) 3465 (19) 3172 (17)
Prior stroke 7720 (11) 1481 (12) 1730 (11) 1993 (11) 2016 (11)
Abbreviations: BMI, body mass index, calculated as weight in kilograms divided by height in meters squared; BP, blood pressure; CHF, congestive heart failure; IQR, interquartile range; MI, myocardial infarction.
*Data presented as number (percentage) unless otherwise specified. Quartiles grouped by equal number of hospitals based on overall composite adherence (n = 87 for lowest and highest performing quartiles and n = 88 for middle 2 quartiles).
Clinical characteristics for the over-all patient sample and by hospital ad-herence quartile are shown inTABLE2. Patients treated at hospitals with lower composite adherence tended to be slightly older, not white, and had slightly more comorbid illness.
Hospital features associated with guideline adherence quartiles are shown inTABLE3. Although larger hospitals and those with teaching affiliations tended to have higher unadjusted composite adherence
scores, the only multivariable predic-tors identified were presence of car-diac revascularization facilities and the proportion of patients treated primar-ily by a cardiologist.
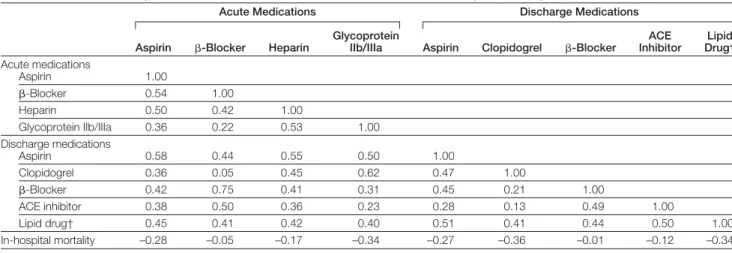
The correlation between a hospi-tal’s use of an individual guideline-recommended therapy, as well as its composite adherence rate, and in-hospital mortality are shown in TABLE4. Hospital performance on a single process measure had a modest correlation with that for a different
mea-sure (Pearson correlation coefficient range, 0.3-0.5). However, a signifi-cant inverse correlation was shown be-tween hospitals’ use of individual care processes and in-hospital mortality rates for nearly all therapies. Among indi-vidual recommended medications, the highest associations between use and mortality were observed for acute in-travenous glycoprotein IIb/IIIa inhibi-tors, discharge clopidogrel, and dis-charge lipid-lowering agents. The overall hospital composite adherence score based on all 9 ACC/AHA guide-line recommendations also demon-strated a similar negative association with in-hospital mortality (r= −0.30, P⬍.001).
Unadjusted in-hospital patient out-comes as a function of hospital com-posite guideline adherence rates for the overall NSTE ACS population and when limited to those patients with a docu-mented MI (NSTEMI, n = 57 260) are shown inTABLE5. Overall in-hospital mortality rates observed in the 2 popu-lations were 4.93% (3192/64 775) and 5.28% (3022/57 260), respectively. In-hospital death and combined death and MI rates decreased sequentially as a function of guideline adherence in both the overall and NSTEMI populations (bothP⬍.001). The associations be-tween hospital guideline adherence and
Table 3.Univariable and Multivariable Predictors of Leading Centers With Highest Quartile ACC/AHA Guideline Adherence Rates
Predictors % Overall
OR (95% CI)*
Univariable Association
Multivariable Association
Bedsize per 10 increase, median (IQR) 331 (223-460) 1.05 (1.01-1.12)
Surgical capacity 68 4.31 (2.18-8.50) 2.43 (1.18-5.03)
Teaching facility 25 2.37 (1.40-4.00)
Patients treated by cardiologist 57 1.03 (1.02-1.04) 1.03 (1.01-1.04)
Region
Northeast 27 0.69 (0.35-1.36)
South 36 1.00
Midwest 25 1.66 (0.90-3.04)
West 13 1.35 (0.63-2.90)
Duration in CRUSADE, median (IQR), mo 21 (15-24) 1.01 (0.92-1.17)
Abbreviations: ACC/AHA, American College of Cardiology/American Heart Association; CI, confidence interval; CRUSADE, Can Rapid Risk Stratification of Unstable Angina Patients Suppress Adverse Outcomes With Early Implementation of the ACC/AHA Guidelines; IQR, interquartile range; OR, odds ratio.
*Odds ratios reflect a hospital’s likelihood of being a leading center in the highest quartile vs those that are not a lead-ing center in the highest quartile. Covariates included in multivariable model include number of hospital beds, hos-pital with coronary artery bypass graft surgery capacity, hoshos-pital member of Council of Teaching Hoshos-pitals, percent-age of hospitals’ patients with non–ST-segment elevation acute coronary syndrome treated by a cardiologist, hospital region, and number of months that the site had participated in CRUSADE.
Table 4.Correlation in Hospital Individual Care Processes Performance and Centers’ In-Hospital Mortality Rates*
Acute Medications Discharge Medications
Aspirin -Blocker Heparin
Glycoprotein
IIb/IIIa Aspirin Clopidogrel -Blocker
ACE Inhibitor
Lipid Drug†
Acute medications
Aspirin 1.00
-Blocker 0.54 1.00
Heparin 0.50 0.42 1.00
Glycoprotein IIb/IIIa 0.36 0.22 0.53 1.00
Discharge medications
Aspirin 0.58 0.44 0.55 0.50 1.00
Clopidogrel 0.36 0.05 0.45 0.62 0.47 1.00
-Blocker 0.42 0.75 0.41 0.31 0.45 0.21 1.00
ACE inhibitor 0.38 0.50 0.36 0.23 0.28 0.13 0.49 1.00
Lipid drug† 0.45 0.41 0.42 0.40 0.51 0.41 0.44 0.50 1.00
In-hospital mortality –0.28 –0.05 –0.17 –0.34 –0.27 –0.36 –0.01 –0.12 –0.34
Abbreviation: ACE, angiotensin-converting enzyme.
*Pearson correlation describing the association between in-hospital use of 2 care processes in eligible patients (eg, use of acute aspirin and-blocker) or use of a care process and in-hospital mortality. AllP⬍.05 except correlation between acute-blocker and clopidogrel (P= .38), acute-blocker and mortality (P= .35), and discharge-blocker and mor-tality (P= .82).
rates of stroke and congestive heart fail-ure were less strong.
FIGURE2displays risk-adjusted mor-tality rates as a function of composite ACC/AHA guideline adherence for the overall NSTE ACS and NSTEMI popu-lations. After adjustment for patient demographic and clinical features, the mortality rate of patients with NSTE ACS decreased from 6.31% for quar-tile 1 vs 4.15% for quarquar-tile 4 (P⬍.001); adjusted odds ratio (OR) for in-hospital mortality in the highest vs the lowest hospital adherence quartiles was 0.81 (95% confidence interval [CI], 0.68-0.97). When evaluated as a con-tinuous function, every 10% increase in overall composite guideline adher-ence was associated with a correspond-ing decrease in a patient’s likelihood of death at that hospital by an analogous 10% (adjusted OR, 0.90; 95% CI, 0.84-0.97;P⬍.001).
Sensitivity analyses demonstrate that the results and conclusions found were robust when tested in a variety of popu-lations and situations. Among pa-tients with NSTEMI, mortality rates de-creased from 7.68% (760/9892) for quartile 1 to 4.32% (718/16 622) for quartile 4 (adjusted mortality OR, 0.77; 95% CI, 0.64-0.93;P⬍.001). Simi-larly, the hospital adherence-outcome association was unaffected by patient age (formal test of an age-adherence score interaction,P= .39). Among pa-tients aged 65 years or older, mortal-ity rates ranged from 8.88% (671/ 7557) for quartile 1 to 6.12% (631/ 10 309) for quartile 4 (adjusted mortality OR, 0.83; 95% CI, 0.69-0.93). Our results remained substan-tially similar if we adjusted our find-ings for in-hospital revascularization procedures or excluded those patients with early deaths within 24 hours. Our results were consistent if we ex-panded our analysis to include all 427 CRUSADE hospitals regardless of sample size (including those hospitals with fewer than 40 cases) or, alterna-tively, if we limited the sample to only hospitals with CABG surgery facilities in which transfers were minimized (mortality ranged from 4.36% [512/
11 731] for quartile 1 to 3.67% [463/ 12 616] for quartile 4;P= .008).
In a matched-pair propensity analy-sis, we successfully matched 37 654 pa-tients in quartile 4 to a similar number of patients in the remaining 3 adher-ence groups. After matching, there were no significant differences in baseline characteristics among the paired samples other than those differences for heart rate. Similar to the overall find-ings, mortality rates among the matched pairs was lowest among those patients
treated at the leading adherence quar-tile centers (4.17% [786/18 827]) and highest among those treated in the lag-ging quartile centers (5.47% [260/ 4750]). In an adjusted analyses, the OR associated with leading centers vs lag-ging centers was 0.67 (95% CI, 0.52-0.86).
COMMENT
Quality of care has been defined as “the degree to which health service for in-dividuals and populations increase the
Table 5.In-Hospital Outcomes
Population
No. of Events (%) by Hospital Adherence Quartile
P
Value 1 (Lowest) 2 3 4 (Highest)
Overall (N = 64 775) (n = 12 329) (n = 15 255) (n = 18 364) (n = 18 827)
Death 784 (6.36) 772 (5.06) 850 (4.63) 786 (4.17) ⬍.001 Death/MI* 1119 (9.08) 1280 (8.39) 1223 (6.66) 1201 (6.38) ⬍.001
Stroke 96 (0.78) 146 (0.96) 171 (0.93) 134 (0.71) .31
CHF 908 (7.36) 1747 (11.45) 1727 (9.40) 1541 (8.19) .24
NSTEMI (N = 57 260) (n = 9892) (n = 12 597) (n = 18 149) (n = 16 622)
Death 760 (7.68) 701 (5.56) 843 (4.64) 718 (4.32) ⬍.001
Death/MI* 1055 (10.67) 1128 (8.95) 1206 (6.64) 1105 (6.65) ⬍.001 Stroke 96 (0.80) 146 (0.98) 171 (0.94) 134 (0.72) .25
CHF 862 (8.71) 1368 (10.86) 1851 (10.20) 1424 (8.57) .13
Abbreviations: CHF, congestive heart failure; MI, myocardial infarction; NSTEMI, non–ST-segment elevation myocardial infarction.
*Indicates in-hospital death or recurrent MI.
Figure 2.Association Between Hospital Composite Guideline Adherence Rate and In-Hospital Mortality
8
1 4
3
2 5 6 7
0
Hospital Composite Guideline Adherence Quartiles
In-Hospital Mortality
, %
NSTE ACS
1 2 3 4
8
1 4
3
2 5 6 7
0
Hospital Composite Guideline Adherence Quartiles
In-Hospital Mortality
, %
NSTEMI
1 2 3 4
likelihood of desired health outcomes and are consistent with current profes-sional knowledge.”19This definition is based on the premise that consistent use of evidence-based care processes will lead to improved patient outcomes. Studying patients with NSTE ACS who were treated at 350 US hospitals, we found that up to 25% of opportunities to provide guideline-recommended care were missed in current practice. How-ever, this overall number belies the vari-ability in care among centers we found, both at the individual and composite-measure levels.
To our knowledge, our study is among the first to link this variability in hospital process performance with patient outcomes. After adjustment, ev-ery percentage increase in the guide-line adherence rate of hospitals was as-sociated with an equivalent decrease in the likelihood that patients treated at that center would die before dis-charge. These data therefore support the use of guideline-based process mea-sures as an important means of assess-ing an institution’s quality of care.
The era of accountability, defined as measured performance with conse-quences, is rapidly arriving for US medical practitioners and health care facilities. Soon, both reputations and in-comes of medical practitioners and health care facilities may well be al-tered depending on how one scores on a limited set of performance metrics. However, debate remains regarding how performance should ideally be as-sessed. Some advocate that patient out-comes should be the criterion stan-dard for assessing hospital quality. These metrics, however, are inher-ently unstable due to low clinical event rates and challenges in risk adjust-ment.20Alternatively, performance as-sessment based on a limited set of care processes may be challenged if these metrics are not proven to be associ-ated with overall patient outcomes. Our study results support the concept that composite guideline-based care met-rics are closely associated with better patient outcomes, thereby connecting these 2 quality goals.
Previous studies have reported simi-lar degrees of underuse of evidence-based care processes among patients hospitalized with ACS.2 1 - 2 4 More recently, investigators have reported poor association in hospital perfor-mance across several patient condi-tions.25Our study is consistent with these earlier findings. Even within a single disease condition, we found that a hospital’s performance on a given care process may not predict its results in another. For example, there was no association between the hospitals’ use of acute -blockers and their use of discharge clopidogrel. Thus, our study supports the concept that a broad range of process metrics may be needed to fully characterize hospital care practices.
We also found few hospital features that were significant predictors of bet-ter performance. In fact, in multivari-able analysis, only centers with CABG surgery facilities and those with a higher percentage of patients treated by a car-diologist were significantly associated with higher adherence rates relative to their peers. Thus, payers or the public who wish to identify best-performing hospitals accurately will need to mea-sure care processes directly rather than rely on structural features.
Our study extends former work in this field by demonstrating a strong, dose-dependent association between hospital adherence to care guidelines and their patient acute outcomes. Our findings of an association between higher use of evidence-based therapies and better outcomes lends further support to the work of other stud-ies.9,10,26,27Although the association was robust, its explanation is most likely multifactorial. First and fore-most, each of the individual guideline-based processes examined have a proven impact on patient outcomes within well-run randomized clinical trials.11Although a direct treatment benefit is certainly a contributing fac-tor to the observed association, it does not fully account for effect. For example, we noted that hospitals’ use of several discharge care processes
were also indicative of centers’ overall outcome results. Because the dis-charge metrics were assessed only among those patients surviving to hos-pital discharge, the observed associa-tion is likely explained by factors other than a direct therapeutic effect. This could include the benefits of ini-tiation of these therapies before charge, the correlation of these dis-charge processes with other acute measures, or other factors.
The association could also be con-founded by patient risk and other so-cioeconomic factors. Prior studies have demonstrated that those patients most sick and thus likely to benefit from in-tervention paradoxically tend to be less likely to receive treatment.28,29 Addi-tionally, a rich literature documents dis-parities in evidence-based treatments by age, race, and socioeconomic factors, which can in turn be associated with patient outcomes.30-32Indeed, our study found that elderly persons, minori-ties, and those patients with more co-morbid disease tended to be treated at centers with lower measured compos-ite adherence. Furthermore, patient transfer issues may further skew our findings because healthy patients are of-ten first transferred, leaving higher-risk patients at centers without ter-tiary care capacity. However, the overall association of composite quality in our study strongly persisted even after ad-justment for clinical and socioeco-nomic factors. Furthermore, our find-ings were robust even after we limited our analyses to tertiary revasculariza-tion centers in which transfer rates were low.
between guideline adherence and out-comes persisted when we limited our analysis to only centers with revascu-larization or, alternatively, adjusted our analyses for use of revascularization procedures.
Adherence to evidence-based care processes may be a more general sur-rogate marker of the hospital’s culture and overall quality of care. For ex-ample, Bradley et al35found that evi-dence-based care processes were pre-dicted by certain cultural features of a center, such as the degree of adminis-trative support, physician champions, feedback, and teamwork. Similarly, the study by Eagle et al27found that cen-ters that routinely use standardized care processes, such as patient care algo-rithms, admission order sets, and dis-charge checklists, tend to have higher adherence to guidelines. Performance on our set of guideline adherence met-ric processes may be indirectly reflec-tive of a center’s culture, business prac-tices, and clinical skills.
Additionally, our study suggests that another characteristic, namely innovation, may be in play. This hypothesis is suggested by the fact that adoption of newer guideline-recommended therapies, such as gly-coprotein IIb/IIIa inhibitors, clopido-grel, and lipid-lowering therapy, were all more closely associated with hospi-tal outcome than were many of the well-established treatments, such as -blockers or angiotensin-converting enzyme inhibitors. Although all of these care measures have proven effi-cacy in ACS care, our results showed considerably more variation in the use of newer therapies. Therefore, the speed and completeness of adoption of novel effective therapies may identify centers that have the latest evidence in practice and that systematically inte-grate these novel therapies into their standard care processes. Whether the association is a direct therapeutic one, an indirect reflection of the hospital system and culture, or a combination of these, however, is less important from a policy perspective, because its link to patient outcomes is key to
sup-porting the role of these process per-formance metrics as indicators of over-all hospital quality.
Our study has limitations. First, our study is observational and nonrandom-ized. The association between care processes and outcomes do not neces-sarily prove causality and may be con-founded by factors previously dis-cussed. Additionally, our conclusions are limited to the care of patients with NSTE ACS, although these patients do represent a substantial majority of all US patients with MI. It will be impor-tant to assess whether these findings can be translated across other disease states. We also were limited to the inpatient setting; evaluating the association of care practices in both inpatient and patient settings with longitudinal out-comes will also be an important next step. CRUSADE hospitals are self-selected for those institutions inter-ested in quality improvement and thus may not be representative of national care patterns. However, if so, the vari-ability in care observed in our study most likely underestimates that ex-pected in broader community care. Our study does not purport to have the ideal set of process-performance indicators. We selected those indicators defined as useful and effective by current na-tional care guidelines and included both newer and established care indicators. However, other indicator sets may be more or less closely associated with pa-tient outcomes. Finally, it remains un-clear whether this process-outcome link for a given set of performance metrics may vary over time. Future studies will need to determine the stability of the process-outcome relationship as qual-ity improvement efforts drive broader care adoption.
In conclusion, our study has sev-eral health policy implications. First, current NSTE ACS care is not perfect, with up to 25% of opportunities for guideline-based care being missed in contemporary community practice. Therefore, ongoing quality assess-ment and perhaps stronger incentive systems, such as public reporting and pay for quality, are needed if we are to
overcome this quality chasm. Second, significant variability in hospitals’ performance on individual care indi-cators was found. This argues that mul-tiple metrics will be needed to charac-terize hospital performance fully. Third, a strong association between hospi-tals’ composite care performance and patient outcomes was observed. Our work supports the central hypothesis of hospital quality improvement; namely, better adherence with evi-dence-based care practices will result in better outcomes for patients who are treated. Finally, we found the associa-tion between process and outcome was at least as strong for emerging therapies as is observed with well-established therapies. Therefore, our performance indicator sets will need to be kept current on an ongoing basis to accurately identify high-quality medical practitioners and health care facilities.
Author Contributions:Dr Peterson had full access to all of the data in the study and takes responsibility for the integrity of the data and the accuracy of the data analysis.
Study concept and design:Peterson, Lytle, Pollack, Newby, Gibler, Ohman.
Acquisition of data:Peterson, Pollack, Harrington, Ohman.
Analysis and interpretation of data:Peterson, Roe, Mulgund, DeLong, Brindis, Smith, Pollack, Newby, Harrington.
Drafting of the manuscript:Peterson, DeLong, Lytle. Critical revision of the manuscript for important in-tellectual content:Peterson, Roe, Mulgund, DeLong, Lytle, Brindis, Smith, Pollack, Newby, Harrington, Gibler, Ohman.
Statistical analysis:Peterson, Mulgund, DeLong. Obtained funding:Peterson, Roe, Harrington, Gibler, Ohman.
Administrative, technical, or material support:Peterson, Roe, Harrington, Ohman.
Study supervision:Peterson, Roe, Ohman. Financial Disclosures:Drs Peterson, Roe, Brindis, Smith, Pollack, Newby, Harrington, Gibler, and Ohman have reported receiving research support from Schering-Plough Corp, Bristol-Myers Squibb/ Sanofi-Aventis Pharmaceuticals Partnership, and Mil-lennium Pharmaceuticals. No other authors reported financial disclosures.
Funding/Support:This study was supported by CRUSADE, a National Quality Improvement Initia-tive of the Duke Clinical Research Institute, which was funded by the Schering-Plough Corporation. Bristol-Myers Squibb/Sanofi-Aventis Pharmaceuticals Part-nership and Millennium Pharmaceuticals provided ad-ditional funding support. Dr Peterson is also the recipient of grant R01 AG025312-01A1 from the Na-tional Institute on Aging.
REFERENCES
1.Centers for Medicare & Medicaid Services. Hos-pital Quality Alliance: Improving Care Through Information. Available at: http://www.cms.hhs.gov /quality/hospital/HQAFactSheet.pdf. Accessed No-vember 17, 2005.
2.Spertus JA, Eagle KA, Krumholz HM, et al. Ameri-can College of Cardiology and AmeriAmeri-can Heart Asso-ciation methodology for the selection and creation of performance measures for quantifying the quality of cardiovascular care.Circulation. 2005;111:1703-1712. 3.Braun BI, Koss RG, Loeb JM. Integrating perfor-mance measure data into the Joint Commission ac-creditation process.Eval Health Prof. 1999;22:283-297. 4.National Committee for Quality Assurance. NQF-Endorsed National Voluntary Consensus Standards for Physician-Focused Ambulatory Care. Available at: http: //www.ncqa.org/Main/NQF_Posting_Table.pdf. Ac-cessed November 17, 2005.
5.Leapfrog Group. Fact Sheet: Evidence-based Hos-pital Referral. April 7, 2004. Available at: http://www .leapfroggroup.org/media/file/Leapfrog-Evidence-based_Hospital_Referral_Fact_Sheet.pdf. Accessed November 10, 2005.
6.Centers for Medicare & Medicaid Services. Hos-p i t a l C o m Hos-p a r e . A v a i l a b l e a t : h t t Hos-p : / / w w w .hospitalcompare.hhs.gov. Accessed November 10, 2005.
7.Lee TH, Meyer GS, Brennan TA. A middle ground on public accountability.N Engl J Med. 2004;350:2409-2412.
8.Epstein AM, Lee TH, Hamell MB. Paying physi-cians for high quality care.N Engl J Med. 2004;350: 406-410.
9.Chen J, Radford M, Wang Y, Marciniak TA, Krum-holz HM. Do “America’s best hospitals” perform bet-ter for acute myocardial infarction?N Engl J Med. 1999; 340:286-292.
10.Granger CB, Steg PG, Peterson ED, et al; GRACE Investigators. Medication performance measures and mortality following acute coronary syndromes.Am J Med. 2005;118:858-865.
11.Braunwald E, Antman EM, Beasley JW, et al. ACC/ AHA 2002 guideline update for the management of patients with unstable angina and non-ST-segment elevation myocardial infarction: a report of the Ameri-can College of Cardiology/AmeriAmeri-can Heart Associa-tion task force on practice guidelines (Committee on the Management of Patients With Unstable Angina). J Am Coll Cardiol. 2002;40:1366-1374.
12.Roe MT, Parsons LS, Pollack CV Jr, et al; Na-tional Registry of Myocardial Infarction Investigators. Quality of care by classification of myocardial infarc-tion: treatment patterns for ST-segment elevation vs non-ST-segment elevation myocardial infarction.Arch Intern Med. 2005;165:1630-1636.
13.Hoekstra JW, Pollack CV Jr, Roe MT, et al. Im-proving the care of patients with non-ST-elevation acute coronary syndromes in the emergency depart-ment: the CRUSADE initiative.Acad Emerg Med. 2002; 9:1146-1155.
14.Bhatt DL, Roe MT, Peterson ED, et al. Utilization of early invasive management strategy for high-risk patients with non-ST-segment elevation acute coronary syndromes: results from the CRUSADE Quality Improvement Initiative.JAMA. 2004;292: 2096-2104.
15. Roe MT, Ohman EM, Pollack CV Jr, et al. Chang-ing the model for care for patients with acute coro-nary syndromes: implementing practice guidelines and altering physician behavior.Am Heart J. 2003;146: 605-612.
16.Staman KL, Roe MT, Fraulo ES, et al. Quality im-provement tools designed to improve adherence to the ACC/AHA guidelines for the care of patients with non-ST-segment acute coronary syndromes: the CRU-SADE Quality Improvement Initiative.Critical Path-ways Cardiol. 2003;2:34-40.
17.CRUSADE National Quality Improvement Website. Available at: http://www.CRUSADEQI.com. Ac-cessed November 16, 2005.
18.Davidian M, Gallant RA. The nonlinear mixed ef-fects model with a smooth random efef-fects density. Biometrika. 1993;80:475-488.
19.Lohr KN, Schroeder SA. A strategy for quality as-surance in Medicare.N Engl J Med. 1990;322:707-712. 20.Spertus JA, Radford MJ, Every NR, et al. Chal-lenges and opportunities in quantifying the quality of care for acute myocardial infarction.Circulation. 2003; 107:1681-1691.
21.Jencks SF, Huff ED, Cuerdon T. Changes in the quality of care delivered to Medicare beneficiaries, 1998-1999 to 2000-2001.JAMA. 2003;289:305-312. 22.Fox KAA, Goodman SG, Klein W, et al. Manage-ment of acute coronary syndromes: variation in practice and outcome.Eur Heart J. 2002;23: 1177-1189.
23.LaBresh KA, Ellrod AG, Gliklich R, Lijestrand J, Peto R. Get with the guidelines for cardiovascular second-ary prevention.Arch Intern Med. 2004;164:203-209. 24.Mehta RH, Montoye CK, Gallogly M, et al.
Im-proving the quality of care for acute myocardial in-farction: the Guidelines Applied in Practice (GAP) Initiative.JAMA. 2002;287:1269-1276.
25.Jha AK, Li Z, Orav EJ, Epstein AM. Care in U.S. hospitals: the Hospital Quality Alliance program.N Engl J Med. 2005;353:265-274.
26.Higashi T, Shekelle PG, Adams JL, et al. Quality of care is associated with survival in vulnerable older patients.Ann Intern Med. 2005;143:274-281. 27. Eagle KA, Moyntoye CK, Riba AL. Guidelines-based standardized care is associated with substan-tially lower mortality in Medicare patients with acute myocardial infarction.J Am Coll Cardiol. 2005;46: 1242-1248.
28. Ko DT, Mamdani M, Alter DA. Lipid-lowering therapy with statins in high-risk elderly patients: the treatment-risk paradox.JAMA. 2004;291:1864-1870.
29.Roe MT, Peterson ED, Newby LK, et al. The in-fluence of risk status on guidelines adherence for pa-tients with non-ST-segment elevation acute coro-nary syndromes.Am Heart J. In press.
30.Alexander KP, Roe MT, Chen AY, et al. Evolu-tion in cardiovascular care for elderly patients with non– ST-segment elevation acute coronary syndromes: re-sults from CRUSADE.J Am Coll Cardiol. 2005;46: 1479-1487.
31.Sonel AF, Good CB, Mulgund J, et al; CRUSADE Investigators. Racial variations in treatment and out-comes of black and white patients with high risk non-ST-elevation acute coronary syndromes: insights from CRUSADE.Circulation. 2005;111:1225-1232. 32.Rao SV, Kaul P, Newby LK, et al. Poverty, pro-cess of care, and outcome in acute coronary syndromes. J Am Coll Cardiol. 2003;41:1948-1954.
33.Cannon CP, Weintraub WS, Demopoulos LA, et al. Comparison of early invasive and conservative strat-egies in patients with unstable coronary syndromes treated with glycoprotein IIb/IIIa inhibitor tirofiban. N Engl J Med. 2001;344:1879-1887.
34.Wallentin L, Lagerqvist B, Husted S, et al; FRISC II Investigators. Outcome after 1 year after an inva-sive compared with a non-invainva-sive strategy in un-stable coronary-artery disease: the Fast Revasculari-sation During Instability in Coronary Artery Disease (FRISC) II invasive randomized trial.Lancet. 2000;356: 9-16.