degree. April, 2012. 57 pages. Advisor: Joanne Gard Marshall.
Since data curation is a new area of practice for LIS professionals, little is known about the existing workforce in this area. Using secondary analysis of the Workforce Issues in Library and Information Science data, the study examined the work, career stories and post-graduate experiences of LIS alumni who indicated that their work involved data work. LIS professionals performing data duties appeared in a variety of organizations and workplace settings. These professionals were also more likely to be managers, have a higher number of job functions and identify as both a librarian and information professional than other respondents. Five career pathways into data curation were identified.
Headings:
Surveys
Library science – Vocational guidance Information scientists – Employment Librarians – Employment
ANSWERING THE CALL FOR DATA CURATION: AN EXPLORATION OF THE CAREERS OF LIS PROFESSIONALS MANAGING DATA
by
Cheryl A. Thompson
A Master’s paper submitted to the faculty of the School of Information and Library Science of the University of North Carolina at Chapel Hill
in partial fulfillment of the requirements for the degree of Master of Science in
Information Science.
Chapel Hill, North Carolina April 2012
Approved by
Acknowledgements
Along the journey in life, individuals are placed in your path to help you grow or get to the next stage. I have been fortunate to receive tremendous support from a number of individuals past and present that have helped me get to this place. First and foremost, I cannot thank my parents enough for their continuing encouragement, support and love over the years. My father taught me the importance of dreams and exploring my passions, despite how odd they are.
I was fortunate to have taken an undergraduate class and to be employed by Jennifer Craft Morgan. I would like to thank Jennifer for the many conversations about what I wanted to be when I grew up even though it kept changing. More than just a mentor, I have learned so much about conducting research and how to stay calm despite the storms.
While employed at the UNC Institute on Aging, I was introduced to Joanne Gard Marshall. Joanne has been an amazing boss and mentor and helped me find my way along the path of life. I cannot thank her enough for introducing me to the Library and Information Science field, nourishing my professional development and teaching me many things about yoga and the body.
Morgan, Co-Principal Investigator; Deborah Barreau, Co-Investigator; Barbara Moran, Co-Investigator; Paul Solomon, Co-Investigator; and Susan Rathbun-Grubb, Graduate Research Assistant. Participating in the team meetings has taught me a lot about workforce issues, research design and collaborative projects as well as provided inspiration for my graduate research interests.
Contents
Acknowledgements ... 1
Contents ... 3
1. Introduction ... 5
1.1 Background ... 6
1.2 Purpose of the Analysis ... 13
1.3 Research Questions ... 14
2. Methodology ... 15
2.1 Research Design... 15
2.2 Data Source ... 16
2.3 Data subset ... 17
2.4 Data Analysis ... 19
3. Analysis Results ... 20
3.1 Demographics ... 20
3.2 Career Typologies ... 21
3.3 Job Details ... 26
3.3.1 Job Titles ... 26
3.3.2 Work Setting ... 27
3.3.3 Job Content ... 28
4. Discussion ... 31
4.1 Summary of Findings ... 31
4.2 Limitations and Future Research ... 32
4.3 Conclusions ... 33
List of Figures and Tables
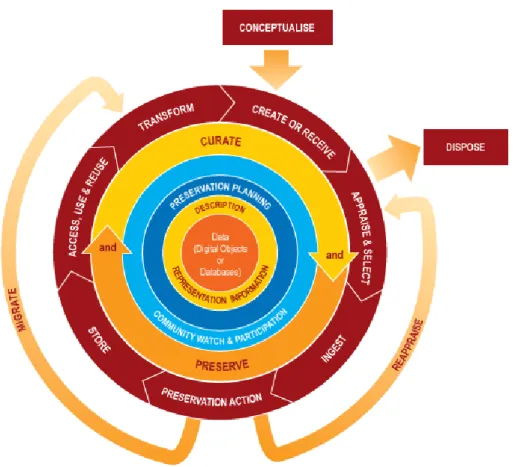
Figure 1. Digital Curation Centre Lifecycle Model ... 42
Table 1. T-test for age at time of survey by data curation status ... 43
Table 2. T-test for age at graduation by data curation status ... 43
Table 3. Crosstabulation of gender by data curation status ... 44
Table 4. Crosstabulation of relationship status by data curation status ... 44
Table 5. Crosstabulation of race and ethnicity by data curation status ... 45
Table 6. Frequency of terms in “data curator” job titles in current or previous job by decade (n=438)... 45
Table 7. Percent of data curators by job type (n=555) ... 46
Table 8. Percent of data curators by job type (n=441) ... 46
Table 9. Crosstabulation of library type by data curation status ... 47
Table 10. Crosstabulation of employer size by data curation status ... 47
Table 11. Crosstabulation of library or department size by data curation status ... 48
Table 12. Crosstabulation of LIS field by data curation status ... 48
Table 13. Crosstabulation of whether performing at least one data function by decade job was started ... 49
Table 14. Crosstabulation of whether performing data management by decade job was started .. 49
Table 15. Crosstabulation of whether performing database administration by decade job was started ... 50
Table 16. Crosstabulation of whether performing database development by decade job was started ... 50
Table 17. Crosstabulation of whether performing data analysis by decade job was started ... 51
Table 18. Percent performing administrative functions by data curator status ... 51
Table 19. Percent performing access and collections functions by data curator status ... 52
Table 20. Percent performing information services, education and research functions by data curator status ... 52
Table 21. Percent performing digital information technology and web access functions by data curator status ... 53
Table 22. Percent performing information technology and consulting functions by data curator status ... 53
Table 23. Percent working in a supervisory role by data curator status ... 54
Table 24. Percent working as managers within a library setting by data curator status ... 54
Table 25. Percent working as managers within a non-library setting by data curator status ... 55
1. Introduction
“Far and away the best prize that life has to offer is the chance to work hard at work worth doing.”
Theodore Roosevelt
The Square Deal Labor Day speech (September 7, 1903)
Technological advancements have contributed to the data deluge by making the creation and storage of large amounts of digital data possible. What happens to the data once the initial use has ended? Organizations that produce their own information are struggling with how to curate these data and comply with standards and regulations. The United States faces a shortage of data professionals, with an estimated 50% to 60% gap between supply and demand (McKinsky Global Institute, 2011). LIS professionals play a variety of roles in relation to data curation, including collecting, processing or archiving. Since data curation is a new area of practice for LIS professionals, little is known about the existing workforce in this area. Examining the career and work experiences of LIS professionals already working with data may help us to understand what types of
knowledge and skills required and what type of job opportunities are available in this new field.
and data analysis. The study employed secondary analysis of survey data. This paper discusses the study background, methodology, results and implications.
1.1 Background
Data curation is an emerging area and has not been well defined or treated the same in the literature. The American Council of Learned Societies (ACLS) describes data curation in the humanities and social sciences as the management, preservation and access to digital cultural heritage resources (ACLS, 2006). The ACLS definition is more of an extension of the traditional manuscript management process. The Data Conservancy defines data curation as “a means to collect, organize, validate and preserve data”
(Choudury, 2010, p. 195). This definition is more geared toward scientific research but it incorporates the earlier stage of data production that the ACLS definition is missing. This paper will combine these two definitions and define data curation as the production, management, validation, preservation and ensuring access.
Data curation is not a problem unique to academic or research environments. Organizations that produce their own information have data management and preservation needs. For instance, public school system in the United States are often required by state regulations to conduct end of year testing; the test scores and
documentation (e.g., location, date and time, proctor name, student name) must be stored and preserved. While many organizations have data curation needs, the digital materials and curation challenges may differ by industry or institution (Heidorn, 2011).
creation of new data sets. The Digital Curation Centre’s (2011) model of the data curation reveals the complex nature of the lifecycle. The model displays data in the middle enclosed in four layers of activities that happen throughout the data lifecycle as well as an outer layer of sequential actions. See Figure 1. According to Rusbridge (2007), the quality of data curation impacts data reuse and ultimately societal advancements:
“Managing data of this kind requires discipline if the results are to be
scientifically useful…Managing your data properly simply means keeping the necessary context information and associated documentation to make sure you and others can make use of your data when the need comes” (p. 2-3).
The ACLS (2006) and NSF (2003) reports argue the importance of a trained workforce for data curation success and recommend the development of specialized training programs that combine subject expertise and LIS skills.
Historically, libraries, archives and cultural institutions have organized and managed large collections of materials including both physical and digital formats. LIS professionals can play a vital role in data curation (Hwse & Holt, 2011; Prom, 2011; Association of Research Libraries, 2009; Higgins, 2011; Waters, 2007). Bowker and Star (2009) envision the information professional as an intermediary between the data
producers and computer scientists focusing on “how to make tools that a broad swath of disciplines can use, that push well beyond the single-user or even single-community solutions” (p. 7). Understanding the work experiences of LIS graduates working with data is vital to recruit and educate future LIS professionals for data curation.
(IMLS) and National Endowment for the Humanities have provided substantial support in the development of data curation curriculum.
The most extensive work in data curation education design has been done by the IMLS-funded DigCCurr projects at the School of Information and Library Science, University of North Carolina at Chapel Hill. The DigCCurr projects aim to design graduate curriculum for digital curation (DigCCurr, 2011). For the DigCCurr I project, evidence for Master’s-level curricular development included information from a digital preservation workshop; review of the literature; and content analysis of course syllabi, job advertisements, interviews and two questionnaires (Hank, Tibbo & Lee, 2010). Six dimensions were identified for inclusion in the curriculum: 1) mandates, values and principles; 2) functions and skills; 3) professional, disciplinary, institutional or cultural contexts; 4) types of resources; 5) prerequisite knowledge; 6) transition point in
information continuum (Lee, 2009). Specifically, the curriculum provides 24 skills and knowledge to support these functions (Lee, 2009).
The University of Illinois at Urbana-Champaign has developed two educational programs for data curation professionals: 1) master’s degree for biological information specialist (BIS) and 2) concentration in data curation (DC). These degrees aim to prepare professionals for data collection and management by blending theory and practice into the curriculum (Palmer, Heidorn, Wright & Cragin, 2007). The degree curricula were informed by previous research projects in digital library and information technology in biology at the university. The curricula were designed to provide alumni with knowledge and skills in “knowledge representation and organization, classification, data modeling, and ontology development…develop knowledge of the spectrum of biomedical
ontologies to facilitate integration of data collections (databases) and resolve term and definitional conflicts” (Palmer et al., 2007, p. 36). Alumni will be trained in the data curation lifecycle from creation to re-use and will be able to take responsibility in areas of data assimilation, management, sharing, description, interoperability, standards and policy development.
In response to employers’ needs, the School of Information at the University of Michigan has also developed a digital curation curriculum (Yakel, Conway, Hedstrom & Wallace, 2011). To train students to be digital stewardship, the Preservation of
While education development at the university level focus on student preparation, training programs have been designed specifically for working LIS professions seeking new opportunities. For instance, the Bibliotheque nationale de France (BNF) designed and conducted trainings for library staff as part of the dispersion of digital curation activities throughout the institution (Bermes & Fauduet, 2011). The four training topics were: 1) introduction to digital information, 2) data models for digital information, 3) project management and 4) from digitization to long-term preservation. While the trainings were designed for librarians already familiar with traditional LIS skills and knowledge, the trainings highlight subject areas that are unique to digital curation (e.g., format, models and standards) and that change in the digital world (e.g., management, workflow, rights). More attention to the assessment of these training programs and to understanding how well prepared graduates are for the field is warranted.
Recently, several large-scale research studies have investigated the LIS workforce to understand the recruitment, retention and retirement trends (8Rs Research Team, 2005; Griffiths, 2009; Steffen, Lance, Russell & Lietzau, 2004; Marshall et al, 2005; Walch, 2006). The impetus for these studies was the need to develop strategies to understand the current status of the LIS workforce, the careers of LIS professionals and the impact of demographic change on the workforce.
The 8R’s Research Team (2005) examined the library workforce issues in Canada using surveys, interview and secondary data analysis. The 8R’s study focused on
recruitment, retention, remuneration, repatriation, rejuvenation, reaccreditation, retirement and restructuring. The survey of library administrators, librarians and
retirement plans and motivations for entering LIS. Sivak and De Long (2009) reported that the library workforce in Canada is older than the overall Canadian workforce. Majority of LIS workers were satisfied with their jobs. Majority of LIS administrators agreed that the LIS programs were providing graduates with essential skills and
knowledge. Given the research design, this study did not capture the experiences of LIS graduates working outside of libraries and professionals that have left the LIS field.
The IMLS National Workforce Study (US) aimed to understand the LIS workforce shortages, potential jobs that will be available and the skills necessary for future LIS workers (Griffiths, 2009). The study administered several surveys with LIS employers, administration and workers. A survey of LIS programs and career counselors also was conducted. The results of this study were not available.
The Society of American Archivists conducted the A*CENSUS study examining the archival profession (Walch, 2006). A survey was administered to members of archival associations and staff members of national, state and other archives. The results indicated that majority of archivists planned to remain in the profession, entered the profession as a second career and need continuing education (Walch, 2006). Archives are potential employers for both LIS professionals, and further investigation into data archives is needed.
The Workforce Issues in Library and Information Science study was a large scale retrospective career study of graduates of LIS programs (Marshall et al., 2009). The project examined the careers and work lives of LIS alumni. The study used the graduate as the unit of analysis rather than the LIS worker or employer thus including the graduate who had left the LIS field. An initial survey of graduates of LIS programs in North Carolina was conducted. WILIS 1 found that the majority of graduates were working in the traditional library settings; however, those working in non-library settings were still using their LIS skills (Marshall et al., 2009). While these results suggest that LIS skills were useful to a variety of employment settings, the WILIS study provides an opportunity for further analysis of the graduates who are working with data.
information technology (IT) research has found three career prototypes – technical, managerial and protean (Igbaria, Greenhouse & Parasuraman, 1991; Reich & Kaarst-Brown, 1999; Joseph, Ang & Slaughter, 2005). While technical careers involve a series of more technical jobs, managerial careers move from a technical work into managerial work. A protean career path involves moving in and out of the IT profession. Research has not explored the career paths of data librarians or curators. A better understanding of the data curation career paths is critical for recruiting and training quality workers.
In addition to the previously mentioned workforce studies, there are numerous published reports related to the work lives of librarians and archivists (Albanese, 2008; Berry, 2007; Landry, 2000; Kim, Chiu, Sin, & Robbins, 2007; Solomon & Rathbun-Grubb, 2009; Rathbun-Grubb & Marshall, 2009; Moran, Marshall & Rathbun-Rathbun-Grubb, 2010; Steffen, Lance, Russell & Lietzau, 2004; Steffen & Lietzau, 2009; Williamson, Pemberton & Lousbury, 2005; Weech & Konieczny, 2007). These reports have not focused specifically on LIS professionals performing data work.
1.2 Purpose of the Analysis
professionals to keep retooling their skill sets and updating their knowledge (Lee, 2009; Kim et al., 2011). More attention to the career narratives and work experiences of professionals working with data is warranted. This paper aims to fill this research void. 1.3 Research Questions
The study focused on the following questions:
1. What themes emerge in the career paths of LIS alumni working in data curation? How have job content and titles changed over time?
2. Methodology
2.1 Research Design
In order to understand the careers of LIS graduates who work in the area of data curation, this project proposed secondary analysis of the alumni survey data from the Workforce Issues in Library and Information Science (WILIS 1) study (Marshall, Marshall, Morgan, et al., 2005). The WILIS 1 study investigated the career patterns of graduates of the five LIS Master’s programs in North Carolina between 1964 and 2007 (Morgan, Marshall, Marshall, & Thompson, 2009; J. Marshall et al., 2009). Using the life course perspective, the survey was designed to capture the life course from education through retirement and the multiple factors that can influence career trajectories
(Marshall, Rathbun-Grubb, & Marshall, 2009; Morgan et al., 2009). This perspective has been used in the LIS research to understand why librarians are leaving the profession (Rathbun-Grubb, 2009); what motivates scientist to enter science librarianship (Walker, 2010); the careers of public, academic and school librarians (Rathbun-Grubb & Marshall, 2009; Moran, Marshall & Rathbun-Grubb, 2010; Solomon & Rathbun-Grubb, 2009); and how economic recessions affect librarianship (Morgan & Morgan, 2009).
Marshall, Heinz, Krueger &Verma, 2001). The life course perspective is a useful tool for understanding work and careers by bringing:
into focus the background and context of career decisions and outcomes in a person’s life--their timing, the individual’s location in history and society, the influence of close relationships, and the significance and meaning that individuals assign to them as they make sense of their working lives (Marshall, Rathbun-Grubb, & Marshall, 2009, p. 129).
By using the life course perspective, this study recognizes the importance of economic, family or life circumstances in understanding careers.
2.2 Data Source
The WILIS survey data contains over 1700 variables and offers an in-depth look at the careers of LIS graduates (Leaf, 2011). The web-based survey collected data on the educational history, career path, jobs held, employment breaks, job and career
satisfaction, continuing education needs, professional identity and perspectives of recent graduates about their LIS programs. Respondents included up to five specific jobs: job immediately before their LIS program, job immediately after their LIS program, current job or last job depending on employment status, longest held job and highest-achieving job. The individual job sections collected data on the nature of the work, job title, industry, salary and benefits, level of employment, autonomy and reasons for leaving. The current job and last job sections also encompassed job functions, work environment, career development and retirement plans. In the WILIS survey, the researchers aimed to use standardized questions and many of the questions were culled from instruments used in national and large-scale workforce studies.
email. The response rate for the full WILIS 1 survey was 35.4 percent (n=2,682). A non-response study was conducted to determine whether there was a non-response bias and barriers to completing the survey in the pilot test. The non-response study indicated that there was potentially an over-representation of men but no other selection bias was detected in the pilot data. Given the similarity of the methodology in the pilot and full study, a non-response was not conducted for the full launch because “there is also no reason to expect that the sample is not representative of the population of LIS graduates from the five masters’ programs in NC” (Morgan, Marshall, Marshall & Thompson, 2009, p. 161). Furthermore, J. Marshall et al. (2009) described North Carolina as an ideal study site:
In many ways, NC can be seen as a microcosm of LIS education and practice nationally…In addition to having programs with varying forms of accreditation, the NC programs differ in their size; orientation towards international, national and local markets; availability of online courses; and research intensity (p. 143-144).
2.3 Data subset
were coded in a binary variable whether they performed at least one data function (n=555) or whether they performed no data functions (n=1589).
For the career path analysis, the author was interested in looking at the careers of data curation professionals. Job titles were collected in a series of questions and the textual responses were stored in several variables in the WILIS data set. The author reviewed the job titles for all five job sections for each respondent. Job titles were hand-coded as performing or not performing data curation. Similar to Cragin et al (2009) and Lee (2008), inclusion criteria for jobs in data curation were that it must contain terms such as data, database, research, science, curation, analyst and survey in the job title or in other textual responses within the job section. Ambiguous cases were resolved in favor of data curation status (e.g. demographic information specialist was coded as data curation since the individual is likely working with demography data in the position.) Cases were included in analysis if they held more than one data curation position (n=22).
2.4 Data Analysis
This secondary analysis included items throughout the survey with the heaviest focus on the areas listed below. Responses of those graduates who indicated in the survey that they worked with data are compared with those who did not so indicate. For the sake of convenience, those respondents who indicated in the WILIS survey that they worked with data will heretofore be referred to “data curators.”
• Career overview • Educational history
• Employment history including jobs and breaks
• Current and previous job details (depending on employment status)
Qualitative responses related to the above factors were examined for data curators only, both to triangulate findings from statistical comparison and also to discover the career path typologies. Textual responses were hand coded by the author.
3. Analysis Results
The findings have been grouped by conceptual categories: demographics, career typologies and job detail comparison.
3.1 Demographics of data curators
In order to facilitate understanding of this study results, it is important to explore who are data curators. A quarter of the WILIS survey respondents (25.9%) indicated that they performed a data duty (referred hereafter as data curator). Of “data curators”
(n=555), there was variation in the data functions performed: data management (72%), database administration (54%), database development (41%) and data analysis (32%). The average number of data duties performed by data curators was 2.0 with a range of 1 to 4 (std dev=1.1).
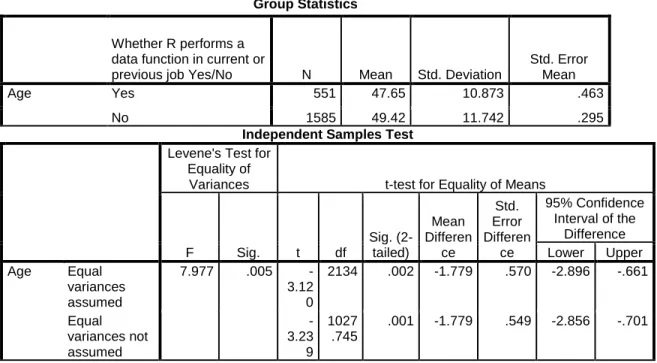
LIS students are often late entrants and coming from other careers (Wilder 2000; Walch, 2006). At the time of graduation, the average age of data curators was 33.4 years with a range from 21 to 64 (std dev=8.5). The graduation age of their peers was
statistically younger (p=0.04) with a mean age of 32.5 years ranging from 20 to 62 (std dev = 8.6). See Table 2.
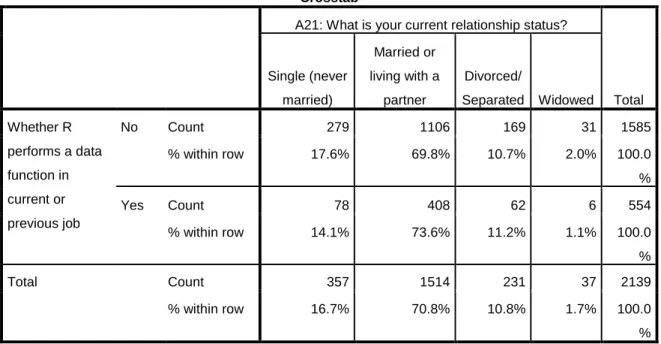
Predominantly the LIS workforce is female, married and Caucasian (Marshall et al., 2009). Data curators (80%) and their peers (82%) reflect this gender trend in the study data too. See Table 3. In terms of relationship status, my sample was predominantly married or living with a partner (74% of data curators, 70% of others). See Table 4. Looking at ethnicity, data curators and others were predominantly Caucasian (88%). See Table 5. The study data reflects the same patterns in previous research.
The length of time in their current or previous position was the final demographic measure explored. The means of job duration were similar for data curators (mean=6.7, std dev=6.4) and others (mean=6.3, std dev=6.2).
3.2 Career Typologies
This section describes the career typologies identified in the 22 data curation professionals that have held multiple data curation positions. Each typology is described and illustrated using an exemplar case. To protect respondents, names and position titles were replaced with pseudonyms.
LIS professionals moving into data career
years. After graduating with a MLIS degree, these alumni started working in more traditional librarian roles. These alumni had one or two traditional positions and then move into a data curation position. After this initial data position, the remainder of their career includes data-related positions. There were six cases that matched this career typology.
Exemplar case 1
Sally Thomas is 39 years old and identifies as both a librarian and information
professional. She is married with no children. She obtained a Bachelor’s degree in Women’s Studies. Her post-baccalaureate work includes administrative assistant work
until she figured out what type of career she wanted. She decided on a LIS career
because she “wanted a fulfilling career in which I could help others” (Case 304622). She completed her MLIS and was employed as an academic Reference Librarian using her
LIS skills and knowledge. After one year, she left the academic position to find better opportunities for career growth and more challenging or interesting work. She moved
into a Demographic Information Librarian position in a government library and
remained here for 5 years, her longest position. This position represents the point where she started managing data. Next, she started working as a Librarian for Data Services in
an academic library, her current employer. She is satisfied with her current job in data curation and chances are very slight that she will leave this position.
Data managerial career
hold a few technical positions before moving into management. The remainder of the career includes middle and/or top-level management positions. Five cases were coded as the data managerial typology.
Exemplar case 2
Pearl Parker is 70 years old and retired from a career in special library management. She identifies as an information professional not a librarian. Pearl is married and has two kids. Her career started when she obtained a Bachelor of Arts in
English. After earning her Bachelor’s, she worked as a music teacher for several years. She left this job to pursue a Master’s degree in Library and Information Science (MLIS).
She wanted an LIS career because it seemed like a good fit for her interests and it fit well with her family responsibilities. Pearl obtained a MLIS degree and began her career as an academic librarian. After a year as a Business librarian, she left the position to find
better career opportunities, a chance to use her LIS skills and more interesting projects. Her next position was a librarian for a local journalism company. In this position she
was exposed to journalism research and got the bit by the research bug. At this company, she was able to move up to Director of Research, a position that she held for over a decade. Her next job was as Director of Research for a major, national news
corporation. She has retired from this position and does consulting work for news research.
Scientists turned data professionals career
These cases reported seeking an LIS career because they “wanted to stay in my field but do something different. Science without the lab work” (Case 742480). After obtaining an MLIS degree, their career paths take a turn into data curation where they can use their science and LIS skill sets. The remaining career includes multiple positions as a data professional.
Exemplar case 3
Jim Sawyer is a 57-year-old working father. He has had two careers in his life.
His first career was as a natural scientist. He obtained a bachelor, masters and doctorate degrees in Botany. He worked for four years as an Associate Scientist and felt that his
personality did not fit the job. He decided to pursue an LIS career because LIS has flexible education and career options for adults. He has one child that he shares equally the parenting responsibilities. He obtained an MLIS and wanted to work in a research
setting after graduation. His first job after graduating was as a Data Manager. Jim worked as a data manager for a year but was not happy with his work environment. He
left this position for a Senior Analyst position in a social research firm. He has worked in this analyst position for over 20 years and still worked there at the time of survey
completion. Professionally, he identifies as an information professional and is satisfied
with his LIS career.
LIS professionals to scientists career
Exemplar case 4
Jane Smith is a 43-year-old working mother. She started with a Bachelor's degree
in Chemistry. She did not pursue a career in chemistry and instead started her own in-home daycare service. After a few years in the daycare industry, she wanted to pursue a
career in LIS because it seemed like a good fit for her interests and the flexible career and education options were appealing. She also wanted to be “a good role model for my daughters” (Case 351182). She obtained a MLIS degree and worked in the LIS field for 5
years. During this period, she worked as a database programmer and learning technologist. Her work with educational technology inspired her to pursue a PhD in
education. After obtaining her PhD, she has worked as a Research Scientist for a private research firm for the past six years. The research scientist position is her current and longest employment. Although she did not like being an information professional, she
would encourage others to choose LIS as a career.
Data paraprofessionals turned LIS professionals career
The final career typology was the data paraprofessional turned LIS professional; two cases matched this career pattern. These cases had an undergraduate degree in the sciences and worked as a data paraprofessional post-baccalaureate. Both cases reported pursuing a career in LIS because of family obligations. Their first job after the LIS program was a data curation position and then the remaining career involves LIS positions in library and IT employers. The initial data paraprofessional position seemed to be a launching pad into the LIS field.
Paul Clarke is 30-year-old IT professional. Reflecting over his career, he
intended to be an anthropologist and pursued an LIS career to be able to provide for his
family. As a foray into LIS, he worked as a Data technician for two years before applying to a MLIS degree program. He was able to continue working as a Data Technician as he
pursued his MLIS degree. After graduation, he was employed as a Database Engineer for 2 years. He left the database position to find more challenging work and the opportunity to work with leading edge technology. Next he was hired by a large, international IT
corporation where he has held four positions moving up in the organization to his current position of Product Manager. He identified as an information professional.
While these five career typologies appeared in the data, it is important to discuss the oddities. There was one alumnus that did match the career patterns of the others. She was a natural scientist who pursued an LIS degree to advance her knowledge and skills in the area of data management. The MLIS degree was a means of personal development that would enhance her skill set. While she was using the LIS skills in her scientist position, she did not change her employer or type of work. Ultimately, the LIS degree allowed her to be a data advocate in her research firm.
3.3 Job Details
This section looks at only the current and previous job sections in the WILIS data. To understand the work lives of LIS alumni, it was necessary to compare the experiences of those working with data versus their peers.
3.3.1 Job Titles
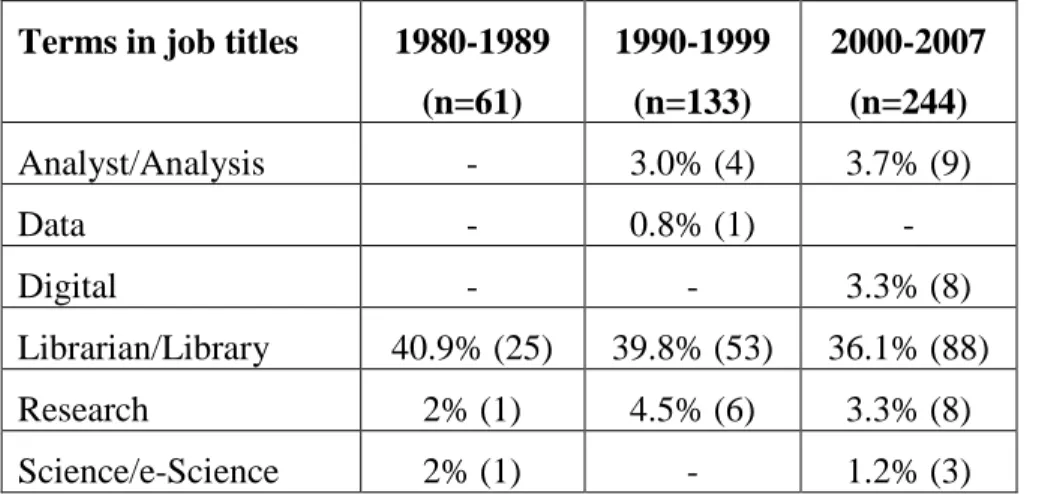
job titles of LIS professionals have started to reflect the societal shifts. Looking at the job titles of those who performing data curation activities over time, the majority of current or previous job titles include the traditional terms, library or librarian. However, position titles with the words, research or analyst, start to appear in the 1990’s and continue into the 2000’s. Finally, the terms, digital and e-science, start to appear in the 2000’s. See Table 6. The evolution of LIS job titles is reflective of the evolution of information formats and contexts.
3.3.2 Work Setting
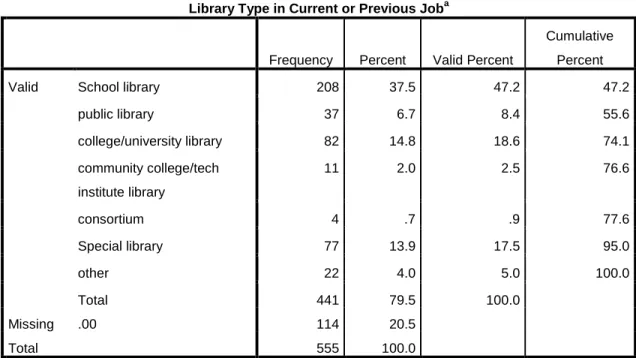
Research in the work lives of data curators is limited. The WILIS survey included several measures on work setting and organization and department size. Data curators predominantly were using their LIS skills in a non-library (21%) or a library setting (79%). See Table 7. Of the data curators working in a library (n=441), the most frequently reported library types were the traditional types: school (47%), academic (19%), special (18%) and public library (8%). See Table 8. While it was surprising that school libraries top the list, school librarians are often solo-librarians performing all the duties in their environments. Furthermore, the variety of settings employing data curators reflects the variety of data (e.g., financial, genealogy, program evaluation) in the library field. The author was unable to explore the types of data that these data curators were managing in the WILIS 1 data.
school libraries (47%) than their peers (25%), the non-data curators dominated the public and academic library settings. See Table 9.
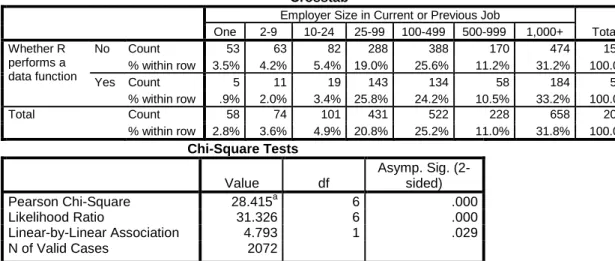
The WILIS survey collected data on organizational size using the number of employees as a measure. There are statistically significant differences in the employer size of data curators and others (p=0.000). Overall, LIS graduates are working in organizations that vary in employee size. Slightly more data curators are working in medium-sized categories (50%) and larger categories (44%) than the others, respectively 45% and 42%. Looking closer at the department or unit, non-data curators dominate most of the size categories except the very small departments (2-9 employees) that contained 48% of data curators and 35% of non-data curators. See tables 10-11. Although medium to large employers were hiring LIS professionals to curate data, the employing
department or unit were often very small.
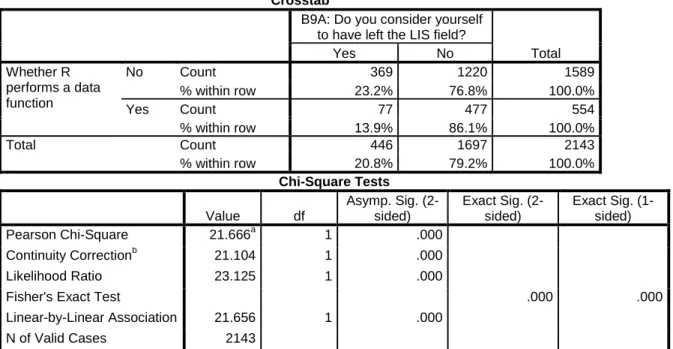
LIS stakeholders are concerned about the number of LIS professionals leaving the LIS field. The WILIS survey collected data on whether the respondents considered themselves to have left the LIS field. In comparing data curators with their peers, significant differences existed. Data curators (86%) were more likely to consider themselves outside of the LIS field than others (77%). See Table 12.
3.3.3 Job Content
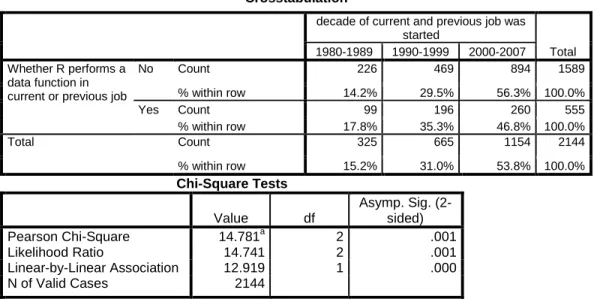
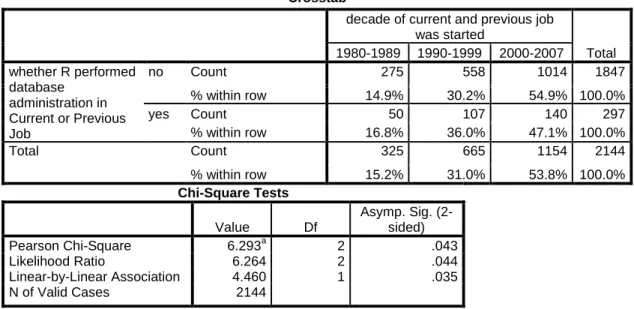
professionals starting their jobs in the 1990’s were performing data management
(p=0.000) and database administration (p=0.04). There were no significant differences for database development and data analysis duties over time. See Tables 14-17.
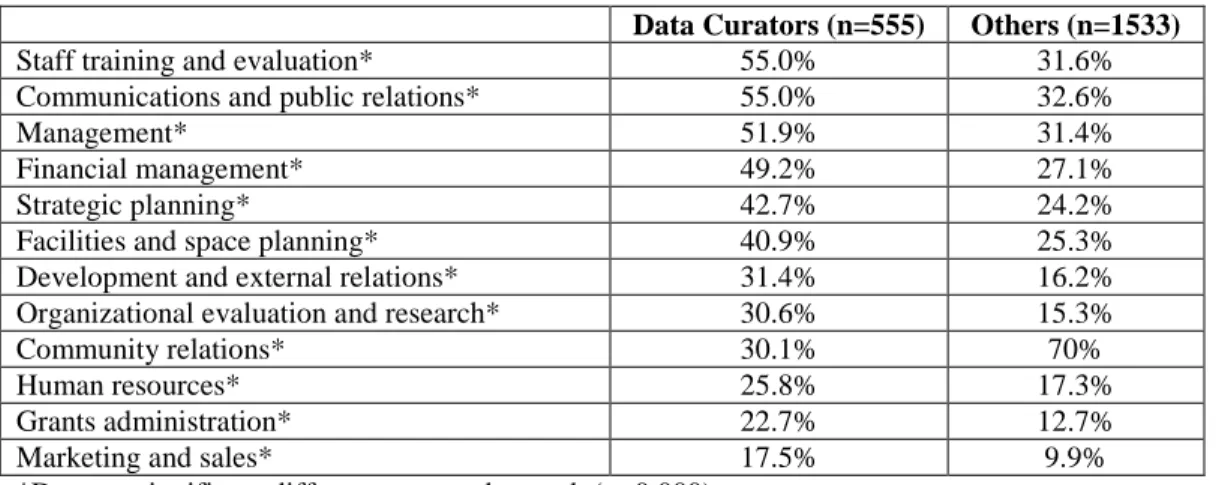
Positions usually include multiple functions and responsibilities. Data curators reported a higher number of job duties (mean=19.9, std dev = 8.9, min=1, max=36) than non-data curators (mean=11.8, std dev=7.3, min=1, max=36). Looking at the other duties of data curators, the most frequently reported functions were reference (67%), collection development (66%), electronic resources (63%) and user training and support (63%). Data curators were less likely to perform rare books (7.7%), knowledge management (4.7%) and information engineering (6.1%). See Tables 18-22. While the data curators performed many roles within their organizations, the work of data curators involved a blend of data, information and people-oriented duties.
Management and supervisory roles were solicited in the WILIS survey. Data curators were more likely to have supervisory responsibilities (69%) compared to other alumni (58%). See Table 23. Looking at their level within the organization, the
4. Discussion
4.1 Summary of Findings
The study findings are organized by research questions.
What themes emerge in the career paths of LIS alumni working in data curation? How have job content and titles changed over time?
The field of data curation offers a variety of career paths for LIS graduates. Five career typologies were identified: LIS professionals moving work with data; data managerial; scientists turned data professionals; LIS professionals turned scientists; and data paraprofessionals turned LIS professionals. Data curators entered the field in multiple ways such as: after obtaining an undergraduate degree in the sciences; after obtaining a LIS degree; and even after a career in librarianship. A career in data curation was a launching pad for some graduates into managerial or scientist positions. The field of data curation offers graduates a career path with vertical and lateral movements rather than a traditional career ladder of only vertical movements.
reference librarian. More research into the data types that LIS professionals manage is warranted.
What are the similarities and the differences in work for individuals work with data versus those who do not?
The study results highlight several differences between data curators and other LIS alumni. In terms of work setting, there were substantial differences between data curators and others. Data curators were more likely to work in school libraries and less likely to work in public and academic settings than their peers. In addition, medium and large organizations were more likely to employ data curators than other LIS graduates; however, the hiring departments or units of data curators were more likely to be very small compared to non-data curators. A final difference was that data curators were more likely to indicate that they left the LIS field and that they identify as both of librarian and information professional than others.
Data curators performed a higher number of duties in their positions than non-data curators. In addition to data duties, data curators were more likely to perform traditional library duties such as reference, collection development and user training/support. Data curators also were more likely to perform managerial duties than others. The job content of data curators contained a diverse collection of data, information and supervisory duties.
4.2 Limitations and Future Research
due to recall problems. Giele and Elder (1998) discussed the disadvantages of the reconstructive design:
Retrospective designs can, on their face, cover a longer time span than usually is practical with prospective designs. However, prospectively collected data are generally considered to be more reliable than recall data because of the limitations and biases of the human memory (p.107).
In addition to memory loss, the human memory can embellish memories based on what should have happened. However, the WILIS data offered a rich description of LIS careers that does not exist anywhere else in the LIS field.
While the WILIS researchers implied the generalizability of their data, the census was conducted with graduates of LIS programs in North Carolina. Geographic bias may exist; the careers and work of graduates might differ by region or LIS program.
The WILIS survey collected information on job functions; however, the full range of data curation activities was not captured here. Further investigation into other data curation functions not mentioned in the survey (e.g., data production, collection,
preservation, and migration) is warranted. Furthermore, the WILIS study design missed workers from scientific backgrounds that receive on-the-job training in order to move into data curation positions. Future research will be needed to test the study’s findings with other populations, geographic regions and other methods.
4.3 Conclusions
These findings are relevant for educational planning. In the United States, three universities have developed graduate programs to prepare information professionals for data curation (DigCCurr, 2011; Hank, Tibbo & Lee, 2010; Palmer et al., 2007). An understanding of the career paths and work lives of data curation professionals will enhance educators’ ability to prepare and mentor students who want to pursue careers in data curation.
The education of librarians and archivists has benefited from the competencies defined by the American Library Association, Society of American Archivists and American Society of Information Science and Technology (American Library Association, 2009; Society of American Archivists, 2011; ASIS&T, 2001). No
substantive attempt has been made to create competencies for data curation professionals. These study findings could inform a discussion of the necessary knowledge base and skill set for data professionals.
Further, this study has implications for employers. Managers hiring data
References
8Rs Research Team. (2005). The future of human resources in Canadian libraries (Report): Canadian Library Human Resources Study.
Albanese, A. R. (2008). Take this job and love it. Library Journal, 133(2), 36-39. American Library Association. (2009). ALA’s Core Competences of Librarianship.
Retrieved on April 26, 2011 from:
http://www.ala.org/ala/educationcareers/careers/corecomp/corecompetences/index
.cfm
American Society of Information Science and Technology (ASIS&T). (2001). ASIS&T Educational Guidelines. Retrieved on April 26, 2011 from:
http://www.asis.org/Board/educational_guidelines.html
American Council of Learned Societies (ACLS). (2006). Our Cultural Commonwealth: The report of the American Council of Learned Societies Commission on
Cyberinfrastructure for the Humanities and Social Sciences. Retrieved on March 7, 2012 from:
http://www.acls.org/cyberinfrastructure/ourculturalcommonwealth.pdf Association of Research Libraries. (2009). The Research Library’s Role in Digital
Bermes, E., & Fauduet, L. (2011). The human face of digital preservation: Organizational and staff challenges, and initiatives at the Bibliotheque nationale de France. The International Journal of Digital Curation, 6(1), 226-237.
Berry, J. N. (2007). Great work, genuine problems. Library Journal, 132(16), 26-29. Botticelli, P., Fulton, B., Pearce-Moses, R., Szuter, C., & Watters, P. (2011). Educating
digital curators: Challenges and opportunities. The International Journal of Digital Curation, 6(2), 146-164.
Bowker, G. C., & Star, S. L. (2009). Cyberscholarship; or , “A Rose is a Rose is a…”. Educause, 44(3), 6-7.
Choudury, S. (2010). Data curation: An ecological perspective. College and Research Libraries News, 71(4), 194-196.
Cragin, M. H., Palmer, C. L., Varvel, V. E., Collie, A., & Dolan, M. A. (2009). Analyzing data curation job descriptions. Proceedings of the 5th International Digital Curation Conference. Retrieved on September 20, 2011 from
http://www.ideals.illinois.edu/handle/2142/14544
DigCCurr. (2011). DigCCurr Preserving Access to Our Digital Future: Building an International Digital Curation Curriculum. Retrieved from
http://www.ils.unc.edu/digccurr/
Digital Curation Centre. (2011). Resources for Digital Curators. Retrieved from
http://www.dcc.ac.uk/resources
Giele, J. Z., Elder, G. H. Jr. (1998). Methods of Life Course Research : Qualitative and Quantitative Approaches. Thousand Oaks, CA: Sage Publications.
Griffiths, J. (2009). The Future of Librarians in the Workforce. Retrieved on April 26, 2011 from: http://libraryworkforce.org/tiki-index.php
Hank, C., Tibbo, H.R., & Lee, C.A. (2010). DigCCurr I Final Report, 2006-09: Results and Recommendations from the Digital Curation Curriculum Development Project and the Carolina Digital Curation Fellowship Program. Chapel Hill, NC: School of Information and Library Science, University of North Carolina. Retrieved from http://www.ils.unc.edu/digccurr
Heidorn, P. B. (2011). The emerging role of libraries in data curation and e-science. Journal of Library Administration, 51(7-8), 662-672.
Higgins, S. (2011). Digital curation: The emergence of a new discipline. The International Journal of Digital Curation, 6(2), 78-88.
Hswe, P., & Holt, A. (2011). Guide for Research Libraries: The NSF Data Sharing Policy ARL Transforming Research Libraries. Washington, DC: Association of Research Libraries.
Igbaria, M., Greenhouse, J. H., & Parasuraman, S. (1991). Career orientations of MIS employees: An empirical analysis. MIS Quarterly, 15(2), 151-168.
Kim, K.S., Chiu, M. S., Sin, S. C., & Robbins, L. (2007). Recruiting a diverse workforce for academic/research librarianship: Career decisions of subject specialists and librarians of color. College and Research Libraries, 68(6), 533-552.
Kim, Y., Addom, B. K., & Stanton, J. M. (2011). Education for eScience professionals: Integrating data curation and cyberinfrastructure. The International Journal of Digital Curation, 6(1), 125-138.
Landry, M. B. (2000). The effects of life satisfaction and job satisfaction on reference librarians and their work. Reference and User Services Quarterly, 40(2), 166-177. Leaf, B.D. (2011). Developing a Visualization Tool for Archived Social Science Research
Data. (Master’s Theses). The University of North Carolina, Chapel Hill, NC.
Lee, C. (2008). What do job postings indicate about digital curation competencies. Presentation at the Society of American Archivists Research Forum, August 26, 2008, San Francisco, CA. Retrieved on September 20, 2011 from
http://www.archivists.org/publications/proceedings/resarchforum/2008/CalLee-SAA-ResearchForum2008.pdf
Lee, C. (2009). Functions and Skills: Dimension 2 of Matrix of Digital Curation Knowledge and Competencies (Version 18) Retrieved from
http://www.ils.unc.edu/digccurr/digccurr-functions.html
Marshall, J.G., Marshall, V. W., Morgan, J. C., Barreau, D., Moran, B. B., Solomon, P., Rathbun-Grubb, S., & Thompson, C. A. (2009). Where are they now? Results of a career survey of library and information science graduates. Library Trends, 58(2), 141-154.
Marshall, V.W., Heinz, W.R., Krueger, H., &Verma, A. (Eds.).(2001). Restructuring work and the life course. Toronto, ON, Canada: University of Toronto Press. Marshall, V. W., Rathbun-Grubb, S., & Marshall, J. G. (2009). Using the Life Course
Perspective to study library and information science careers. Library Trends, 58(2), 127-140.
McKinsky Global Institute. (2011). Big data: The next frontier for innovation, competition, and productivity. Retrieved on March 2012:
http://www.mckinsey.com/Insights/MGI/Research/Technology_and_Innovation/Bi g_data_The_next_frontier_for_innovation
Moran, B.B., Marshall, J.G., & Rathbun-Grubb, S. (2010). The academic library workforce: Past, present, and future. Library Trends, 59(1-2), 208-219. Morgan, C., & Morgan, J. C. (2009). The effects of entering the LIS workforce in a
recession: North Carolina, 1964-2005. Library Trends, 58(2), 291-300.
Morgan, J. C., Marshall, J.G., Marshall, V. W., & Thompson, C.A. (2009). Designing and implementing a career retrospective web-based survey of Library and Information Science Graduates. Library Trends, 58(2), 155-166.
Palmer, C.L., Heidorn, P. B., Wright, D., & Cragin, M. H. (2007). Graduate curriculum for biological information specialists: A key to integration of scale in biology. The International Journal of Digital Curation, 2(2), 31-40.
Prom, C. (2011). Making digital curation a systematic institutional function. The International Journal of Digital Curation, 2(1), 139-152.
Rathbun-Grubb, S. (2009). Leaving Librarianship: A Study of the Determinants and Consequences of Occupational Turnover. (Doctoral Dissertation). The University of North Carolina, Chapel Hill, NC.
Rathbun-Grubb, S., & Marshall, J. G. (2009). Public librarianship as a career: Challenges and prospects. Library Trends, 58(2), 263-275.
Reich, B. H., & Kaarst-Brown, M.L. (1999). Seeding the line: Understanding the transition from IT to non-IT careers. MIS Quarterly, 23(3), 337-364.
Rusbridge, C. (2007). Create, curate, re-use: the expanding life course of digital research data. EDUCAUSE Australasia 2007 Advancing Knowledge Pushing Boundaries. CAUDIT. Retrieved from http://hdl.handle.net/1842/1731
Sivak, A. & De Long, K. (2009). The blind man describes the elephant: The scope and development of the 8Rs Canadian Library Human Resource Study. Library Trends, 58(2), 167-178.
Society of American Archivists. (2011). Guidelines for a Graduate Program in Archival Studies. Retrieved from http://www2.archivists.org/gpas
Steffen, N., Lance, K. C., Russell, B., & Lietzau, Z. (2004). Retirement, Retention and Recruitment: The future of librarianship in Colorado. Denver, CO: Colorado State Library, Library Research Service.
Steffen, N., & Lietzau, Z. (2009). Retirement, retention and recruitment in Colorado libraries: The 3Rs study revisited. Library Trends, 58(2), 179-191.
Walch, V. I. (2006). A*CENSUS results. Retrieved on April 26, 2011 from:
http://www2.archivists.org/initiatives/acensus-archival-census-education-needs-survey-in-the-united-states
Walker, S. A. (2010). From Science to Librarianship: Career Motivations of the
Scientist-Turned-Librarian. (Master’s Theses). The University of North Carolina, Chapel Hill, NC.
Waters, D. J. (2007). “Doing much more than we have so far attempted”. Educause, 42(5), 8-9.
Weech, T. L., & Konieczny, A. M. (2007). Alternative careers for graduates of LIS schools: The North American perspective – an analysis of the literature. Journal of Librarianship and Information Science, 39(2), 67-78.
Wilder, S. (2000). The age demographics of academic librarians: a profession apart. New York, NY: Haworth Information Press.
Williamson, J. M., Pemberton, A. F., & Lousbury, J. W. (2005). An investigation of career and job satisfaction in relation to personality traits of information professionals. The Library Quarterly, 75(2), 122-141.
Appendix
Figures and Tables
Group Statistics
Whether R performs a data function in current or
previous job Yes/No N Mean Std. Deviation
Std. Error Mean
Age Yes 551 47.65 10.873 .463
No 1585 49.42 11.742 .295
Independent Samples Test Levene's Test for
Equality of
Variances t-test for Equality of Means
F Sig. t df
Sig. (2-tailed) Mean Differen ce Std. Error Differen ce 95% Confidence Interval of the
Difference Lower Upper Age Equal
variances assumed
7.977 .005 -3.12 0
2134 .002 -1.779 .570 -2.896 -.661
Equal variances not assumed -3.23 9 1027 .745
.001 -1.779 .549 -2.856 -.701
Table 1. T-test for age at time of survey by data curation status
Group Statistics
Whether R performs a data function in current or
previous job Yes/No N Mean Std. Deviation
Std. Error Mean
AGE_at_GRAD Yes 549 33.39 8.520 .364
No 1585 32.53 8.606 .216
Independent Samples Test Levene's Test for
Equality of
Variances t-test for Equality of Means
F Sig. t df
Sig. (2-tailed) Mean Differen ce Std. Error Differen ce 95% Confidence Interval of the
Difference Lower Upper AGE_at
_GRAD Equal variances assumed
.061 .805 2.03 7
2132 .042 .866 .425 .032 1.700
Equal variances not assumed 2.04 7 962.1 61
.041 .866 .423 .036 1.696
Crosstab
A20: What is your sex?
Total Male Female
Whether R performs a data
function in current or
previous job
No Count 285 1304 1589
% within row 17.9% 82.1% 100.0%
Yes Count 111 444 555
% within row 20.0% 80.0% 100.0%
Total Count 396 1748 2144
% within row 18.5% 81.5% 100.0%
Table 3. Crosstabulation of gender by data curation status
Crosstab
A21: What is your current relationship status?
Total Single (never
married)
Married or
living with a
partner
Divorced/
Separated Widowed
Whether R
performs a data
function in
current or
previous job
No Count 279 1106 169 31 1585
% within row 17.6% 69.8% 10.7% 2.0% 100.0
%
Yes Count 78 408 62 6 554
% within row 14.1% 73.6% 11.2% 1.1% 100.0
%
Total Count 357 1514 231 37 2139
% within row 16.7% 70.8% 10.8% 1.7% 100.0
%
Crosstab
race
Total White Black
Asian/P
I Other
Whether R performs a
data function in
current or previous job
No Count 1399 101 27 58 1585
% within row 88.3% 6.4% 1.7% 3.7% 100.0%
Yes Count 489 27 15 24 555
% within row 88.1% 4.9% 2.7% 4.3% 100.0%
Total Count 1888 128 42 82 2140
% within row 88.2% 6.0% 2.0% 3.8% 100.0% Table 5. Crosstabulation of race and ethnicity by data curation status
Terms in job titles 1980-1989 (n=61)
1990-1999 (n=133)
2000-2007 (n=244)
Analyst/Analysis - 3.0% (4) 3.7% (9)
Data - 0.8% (1) -
Digital - - 3.3% (8)
Librarian/Library 40.9% (25) 39.8% (53) 36.1% (88)
Research 2% (1) 4.5% (6) 3.3% (8)
Science/e-Science 2% (1) - 1.2% (3)
Job Type in Current or Previous Joba
Frequency Percent Valid Percent
Cumulative
Percent
Valid in a library or info center
using LIS skills
440 79.3 79.3 79.3
in a library or info center
NOT using LIS skills
1 .2 .2 79.5
in a non-library or non-info
center using LIS skills
114 20.5 20.5 100.0
Total 555 100.0 100.0
a. Whether R performs a data function in current or previous job Yes/No = Yes
Table 7. Percent of data curators by job type (n=555)
Library Type in Current or Previous Joba
Frequency Percent Valid Percent
Cumulative
Percent
Valid School library 208 37.5 47.2 47.2
public library 37 6.7 8.4 55.6
college/university library 82 14.8 18.6 74.1
community college/tech
institute library
11 2.0 2.5 76.6
consortium 4 .7 .9 77.6
Special library 77 13.9 17.5 95.0
other 22 4.0 5.0 100.0
Total 441 79.5 100.0
Missing .00 114 20.5
Total 555 100.0
a. Whether R performs a data function in current or previous job Yes/No = Yes
Crosstab
Library Type in Current or Previous Job
School library public library academic library communit y college library Consort - ium special
library other Total Whether R
performs a data function
No Count 269 283 322 50 2 18 32 1099
% within row
24.5% 25.8% 29.3% 4.5% .2% 1.6% 2.9% 100.0%
Yes Count 208 37 82 11 4 8 22 441
% within row
47.2% 8.4% 18.6% 2.5% .9% 1.8% 5.0% 100.0%
Total Count 477 320 404 61 6 26 54 1540
% within row
31.0% 20.8% 26.2% 4.0% .4% 1.7% 3.5% 100.0%
Chi-Square Tests
Value df
Asymp. Sig. (2-sided)
Pearson Chi-Square 143.685a 6 .000
Likelihood Ratio 147.150 6 .000
Linear-by-Linear Association .091 1 .763
N of Valid Cases 1540
a. 2 cells (9.1%) have expected count less than 5. The minimum expected count is 1.72.
Table 9. Crosstabulation of library type by data curation status
Crosstab
Employer Size in Current or Previous Job
Total One 2-9 10-24 25-99 100-499 500-999 1,000+
Whether R performs a data function
No Count 53 63 82 288 388 170 474 1518
% within row 3.5% 4.2% 5.4% 19.0% 25.6% 11.2% 31.2% 100.0%
Yes Count 5 11 19 143 134 58 184 554
% within row .9% 2.0% 3.4% 25.8% 24.2% 10.5% 33.2% 100.0%
Total Count 58 74 101 431 522 228 658 2072
% within row 2.8% 3.6% 4.9% 20.8% 25.2% 11.0% 31.8% 100.0%
Chi-Square Tests
Value df
Asymp. Sig. (2-sided)
Pearson Chi-Square 28.415a 6 .000
Likelihood Ratio 31.326 6 .000
Linear-by-Linear Association 4.793 1 .029 N of Valid Cases 2072
a. 0 cells (.0%) have expected count less than 5. The minimum expected count is 15.51.
Crosstab
Library or department Size in Current or Previous Job
Total One 2-9 10-24 25-99
100-499 500-999 1,000 + Whether R performs a data function
No Count 152 534 316 330 155 11 14 1512 % within
row
10.1% 35.3% 20.9% 21.8% 10.3 %
.7% .9% 100.0%
Yes Count 62 253 95 105 30 4 5 554 % within
row
11.2% 45.7% 17.1% 19.0% 5.4 %
.7% .9% 100.0%
Total Count 214 787 411 435 185 15 19 2066 % within
row
10.4% 38.1% 19.9% 21.1% 9.0 %
.7% .9% 100.0%
Chi-Square Tests
Value df
Asymp. Sig. (2-sided)
Pearson Chi-Square 26.959a 6 .000
Likelihood Ratio 27.812 6 .000
Linear-by-Linear Association 16.637 1 .000 N of Valid Cases 2066
a. 1 cells (7.1%) have expected count less than 5. The minimum expected count is 4.02.
Table 11. Crosstabulation of library or department size by data curation status
Crosstab
B9A: Do you consider yourself to have left the LIS field?
Total
Yes No
Whether R performs a data function
No Count 369 1220 1589
% within row 23.2% 76.8% 100.0%
Yes Count 77 477 554
% within row 13.9% 86.1% 100.0%
Total Count 446 1697 2143
% within row 20.8% 79.2% 100.0% Chi-Square Tests
Value df
Asymp. Sig. (2-sided)
Exact Sig. (2-sided)
Exact Sig. (1-sided) Pearson Chi-Square 21.666a 1 .000
Continuity Correctionb 21.104 1 .000
Likelihood Ratio 23.125 1 .000
Fisher's Exact Test .000 .000
Linear-by-Linear Association 21.656 1 .000 N of Valid Cases 2143
a. 0 cells (.0%) have expected count less than 5. The minimum expected count is 115.30. b. Computed only for a 2x2 table
Crosstabulation
decade of current and previous job was started
Total 1980-1989 1990-1999 2000-2007 Whether R performs a
data function in current or previous job
No Count 226 469 894 1589
% within row 14.2% 29.5% 56.3% 100.0%
Yes Count 99 196 260 555
% within row 17.8% 35.3% 46.8% 100.0%
Total Count 325 665 1154 2144
% within row 15.2% 31.0% 53.8% 100.0%
Chi-Square Tests
Value df
Asymp. Sig. (2-sided) Pearson Chi-Square 14.781a 2 .001
Likelihood Ratio 14.741 2 .001
Linear-by-Linear Association 12.919 1 .000 N of Valid Cases 2144
a. 0 cells (.0%) have expected count less than 5. The minimum expected count is 84.13.
Table 13. Crosstabulation of whether performing at least one data function by decade job was started
Crosstab
decade of current and previous job was started
Total 1980-1989 1990-1999 2000-2007
whether R performed data management in Current or Previous Job
no Count 252 516 979 1747
% within row 14.4% 29.5% 56.0% 100.0%
yes Count 73 149 175 397
% within row 18.4% 37.5% 44.1% 100.0%
Total Count 325 665 1154 2144
% within row 15.2% 31.0% 53.8% 100.0% Chi-Square Tests
Value df
Asymp. Sig. (2-sided) Pearson Chi-Square 18.613a 2 .000
Likelihood Ratio 18.567 2 .000
Linear-by-Linear Association 15.169 1 .000 N of Valid Cases 2144
a. 0 cells (.0%) have expected count less than 5. The minimum expected count is 60.18.
Crosstab
decade of current and previous job was started
Total 1980-1989 1990-1999 2000-2007
whether R performed database
administration in Current or Previous Job
no Count 275 558 1014 1847
% within row 14.9% 30.2% 54.9% 100.0%
yes Count 50 107 140 297
% within row 16.8% 36.0% 47.1% 100.0%
Total Count 325 665 1154 2144
% within row 15.2% 31.0% 53.8% 100.0% Chi-Square Tests
Value Df
Asymp. Sig. (2-sided)
Pearson Chi-Square 6.293a 2 .043
Likelihood Ratio 6.264 2 .044
Linear-by-Linear Association 4.460 1 .035 N of Valid Cases 2144
a. 0 cells (.0%) have expected count less than 5. The minimum expected count is 45.02.
Table 15. Crosstabulation of whether performing database administration by decade job was started
Crosstab
decade of current and previous job was started
Total 1980-1989 1990-1999 2000-2007
whether R performed database
development in Current or Previous Job
no Count 285 589 1045 1919
% within row 14.9% 30.7% 54.5% 100.0%
yes Count 40 76 109 225
% within row 17.8% 33.8% 48.4% 100.0%
Total Count 325 665 1154 2144
% within row 15.2% 31.0% 53.8% 100.0% Chi-Square Tests
Value df
Asymp. Sig. (2-sided)
Pearson Chi-Square 3.107a 2 .211
Likelihood Ratio 3.081 2 .214
Linear-by-Linear Association 2.976 1 .085 N of Valid Cases 2144
a. 0 cells (.0%) have expected count less than 5. The minimum expected count is 34.11.
Crosstab
decade of current and previous job was started
Total 1980-1989 1990-1999 2000-2007
whether R performed data analysis in Current or Previous Job
no Count 299 606 1060 1965
% within row 15.2% 30.8% 53.9% 100.0%
yes Count 26 59 94 179
% within row 14.5% 33.0% 52.5% 100.0%
Total Count 325 665 1154 2144
% within row 15.2% 31.0% 53.8% 100.0% Chi-Square Tests
Value df
Asymp. Sig. (2-sided)
Pearson Chi-Square .352a 2 .839
Likelihood Ratio .349 2 .840
Linear-by-Linear Association .017 1 .898 N of Valid Cases 2144
a. 0 cells (.0%) have expected count less than 5. The minimum expected count is 27.13.
Table 17. Crosstabulation of whether performing data analysis by decade job was started
Data Curators (n=555) Others (n=1533)
Staff training and evaluation* 55.0% 31.6%
Communications and public relations* 55.0% 32.6%
Management* 51.9% 31.4%
Financial management* 49.2% 27.1%
Strategic planning* 42.7% 24.2%
Facilities and space planning* 40.9% 25.3%
Development and external relations* 31.4% 16.2%
Organizational evaluation and research* 30.6% 15.3%
Community relations* 30.1% 70%
Human resources* 25.8% 17.3%
Grants administration* 22.7% 12.7%
Marketing and sales* 17.5% 9.9%
*Denotes significant differences were detected (p=0.000).
Note: For this question, respondents were able to check all that apply. The percents will not equal 100.
Data Curators (n=555) Others (n=1533)
Collection development* 65.8% 46.4%
Electronic resources* 62.5% 30.7%
Weeding* 58.7% 41.2%
Acquisitions* 57.5% 33.5%
Cataloging* 54.2% 29.9%
Circulation* 52.3% 31.9%
Access and delivery* 49.7% 23.5%
Physical processing* 44.0% 20.9%
Technical services* 41.4% 15.7%
Subject expertise* 37.5% 20.5%
Serials* 35.3% 15.3%
Archives* 28.1% 10.7%
Document delivery* 25.9% 8.7%
Interlibrary loan* 25.2% 15.4%
Special collections* 22.9% 10.3%
Backfile maintenance* 19.6% 6.5%
Indexing* 15.5% 3.7%
Preservation and digital repositories* 14.8% 5.0%
Metadata* 11.5% 3.7%
Rare books* 7.7% 3.3%
*Denotes significant differences were detected (p=0.000).
Note: For this question, respondents were able to check all that apply. The percents will not equal 100.
Table 19. Percent performing access and collections functions by data curator status
Data Curators (n=555) Others (n=1533)
Reference* 67.2% 50.1%
User training and support* 63.1% 30.0%
Technology instruction* 59.5% 25.2%
Committee service* 53.5% 34.8%
Teaching* 53.0% 34.2%
Copyright and intellectual property* 50.3% 19.2%
Instructional technology* 50.1% 22.3%
Bibliographic instruction* 46.1% 29.4%
Specialized research services* 26.1% 12.3%
Academic research and publications* 19.1% 11.4%
Vendor training and support* 12.8% 2.0%
*Denotes significant differences were detected (p=0.000).
Note: For this question, respondents were able to check all that apply. The percents will not equal 100.
Data Curators (n=555) Others (n=1533)
Website design/management* 56.8% 14.3%
Digital library initiatives* 27.2% 3.9%
User interface design* 24.0% 2.5%
Usability testing* 19.8% 2.7%
*Denotes significant differences were detected (p=0.000).
Note: For this question, respondents were able to check all that apply. The percents will not equal 100.
Table 21. Percent performing digital information technology and web access functions by data curator status
Data Curators (n=555) Others (n=1533)
Information technology * 39.8% 6.4%
Information policy* 28.5% 5.1%
Information systems support* 25.6% 2.5%
Programming* 25.2% 2.8%
Content management* 24.7% 1.6%
Information systems management* 22.7% 2.4%
Consulting* 20.2% 4.1%
Computer systems analysis* 17.1% 1.2%
Software design* 13.5% 1.7%
Information architecture* 11.9% 1.2%
Information engineering* 6.1% 0.2%
Knowledge management * 4.7% 1.0%
*Denotes significant differences were detected (p=0.000).
Note: For this question, respondents were able to check all that apply. The percents will not equal 100.