Overdiagnosis and Overtreatment of Prostate Cancer and
Breast Cancer Due to Screening
By
Jeremy Littleton
A Master's Paper submitted to the faculty of the University ofNorth Carolina at Chapel Hill
In partial fulfillment of the requirements for the degree of Master of Public Health in
the Public Health Leadership Program.
Introduction
Screening
Screening is the testing of asymptomatic individuals for a given disease with no signs or
symptoms of the disease in question. Questions, physical exam, laboratory tests, and imaging
are commonly used screening modalities.1 Substantial benefits may be associated with
screening, ideally a reduction in mortality if screening diagnoses disease at an earlier, more
treatable stage. Earlier diagnosis of disease can also lead to decreased morbidity for these
patients. In addition, for patients who worry about having a particular disease, a negative
screening test may help them achieve peace of mind.
Yet screening is also associated with potential harms, including false positives, side
effects, and overdiagnosis. A false positive test occurs when a positive screening result occurs in
a patient who does not actually have the disease in question. False positives may lead to
unnecessary biopsies, further work-up, and unnecessary anxiety for the patient. A recent review
of studies that assessed the long-term effects of false positive mammograms found that women
receiving a false positive diagnosis of breast cancer by mammogram were significantly more
likely to experience worry, intrusive thoughts, and anxiety specific to breast cancer than women
who received normal diagnoses.2 Screening itself can lead to side effects, for example, in prostate cancer screening with digital rectal exam, the test itself can lead to a great deal of
anxiety, whether results are positive or negative. In colon cancer screening with colonoscopy,
scoping results in a ruptured colon in about 1-2 in every I 000 screened patients. 3• 4 A third risk
Overdiagnosis
Overdiagnosis is the diagnosis by screening of cancers that would have never become
clinically meaningful in the absence of screening. This can occur in two ways: either screening
detects cancer that is non-progressive or progresses so slowly that it never causes patient
morbidity, or screening detects cancer at a time in the patient's life when the patient is old
enough or sick enough that he/she will die of another disease before the cancer causes significant
morbidity5 Similar to false positives, overdiagnosis can lead to unnecessary biopsies,
unnecessary treatments, and adverse effects. All of these excess diagnostic and therapeutic
measures lead to increased costs that affect both the patient and the health care system as a
whole. The risk of overdiagnosis is higher in the elderly because they have more comorbidities
which contribute to overall mortality.
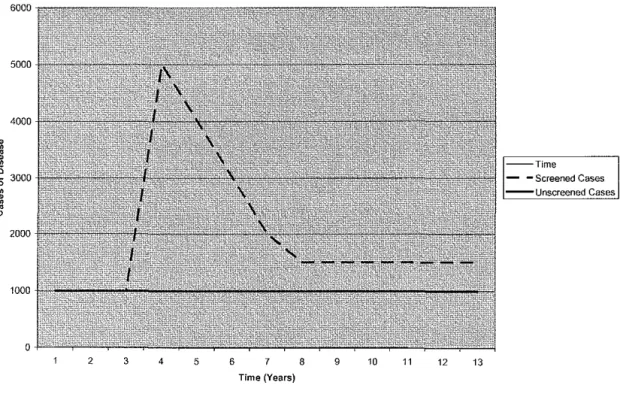
Figure 1: Number of Cases of Disease in the Presence and Absence of Screening*"
6000
5000
4000
~
~ 3000
• • ~
"
20001000
0
2 3 4 5
Time - -Screened Cases - - Unscreened Cases
6 7 8 9 10 11 12 13
Overdiagnosis due to screening can be measured by comparing rates of disease in
screened and unscreened cohorts of patients over a period of time. Figure 1 shows a hypothetical
study in which an identical number of patients from a given population were randomly selected
for yearly screening or no screening. Both groups initially have 1000 cases of disease per year.
This model assumes that the baseline incidence of disease is not changing in the population, and
thus the unscreened group continues to have 1000 cases of disease per year. However, when the
screening program is initiated in year 3, a large peak in the number of incident cases occurs in
the screened group due to screening finding many of the prevalent cases of disease in the
population. These cases developed over the lifetime of the patients being screened, and after this
initial increase in incidence, the number of cases declines as fewer and fewer prevalent cases are
picked up by screening.
This decline continues until a period of time equivalent to the lead time has passed since
the initiation of screening. The lead time is the amount of time by which screening advances
diagnosis. Thus if screening can detect disease 5 years before detectible symptoms of the disease
develop, the disease has a lead time of 5 years. At the end of the lead time from initial screening,
the number of cases in the screened group should be identical to the number of cases in the
unscreened group: all of the prevalent cases should have been detected by this time, and thus
screening should be detecting each case as it arises 5 years before it would have become
clinically symptomatic. Yet in figure I, the number of cases continues to be higher in the
screened group than the unscreened group after the 5-year lead time has passed. This
discrepancy of 500 cases is due to overdiagnosis: these cases are those that would have never
come to clinical attention because the patient would have died of comorbid diseases whether they
patients would have never been diagnosed in the absence of screening and any treatment or
further diagnostic tests for their disease would thus be unnecessary.
Yet figure I is a simplified example of overdiagnosis; in reality, the situation can be
much more complicated. First of all, the baseline incidence of most diseases does not remain
stable over time. The incidence of breast cancer, for example, gradually increased from 1980 to
2000 and has since leveled off6 If the baseline incidence were increasing over time in the above example, the incidence of disease in the unscreened group would increase over time. The
incidence of disease in the screened group would increase by this baseline amount plus whatever
increased diagnosis occurred due to detection of prevalent cases and overdiagnosis. Another
assumption that the above example does not take into account is the possibility of contamination
in the unscreened group. Many screening tests are so widespread that it is difficult to prevent
opportunistic screening to occur in the control group. In this case, the incidence in the control
l,'fOup would seem higher than the actual incidence, and thus the amount of overdiagnosis left
over at the end of the study would be underestimated. In addition, the lead time of a screening
test is hard to estimate with accuracy. Diseases that have a range of clinical manifestations, such
as those in which some cases are aggressive and others are less so, tend to have a range of lead
times. More aggressive disease has a shorter lead time than less aggressive disease. Most
diseases have a range of possible lead times depending on the aggressiveness of the disease,
which makes it difficult to predict the point at which excess cases above baseline are due to
overdiagnosis alone.
Why is Overdiagnosis a Significant Problem
Overdiagnosis is a particular concern in cancer screening for this reason. Many cancers
However, other cancers are extremely aggressive and clinical disease develops in a short period
of time. Unfortunately, screening disproportionately detects slower growing cancers due to the
longer lead time during which the patient has disease. This phenomenon is known as length-time
bias.1 An extreme form of length-time bias is in effect in the type of overdiagnosis in which a screen-diagnosed cancer would never have been diagnosed because the cancer is growing so
slowly that it would have never caused symptoms. Patients with slow growing cancers, therefore,
are at high risk of overdiagnosis and subsequent overtreatrnent. This risk is enhanced in the
elderly, who are at high risk for many types of cancers. The risk of overdiagnosis is concerning
for two types of cancer in particular-prostate cancer and breast cancer-because each has a
significant proportion of slow growing cancers, screening is fairly widespread, and the elderly
are those who are most commonly screened.
Prostate Cancer Screening
Prostate cancer is the most common cancer in US males; the American Cancer Society
estimates that 218,890 new cases will occur in 2007. It is the second leading cause of cancer
death in males with 27,050 deaths estimated by the ACS to occur in 2007.6 Currently, screening for prostate cancer occurs by serum prostate-specific antigen (PSA) level and digital rectal exam
(ORE). Thus far, the evidence is inconclusive as to whether the benefits of screening outweigh
the risks. In their most recent review of the literature, the United States Preventive Services Task
Force (USPSTF) concluded that the evidence was insufficient to recommend for or against
routine PSA or ORE screening.7• 8 The primary potential benefits of screening include decreased
morbidity and mortality due to prostate cancer. Previous studies have shown conflicting results
as to whether screening decreases prostate cancer mortality. 9'12 Two large randomized
(ERSPC) and the U.S. National Cancer Institute "Prostate, Lung, Colorectal, and Ovary" Trial
(PLCO), are currently underway, but data on mortality will not be available for a few years.
Screening is associated with potential harms as well. PSA screening for prostate cancer
is less specific in men at high risk for benign prostatic hyperplasia, thus false positives are one
potential risk, especially in older populations. This can lead to unnecessary biopsies, increased
anxiety, and even unnecessary treatment with prostatectomy, radiation, or androgen deprivation
and the adverse effects that result from these therapies. Overdiagnosis is another worrisome risk
of prostate cancer screening.
Overdiagnosis is particularly concerning in prostate cancer screening for several reasons.
Elderly men are at high risk of developing prostate cancer, yet this population commonly has
many other comorbidities that limit life expectancy. Thus screening in this population would
lead to diagnosis of many patients who would never have developed clinical disease, leading to
unnecessary biopsies, costs, and possibly treatment. In addition, much uncertainty exists
regarding the natural history of untreated or minimally treated prostate cancer, but it is likely that
a significant proportion of prostate cancer patients do not benefit from treatment. A prospective
cohort study in Sweden found that 15 years after diagnosis of localized prostate cancer, survival
rates in 223 patients who deferred treatment were similar to those who received initial treatment
(81% 15-yr survival in both groups). 13 A follow up of this study at 20 years found that in the untreated patients, prostate-cancer specific survival fell from 79% at 15 years to 54% at 20 years,
indicating that early treatment of patients with a life expectancy longer than 15 years may be
beneficial.14 However, another recent retrospective cohort study of767 men diagnosed with
early stage prostate cancer and treated with observation or androgen deprivation therapy alone
to 18 per I 000 patients after 15 years. In this study, higher Gleason scores were correlated with
higher prostate cancer specific mortality rates, ranging from 6 per I 000 person years for low
grade cancers to 121 per 1000 person-years for high grade cancers.15
Despite the inconsistencies across these studies, they all indicate that there is a significant
proportion of men diagnosed with prostate cancer who do not benefit from early treatment.
Because screening preferentially detects low-grade cancers by length-time bias and treatment
does not seem to help patients with early stage disease at 10 to 15 years of follow-up, it is likely
that a significant amount of overdiagnosis and overtreatment occur in patients diagnosed with
prostate cancer by screening. Moreover, it is nearly impossible to predict which patients will
develop comorbidities and die of causes other than prostate cancer 15 years down the line. Thus
the overall potential for overdiagnosis due to prostate cancer screening seems to be high.
Breast Cancer Screening
Statistically, breast cancer is comparable to prostate cancer in terms of cases and
mortality. The ACS predicts 178,480 new cases among US women in 2007, which makes breast
cancer the most common cancer diagnosis. In addition, it will also be the second most common
cause of cancer-related death among women, with 40,460 predicted deaths in 2007.6 Screening modalities for breast cancer include mammography, clinical breast exam (CBE), and breast
self-examination (BSE). In their most recent review, the USPSTF performed a meta-analysis of7
high quality trials and found a relative risk (RR) of dying of breast cancer of 0.84 (95% CI: 0.
77-0.91) for women screened with mammography compared to those unscreened.16 The USPSTF thus recommends screening mammography every 1-2 years for all women aged 40 and older.
However, they found insufficient evidence to recommend for or against CBE alone for breast
reduction in breast cancer mortality. Harms of screening include anxiety, discomfort, cost, and
false positives leading to unnecessary biopsies and treatment. In addition, overdiagnosis leading
to overtreatment, particularly in DCIS patients, is a concern.
Some of the breast cancer cases diagnosed by screening are ductal carcinoma in situ
(DCIS), which is a localized, slowly progressive form. One large study of over 650,000
mammograms found that approximately 18% of breast cancer cases diagnosed by screening
mammography were DCIS.18 This significant proportion of women diagnosed with breast
cancer would be at higher risk for overdiagnosis than women diagnosed with invasive cancers
due to the more slowly progressive nature ofDCIS. In addition, the rate of diagnosis ofDCIS by
mammography seems to increase with age with over I in every 1000 women aged 70-84
screened by mammography diagnosed with DCIS as compared to about 1 in every 1800 women
aged 40-49 screened by mammography diagnosed with DCIS. 18
Some argue that treatment of DCIS leads to a reduction in the incidence of invasive
cancers, but data on the natural progression of untreated DCIS are scarce. One study of 80
women with untreated DCIS found that 14% developed invasive cancer after a mean follow-up
of 17.5 years.19 Smaller studies have suggested that up to 50% ofDCIS progresses to invasive
breast cancer, but that half of these lesions do not show up within the lifetime of the diagnosed
woman because a significant proportion ofDCIS cases are elderly.20•21 Overall, it is not clear
what proportion of DCIS progresses to invasive breast cancer. However, in 1999 over 28% of
women with DCIS had mastectomy, 64% had lumpectomy, and 33% had radiation.22 Thus,
because it is slowly progressive in most cases and it is more commonly diagnosed in the elderly,
a significant proportion of women with screen-detected DCIS appear to be at risk for
women who are screen diagnosed with invasive breast cancer, particularly elderly women with
short life expectancies due to other comorbidities, are overdiagnosed and how much
overtreatment occurs as a result.
Focused Clinical Question
Overall, overdiagnosis and overtreatment due to breast cancer and prostate cancer
screening are undoubtedly present. The question is how much overdiagnosis and overtreatment
actually occur. Estimates of the proportion of overdiagnosed cases due to screening have ranged
widely, from 15.4% to 84% for prostate cancer and from 5% to 33% for breast cancer. Thus, the
true magnitude of overdiagnosis of both prostate cancer and breast cancer is unknown. This
review will attempt to answer the following questions:
I. To what extent does screening for prostate cancer with serum PSA and DRE lead to
overdiagnosis and overtreatment?
2. To what extent does screening for breast cancer with mammography and CBE lead to
overdiagnosis and overtreatment?
3. What conclusions can be drawn about the problems of overdiagnosis and overtreatment
due to screening from a comparison of prostate cancer and breast cancer screening?
Methods
Background
Many different definitions have been used for overdiagnosis and overtreatment, and thus
it is necessary to define the term that I used for this review. I defined overdiagnosis as the
diagnosis by screening of a case of disease that would never have come to clinical attention had
overdiagnosed cases, leading to unnecessary adverse effects of treatment. I consider any
intervention that occurs after the initial overdiagnosis of the case by screening overtreatment.
For example, although a prostate biopsy is technically a diagnostic test, for the purposes ofthis
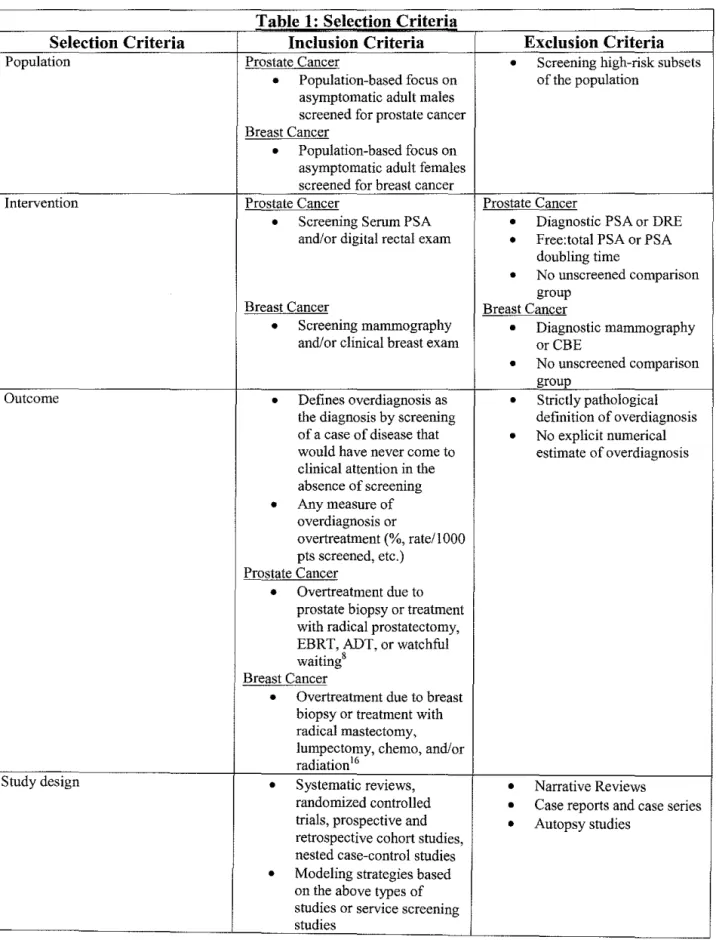
review, a biopsy of an overdiagnosed case is considered overtreatment. I defined the population,
interventions, and outcomes of this review and developed the list of questions noted above to
Table 1: Selection Criteria
Selection Criteria Inclusion Criteria Exclusion Criteria
Population Prostate Cancer
•
Screening high-risk subsets•
Population-based focus on of the population asymptomatic adult malesscreened for prostate cancer Breast Cancer
•
Population-based focus on asymptomatic adult females screened for breast cancerIntervention Prostate Cancer Prostate Cancer
•
Screening Serum PSA•
Diagnostic PSA or DRE and/or digital rectal exam•
Free:total PSA or PSAdoubling time
•
No unscreened comparison groupBreast Cancer Breast Cancer
•
Screening mammography•
Diagnostic mammography and/or clinical breast exam orCBE•
No unscreened comparison groupOutcome
•
Defines overdiagnosis as•
Strictly pathologicalthe diagnosis by screening definition of overdiagnosis of a case of disease that
•
No explicit numerical would have never come to estimate of overdiagnosis clinical attention in theabsence of screening
•
Any measure of overdiagnosis orovertreatment (%, rate/1000 pts screened, etc.)
Prostate Cancer
•
Overtreatment due to prostate biopsy or treatment with radical prostatectomy, EBRT, ADT, or watchful waiting8Breast Cancer
•
Overtreatment due to breast biopsy or treatment with radical mastectomy, lumpectomy, chemo, and/or radiation16Study design
•
Systematic reviews,•
Narrative Reviewsrandomized controlled
•
Case reports and case series trials, prospective andretrospective cohort studies,
•
Autopsy studies
nested case-control studies
Search Strategy
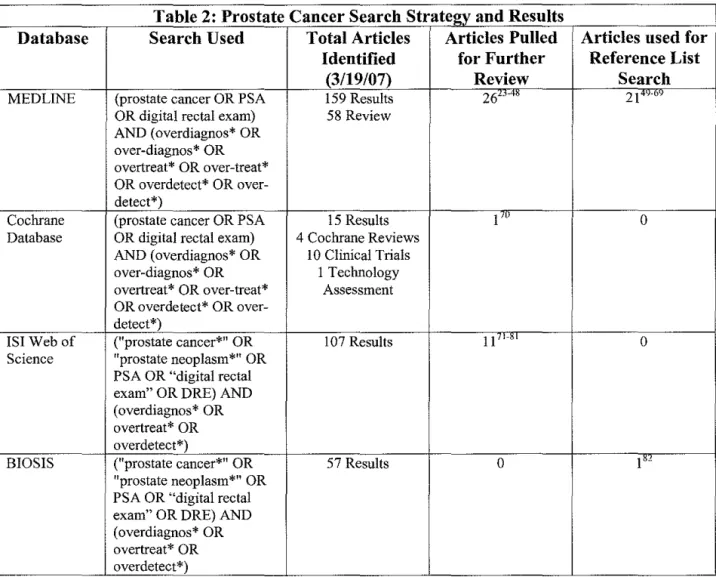
After developing the questions and criteria noted above, I formulated a search strategy
using key search terms. I searched MEDLINE, the Cochrane Database, BIOS IS, and IS! Web of
Science using the searches outlined in Tables 2 and 3 and reviewed the titles and abstracts of all
English-language articles or translations. I pulled the articles which had a chance to fit the
search criteria from the abstract list and read the full-text of these articles to further analyze them
for possible inclusion. A second, independent reviewer read all titles and abstracts that I felt did
not meet search criteria and pulled any remaining articles that he felt had a chance to meet the
search criteria. In addition, I reviewed the reference lists of relevant review articles identified in
the database search, the references of articles that were pulled in the database search, and the
references of the National Cancer Institute's Physician Query Database (PDQ) summaries on
cancer screening, breast cancer screening, and prostate cancer screening. I accessed the full-text
of any articles identified in this way and read the articles in depth to assess whether they fit
inclusion criteria. Figure 2 shows a flow chart of the inclusion process for prostate cancer
studies, and Appendix I includes reasons for exclusion of pulled prostate cancer studies. Figure
3 shows a flow chart of the inclusion process for breast cancer studies, and Appendix 2 includes
Table 2: Prostate Cancer Search Strategy and Results
Database Search Used Total Articles Articles Pulled Articles used for
Identified for Further Reference List
(3/19/07) Review Search
MEDLINE (prostate cancer OR PSA 159 Results 26"~' 21 .,_,
OR digital rectal exam) 58 Review
AND ( overdiagnos* OR
over-diagnos* OR
overtreat* OR over-treat*
OR overdetect* OR over-detect*)
Cochrane (prostate cancer OR PSA 15 Results I'" 0
Database OR digital rectal exam) 4 Cochrane Reviews
AND (overdiagnos* OR I 0 Clinical Trials
over-diagnos* OR I Teclrnology
overtreat* OR over-treat* Assessment OR overdetect* OR
over-detect*)
lSI Web of ("prostate cancer*11
OR 107 Results II,_, 0
Science "prostate neoplasm*" OR
PSA OR "digital rectal exam" OR DRE) AND ( overdiagnos* OR overtreat* OR overdetect*)
BIOS IS ("prostate cancer*" OR 57 Results 0 I"
11
prostate neoplasm*" OR
PSA OR "digital rectal exam" OR DRE) AND ( overdiagnos* OR
overtreat* OR
Table 3: Breast Cancer Search Strategy and Results
Database Search Used Total Articles Articles Pulled Articles used for
Identified for Further Reference List
(3/19/07) Review Search
MEDLIN£ (breast cancer OR breast 229 Results 34'· "· . ,_,.,, 9"'· '"'" cancers OR mammogra* 58 Review
OR clinical breast exam) AND (overdiagnos* OR over-diagnos* OR overtreat* OR
over-treat* OR overdetect* OR over-detect*)
Cochrane (breast cancer OR breast 32 Results 5'"'"" 0
Database cancers OR mammogra* 9 Cochrane Reviews OR clinical breast exam) 2 Other Reviews AND (overdiagnos* OR I 0 Clinical Trials over-diagnos* OR 4 Methods Studies
overtreat* OR 2 Technology
over-treat* OR overdetect* Assessments
OR over-detect*) 5 Economic
Evaluations
IS! Web of (11breast cancer*" OR 129 Results 8 "'''·" 0
Science "breast neoplasm*" OR
rnammogra* OR "clinical breast exam" OR CBE) AND ( overdiagnos* OR overtreat* OR overdetect*)
BIOS IS ("breast cancer*" OR 69 Results 4 ,, ... ,
I''"
11
breast neoplasm*" OR mammogra* OR
11
Figure 2: Flow Chart of Prostate Cancer Search and Inclusion
339 Total Prostate Cancer Abstracts
/
~
159MEDLINE 15 Cochrane 1071SI Web of
abstracts abstracts Science abstracts
l
l
All Unique 7 Unique from 43 Unique from
Studies MEDLINE MEDLINE&
Cochrane
t
t
26 Studies I Study Pulled 11 Studies
Pulled Pulled
l
l
10 Studies 0 Studies 0 Studies
Included* Included Included
:::::---
..---::::
10 Studies Included For Reviewt
*See Appendix 1 for reasons for exclusion of pulled studies tNo relevant studies were identified in reference list search
---
58 BIOSISabstracts
l
6 Unique from MEDLINE, Cochrane, & lSI
t
0 Studies Pulled
l
0 StudiesIncluded
Figure 3: Flow Chart of Breast Cancer Search aud Inclusion
459 Total Breast Cancer Abstracts
7
~----229MEDLINE 32 Cochrane 129 lSI Web of 69 BIOSIS
abstracts abstracts Science abstracts abstracts
l
l
All Unique 21 Unique from 46 Unique from 13 Unique from
Studies MEDLINE MEDLINE& MEDLINE,
Cochrane Cochrane, & lSI
l
l
34 Studies 5 Studies Pulled 8 Studies Pulled 4 Studies Pulled
Pulled
l
l
II Studies 0 Studies 0 Studies 0 Studies
Included* Included Included Included
~ ~
II Studies Included For Reviewt
*See Appendix 2 for reasons for exclusion of pulled studies
t No relevant studies were identified in reference list search
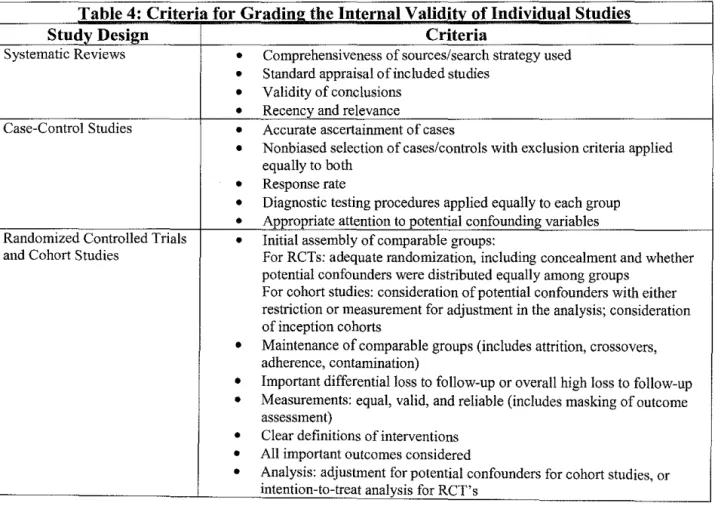
Quality Assessment
The quality of studies was largely assessed using the U.S. Preventive Services Task force
criteria in Table 4.140 However, because there were a number of modeling studies included in the
analysis, it was necessary to develop criteria with which to assess the internal validity of these
studies (Table 5). For modeling studies which used data from previous studies, the quality of
both the modeling process and the study whose data the model used was assessed. In addition,
external validity was assessed using USPSTF defined criteria by examining studies for biologic
plausibility, similarity between the population in the study and primary care patients, similarity
of the intervention used to the screening intervention commonly used in clinical practice, and
clinical or social environmental circumstances that could give different results than those that
would be expected in a primary care environment.
Table 4: Criteria for Grading the Internal Validity of Individual Studies
Study Design Criteria
Systematic Reviews
•
Comprehensiveness of sources/search strategy used•
Standard appraisal of included studies•
Validity of conclusions•
Recency and relevanceCase-Control Studies
•
Accurate ascertainment of cases•
Nonbiased selection of cases/controls with exclusion criteria appliedequally to both
•
Response rate•
Diagnostic testing procedures applied equally to each group•
Appropriate attention to potential confounding variablesRandomized Controlled Trials
•
Initial assembly of comparable groups:and Cohort Studies For RCTs: adequate randomization, including concealment and whether
potential confounders were distributed equally among groups
For cohort studies: consideration of potential confounders with either
restriction or measurement for adjustment in the analysis; consideration
of inception cohorts
•
Maintenance of comparable groups (includes attrition, crossovers,adherence, contamination)
•
Important differential loss to follow-up or overall high loss to follow-up•
Measurements: equal, valid, and reliable (includes masking of outcomeassessment)
•
Clear definitions of interventions•
All important outcomes consideredTable 5: Criteria for Gradin2 the Internal Validitv of Overdia1mosis Modelin2 Studies
Type of Study Criteria
Modeling based on RCT,
•
Data used for modeling comes from high quality studies based on Table 3cohort, or service screen data criteria
•
All relevant variables should be included in the model•
Estimates for model parameters come from quality studies (lead time,transition probabilities in Markov models)
•
Follow-up should be long enough to outlast the prevalence peak due tolead time
•
Comparison groups should be applicable and as similar to theintervention group as possible for service screening modeling
•
Contamination of the comparison group should be minimal•
Authors should discuss the role oflead time and the impossibility ofcompletely distinguishing it from overdiagnosis
•
A probabilistic sensitivity analysis should be performed to assess theeffects of varying different parameters, including lead time
Data Extraction
Studies that were included after the initial search were reviewed in more depth to
determine whether they fit all inclusion criteria. Data from each study was extracted into a
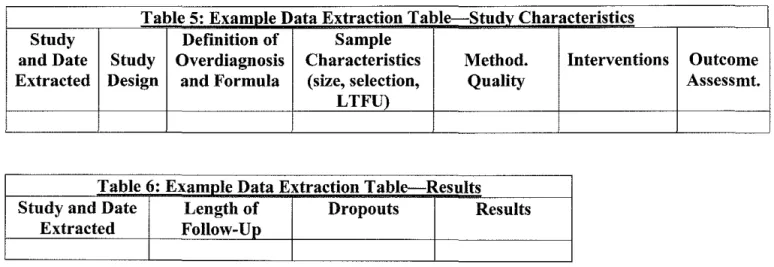
standard table to allow for easy comparison with inclusion criteria (Tables 5 and 6). In addition,
the adherence of each study to the above quality criteria was assessed during the data extraction
process.
Table 5: Examnle Data Extraction Table--Studv Characteristics
Study Definition of Sample
and Date Study Overdiagnosis Characteristics Method. Interventions Outcome
Extracted Design and Formula (size, selection, Quality Assessmt.
LTFU)
Table 6: Examnle Data Extraction Table--Results
Study and Date Length of Dropouts Results
Data Synthesis
Data synthesis was performed primarily in a descriptive manner, without the use of
quantitative methods because heterogeneity of outcomes prevented the use of this modality. By
qualitatively examining the heterogeneity of the results, it was possible to come to some
conclusions about overdiagnosis and overtreatment. In addition, the quality of the studies and
some of their resulting limitations were noted. Although some of the smaller databases and
reference lists were searched for full-text articles, publication bias is still a concern as it is with
any systematic review.
Results
Prostate Cancer
Study Selection
Of the 38 prostate cancer articles in Table 2 that were pulled from the literature search for
further review, I 0 articles fulfilled all selection criteria?5• 28• 30• 33-35• 38· 41· 43· 45• 141• 142 See
appendix 1 for a reasons for inclusion and exclusion of studies. If a study was borderline for
fulfilling selection criteria, it was left in the review. Five of the included studies are models
validated by prostate cancer incidence in the SEER database, 25• 33• 35• 41• 43 three are models based
on service screening programs,28· 34· 45 and two use the same Markov model validated by RCT
data.
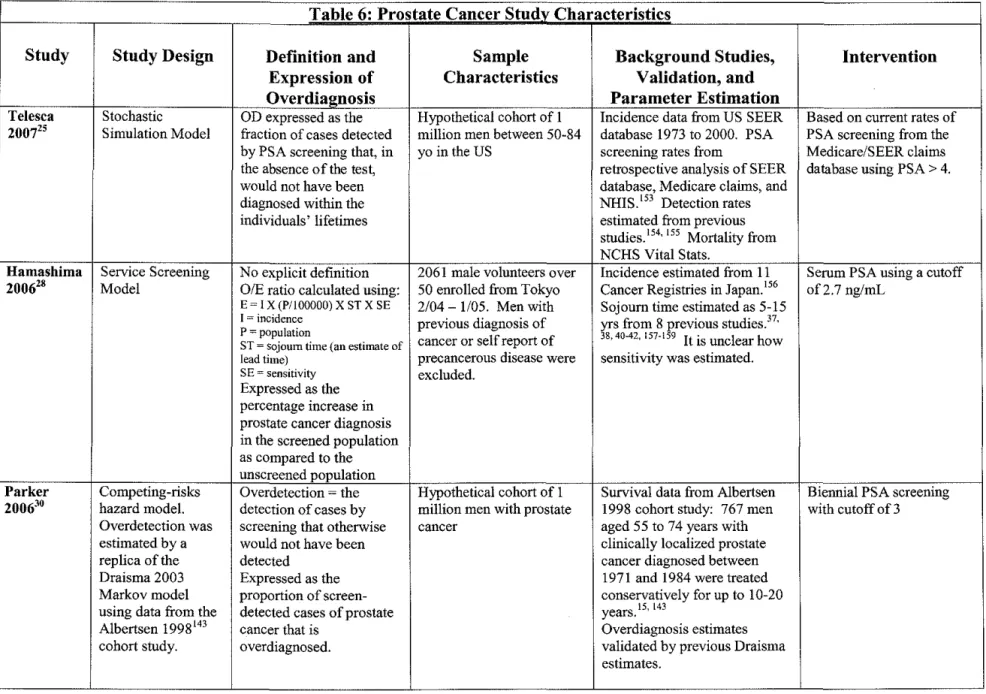
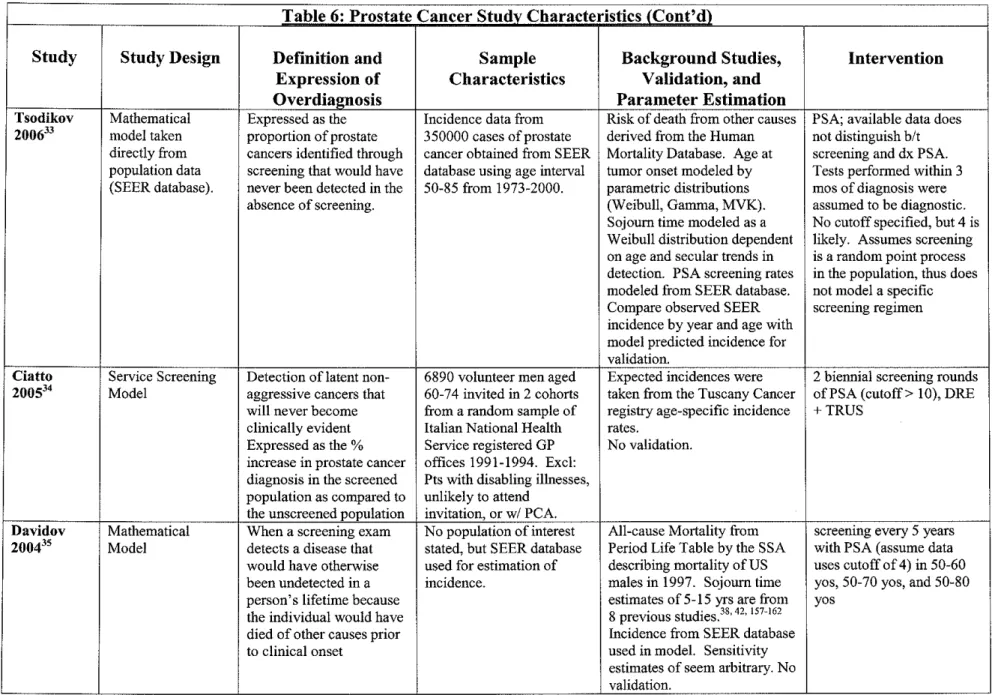
Three tables follow that give a general idea of the included studies. Table 6 lists specific
details on the characteristics of these studies, including study design, stated definition and
expression of overdiagnosis, sample characteristics, intervention, and length of follow up.
or were validated by other studies, it was necessary to include some information about these
underlying studies in table 6 as well. Table 7 reports the results of these studies in three ways:
as reported in the study, converted to overdiagnosed cases /1000 patients screened (if possible),
and converted to overdiagnosed cases /1000 cases diagnosed. Lastly, table 8 includes details
about the quality of the included studies.
Results
Overall, rates of overdiagnosis ranged from 8 to 99 per 1000 patients screened and 73 to
708 per I 000 patients with screen-detected prostate cancer and depended on the age at diagnosis,
race, Gleason score, or mean lead time estimate used in the study. It was not possible to estimate
the rate of overdiagnosis per 1000 patients screened for 5 of the studies due to insufficient data
reported in the studies.25• 30• 33• 35· 41 The quality of the studies was variable, but two of the studies
validated by SEER data were fair quality, one of the service screening studies was fair quality,
and the two studies validated by RCT data were particularly good quality.
Of the studies based on SEER data, Etzioni et al41 and Telesca et al25 had the best overall
study quality. Etzioni et al fit models separately for white and black patients, and found that for
black patients, the model fit better to incidence data using a mean lead time of 7 years, whereas
for white patients, the model fit better when it used a mean lead time of 5 years. This
corresponded to overdiagnosis rates of288 per 1000 white screen-detected patients and 438 per
I 000 black screen-detected patients. These rates varied slightly depending on what proportion of
PSA's the authors assumed were diagnostic versus screening. Telesca et al actually used the
same model as Etzioni et al, but used a likelihood model for secular trend in prostate cancer
incidence to model it concurrently with lead time. They found that overdiagnosis rates were
per 1000 black screen-detected patients. A caveat to these studies is that they do not model a
specific screening regimen; they model the rate of PSA screening between 1988 and 1998 based
on Medicare claims data and assume in the model that screening occurs at this baseline rate.
Other models using SEER incidence data as validation include Etzioni et a!, 43 Davidov et
a!,35 and Tsodikov et a1.33 Etzioni eta! found a similar overdiagnosis rate of247 per 1000
screen-detected stage Al cancers for annual PSA screening with a cutoff of 4, but expressed
overdiagnosis as a proportion of stage Al (low stage) cancers, which leaves out the potential for
overdiagnosis in high stage cancers. Rates were lower for less frequent screening and when
using age-specific PSA cutoffs. Davidov eta! found that rates for 50 to 70 year olds screened
with PSA (cutoff not stated) every 5 years had an overdiagnosis rate of 307 per 1000
screen-detected cases, assuming a lead time of 10 years. Rates were higher for longer sojourn times and
were also higher for wider age ranges screened. Tsodikov eta! found overdiagnosis rates of 100
to 500 cases depending on the age at which screening occurred. The authors in this study
assumed that screening was a random process; they did not model the impact of a specific
screening interval. The results are not reported in a useful format in this study; the values above
were extrapolated from a graph of overdiagnosis versus age.
The best quality model based on a service screening population was Ciatto et al,34 which
found the rates of overdiagnosis to be higher. Using two biennial screening rounds ofPSA with
a cutoff of 10, DRE and TRUS over 9 years of follow up, the authors estimated that
overdiagnosis would occur in 399 patients per every I 000 screen-detected cases and in 17
individuals per every 1000 patients screened. Other service screening models included Zappa et
al45 and Hamashima et al. 28 Zappa et a! found that for patients screened with biennial PSA with
cases and 6 patients per I 000 patients screened, assuming a 2% increase in baseline prostate
cancer incidence per year. Rates were higher if screening were started at age 65 and if the model
assumed a constant baseline incidence. Follow up of the patients in the service screening study
was only 4 years in this model. Hamashima eta! found that patients screened with one-time PSA
with a cutoff of 2. 7 had a rate of overdiagnosis of 708 cases per I 000 screen-detected cases and 8
per I 000 patients screened. However, this study only had a follow up of I year, thus much of the
increased incidence detected in the study is likely prevalent cases of prostate cancer. A problem
in all these screening studies is that they assume that all excess incidence occurs due to
overdiagnosed cases when there are undoubtedly some cases of prostate cancer that were caught
early by screening that would have presented clinically later. The longer the follow up in the
study, the less of a concern this is.
Two studies were based on a single model developed by Draisma et al,38 which validated
the model using both population level incidence data from The Netherlands in 1991 and data
from a randomized controlled trial that randomized over 42,000 patients to screening or no
screening and had 6 years offollow up data available. Draisma eta! found that for annual PSA
screening with a cutoff of3 of men 55-75, overdiagnosis rates were higher: 560 cases per I 000
screen-detected cases and 79 cases per I 000 men screened. Rates of overdiagnosis in this study
were lower for single screening, slightly lower for a smaller age range screened (55-67 year olds),
and slightly lower if using a four year screening interval instead of annual screening. Parker et
aeo used the same model to estimate overdiagnosis rates based on stage-specific detection rates
from a prospective cohort study of untreated or minimally treated prostate cancer.143 The authors
prostate cancer with a Gleason score of7. Rates of overdiagnosis were higher for lower Gleason
scores and lower for younger age groups screened.
Breast Cancer
Study Selection
Of the 51 breast cancer studies in Table 3 that were pulled from the literature search for
further review, II articles fulfilled all selection criteria.s, 28, 83, 86, 88, 89, 91, 99, 102, 107, 112, 135
Appendix 2 contains reasons for inclusion and exclusion of all studies. If a study was borderline
for fulfilling selection criteria, it was left in the review. Eight of the included studies are based
on population-based service screening programs28• 83· 88· 89· 99· 102• 107· 112 and three are based on
RCT data.5'86'91
Three tables follow that give a general idea of the included studies. Table 9 lists specific
details on the characteristics of these studies, including study design, stated definition and
expression of overdiagnosis, sample characteristics, intervention, and length of follow up. This
table also contains information about the analysis used to calculate overdiagnosis. Table 7
reports the results of these studies in three ways: as reported in the study, converted to
overdiagnosed cases I I 000 patients screened (if possible), and converted to overdiagnosed cases
I 1000 cases diagnosed. Lastly, table 8 includes details about the quality of the included studies.
Results
Overall, rates of breast cancer overdiagnosis ranged from 4 to 14 overdiagnosed cases per
1000 patients screened and 22 to 600 overdiagnosed cases per 1000 patients with breast cancer.
invasive and in situ cases were considered together or separately. It was not possible to estimate
the rate of overdiagnosis per 1000 patients screened for 8 of the studies due to insufficient data
reported in the studies. 83• 86• 89· 91· 99• 102• 107• 112 The quality of the studies was variable, with two of
the studies validated by SEER data were fair quality, one of the service screening studies was
fair quality, and the two studies validated by RCT data were particularly good quality.
Two of the studies based on service screen data, de Koning et al83 and Olsen et a!88 used
the same basic model of chronic disease progression 144 to calculate expected incidence and compare this to the observed incidence in the screened cohort. This model fits a Poisson
distribution to the data to estimate the values of parameters such as lead time, sensitivity,
incidence of preclinical screen detectable cancers, and incidence of overdiagnosed cancers using
predefined equations. De Koning et a! used 8 years of service screen data and found that 80
cases of breast cancer would be overdiagnosed per 1000 screen-detected cases of breast cancer.
Olsen et a! used 6 years of service screen data and found that 78 cases of breast cancer would be
overdiagnosed per 1000 screen-detected cases of breast cancer at the first screen.
Paci et a]89 also used a Poisson regression to model expected incidence based on service
screening data, but they took a different approach to modeling the effect oflead time. The
authors calculated the contribution oflead time to excess incidence found in the service
screening study by assuming an exponential distribution of lead times and using a model to
generate a separate lead time for each individually screened patient. The probabilities that these
cases would come to clinical detection each year after screen detection were summed to generate
the number of screen-detected cases that would have arisen clinically each year in the absence of
screening. The authors subtracted this number from the observed number of cases to correct for
the Poisson regression model. They found that 34 overdiagnosed cases would occur per I 000
breast cancers diagnosed. A similar, earlier model by Paci et al99 based on Florence service
screening data found that less that 50 overdiagnosed cases would occur per I 000 breast cancers
diagnosed.
Zahl et al1 02 is another model based on service screening data that uses Poisson regression to calculate expected age-specific incidence rates of breast cancer in the absence of screening.
The authors compare this to the observed incidence from the service screening data to generate
the excess incidence due to screening, which the authors assume to be all a result of
overdiagnosis. This model does not include an attempt to distinguish lead time from
overdiagnosis. The follow up in the model is 5 years in the Norway service screen and 15 years
for Swedish service screen. The authors found overdiagnosis rates of351 overdiagnosed cancers
per 1000 cases in Norway and 310 overdiagnosed cancers per 1000 cases in Sweden. Anttila et
al107 used similar methods for a cohort of women in Helsinki, Finland with 8.5-11.5 years of
follow up and found that approximately 150 overdiagnosed cancers occurred for every 1000
breast cancer cases. Peeters et al112 also used similar methods for a screened cohort in The Netherlands and found that 99 overdiagnosed cases occurred per 1000 breast cancer cases
diagnosed. Hamashima et al28 was a low quality study that found an excess incidence of 600 cases per every 1000 screen detected cancers after only one year of follow up in a small Japanese
screened cohort.
The studies based on RCT data also differed from each other in methods and results.
screened group as compared to the control group. After 7-9 years of follow up, the authors
found an excess incidence of approximately 230 cases per I 000 cancers diagnosed in the two
trials, which they assumed was all a result of overdiagnosis. Zackrisson et al91 performed a similar analysis with longer follow up: I 0 years of trial data and 15 years of follow up past the
end of the trial. They found an excess incidence of just 91 cases per 1000 cancers diagnosed,
which they assumed was all due to overdiagnosis.
Duffy et a15 used RCT data in a Poisson regression to model the expected incidence, and they used the model of Day and colleagues144 (the same model used in de Koning et al and Olsen
et al above) to estimate the values for lead time, sensitivity, and incidence of screen-detectable
and overdiagnosed cancers. Taking these parameters into account, they found a rate of
overdiagnosis at the first screen of 32 cases per I 000 screen-detected cancers in the Swedish
Two County Trial and 42 cases per 1000 screen-detected cancers in the Gothenburg Trial. Thus,
after taking lead time into account, estimates of overdiagnosis are less than in the studies above
that did not take lead time into account in the model, even in studies with longer follow ups such
as Zackrisson et a!.
Discussion
Overdiagnosis in Prostate Cancer Screening
Thus, for prostate cancer, estimates of overdiagnosis from the highest quality studies
noted above range from 227 to 560 overdiagnosed cases per 1000 screen-detected cases of
prostate cancer. This does not take into account the very high rates of overdiagnosis found by
Parker et al for patients over 65 years of age with Gleason scores of7 or less-up to 766
overdiagnosis include black race (due to longer lead time), lower Gleason score, and wider and
older age ranges screened. More frequent screening, i.e. a shorter screening interval, was
associated with a slightly increased rate of overdiagnosis in some studies. In addition, using
higher mean lead time values and assuming a constant or declining secular trend in incidence
were associated with higher rates of overdiagnosis in these studies. The two higher quality
studies for which overdiagnosed cases per 1000 patients screened could be estimated had
overdiagnosis rates of 17 and 79 cases per patient screened. The PSA cutoffs used in these
studies differed widely, with a cutoff of 10 in Ciatto et a! and a cutoff of 3 in Draisma et a!. This
difference could lead to the lower overdiagnosis rates in the Ciatto study due to the detection of
larger, more advanced cancers that would have both secreted more PSA and been more likely to
present clinically.
The studies had a great deal of heterogeneity in many baseline characteristics, including
intervention modeled in the study. All studies modeled PSA, yet the screening interval and
cutoff for the test varied widely between studies. Three studies did not choose a specific
screening interval to model as the intervention; these studies estimated current PSA screening
rates from a linkage between the SEER database and Medicare claims and thus modeled the
current screening situation. However, when doing this, difficulties arose distinguishing between
screening PSA's and diagnostic PSA's from the database. Some of the studies introduced
parameters to help control for this. For example, Etzioni et a!41 incorporated a parameter "p" representing the proportion of all PSA -associated cases (cases of prostate cancer diagnosed
within 3 months of a PSA test) that were screen-detected. They performed a sensitivity analysis
using high, moderate and low values for p, and found that the difference in overdiagnosis using
screen-detected cancer, but tended to favor slightly increased overdiagnosis rates for low values for p.
Other studies, including Draisma et a!, modeled multiple interventions. Four studies modeled
some type of biennial PSA screening; one of these used a cutoff of 10, two of these used a cutoff
of 4, and the other used a cutoff of 3. Two studies modeled screening every 5 years and two
modeled screening every 4 years. In addition, one study modeled PSA screening using an
age-specific cutoff defined in a previous study.147 Thus, a great deal of heterogeneity is present in
intervention modeled that makes it difficult to analyze study results.
In addition, the age distribution of the population of interest varied a great deal between
the studies. Some of the age ranges modeled in these studies include all men over 50, men 50-84,
men 55-74, men 60-74, men over age 55, men 60-84, men 30 to 95, men over age 60, and men
over age 65. Overall, indications are that for higher age screened, the rates of corresponding
overdiagnosis are also higher, which makes sense given the increasing risk of dying of a
comorbid condition with increasing age. Some studies, such as Parker et a130 and Draisma et
al,38 modeled multiple different age groups of interest and found that older patients did in general
have higher overdiagnosis rates than younger patients.
The overall quality of the modeling studies varied, as seen in table 8. The internal
validity of modeling studies depends on a number of factors, including completeness of the
model, accuracy of parameters, similarity of comparison groups, assumptions, and length of
follow up. All modeling studies make assumptions when combining different parameters in the
study, and some ofthese modeling studies made more assumptions than others. Length of
follow up is an important factor for studies based on service screening cohorts that affects the
internal validity of these studies. The longer the length of follow up, the less likely any excess
One of the most common assumptions made was that the distribution of lead times in a
given population followed a given distribution, such as an exponential distribution. It is not
possible to know with certainty what the distribution oflead times is in a given population for
prostate cancer because the data is not there. More aggressive cancers will have short lead times
and less aggressive cancers will have longer lead times, but we cannot whether the distribution of
these lead times is normal, exponential, bimodal, or skewed. It is more likely that the
distribution oflead times does not follow a defined type of distribution. Studies that do not
assume that lead time follows a specific distribution do not take it into account at all, and thus
the quality of their estimate is highly dependent on length offollow up. Another common
assumption was that parameters used in the study could be generalized to one another in one
model even though they were determined in different populations. Finally, many models assume
that the all-cause mortality in patients with screen-detected prostate cancer is similar enough to
that of the population as a whole to use census mortality rates when generating date of death.
Follow up and contamination were two major quality issues in the studies based on
service screening populations. Hamashima eta! had follow up of I year and Ciatto et a! had
follow up of 9 years. Zappa et a! had follow up of 4 years in the screened population, but
modeled 14 years worth of follow up. When calculating an observed to expected incidence ratio
in these studies based on service screening data, it is important that the cohort used to estimate
the expected incidence is both similar to the observed cohort and free of contamination by
opportunistic screening. Zappa et a! calculated expected incidence based on age specific
mortality rates from the Tuscany Cancer Registry in 1990-1991, a period in which they say
screening was negligible. However, they offer no data to back up this claim. Ciatto et a!
Registry during the period of screening (1991-1994), a period in which they say screening was
negligible. They mention that the screened cohort actually made up 3 percent of the individuals
in the Tuscany Cancer Registry. Thus, 3 percent of the individuals in the expected group were
contaminated by screening, and so overdiagnosis may be slightly underestimated in this study.
In Hamashima et a!, the expected incidence is calculated from incidence rates in 11 Japanese
cancer registries. The authors do not mention the potential for opportunistic screening of these
patients, thus the risk of contamination in this group is high.
The generalizability of these studies was greater in studies validated by population level
data such as the SEER database because they were based on a wider spectrum of individuals, but
some internal validity is sacrificed without validating the model against a randomized controlled
trial or controlled cohort study. Generalizability suffers when patients were excluded from
validation studies because of exclusion criteria or a narrow age range for screening. Studies that
modeled blacks and whites separately have better external validity to these specific populations
than those that modeled all races together.
Implications for Overtreatment of Prostate Cancer
The results of these modeling studies indicate that approximately 23 to 56% of all
screen-detected prostate cancer cases will be overdiagnosed in a population-based screening program.
Rates are higher in older patients and those with low stage disease. Overdiagnosed patients will
be likely to undergo further diagnostic testing, including prostate biopsy, and also treatment.
Little data exists about the proportion of overdiagnosed patients who are treated, but data does
exist that focuses on the treatment of prostate cancer by stage and grade. It is difficult to
estimate the likelihood of treatment of overdiagnosed cases because overdiagnosed individuals
commonly lower risk cancers because they have longer lead times during which patients may die
of comorbid conditions. Studies show that 76-85% of screen-detected cases are Gleason score<
7, the patients at greatest risk for overdiagnosis. 30 It would make sense for treatment patterns to
be more conservative in patients with low-risk cancers because it is less likely that they will die
of their prostate cancer. However, current data suggests that this is likely not the case.
A retrospective cohort study based on the SEER registry estimated the proportion of men
with "lower-risk" prostate cancers who were overtreated, assuming that any treatment other than
expectant management was overtreatment.29 They defined "lower risk" as men with Gleason
score 2-4 cancers or men over 70 years old with Gleason score 5-7 cancers. The authors found
that I 0 percent of 24,825 men with low risk cancers were overtreated with surgery and 45% of
the men were overtreated with radiation therapy. This does not take into account the men who
may have been treated unnecessarily with androgen deprivation therapy. The CaPSURE study, a
survey of over 8,000 men with biopsy-proven prostate cancer, found that of the approximately
5,000 men with localized disease, only 5.5 percent of them claimed watchful waiting as primary
disease management from 1998 to 2000.148 This proportion had actually declined from 7.5% in 1989-1991 and 9.5% in 1992-1994. The authors defined localized disease as clinical stage T3a
or less with no evidence oflymph node involvement or metastasis. The results of the CaP SURE
study indicate that as the likelihood of active treatment for prostate cancer increased throughout
the 1990s, which is the same time period during which the introduction of PSA screening
occurred. From 1999 to 2001, the authors found that radical treatment occurred in 77.5%, 75.8%,
and 47% oflow-, intermediate-, and high-risk patients, respectively. Thus, low risk patients
Bill-Axelson et al149 performed a randomized controlled trial directly comparing radical
prostatectomy and watchful waiting in 695 men under 75 years of age with a life expectancy of
I 0 years with newly diagnosed stage Tl b, Tl, or T2 cancers. The authors found that fewer men
died in the surgery group than in the watchful waiting group (30 vs 50; p = 0.01). However, this
study excludes individuals at highest risk of overdiagnosis by excluding men over 65 and those
with a life expectancy ofless than I 0 years. In addition, the authors found that men over 65
years of age had a lower cumulative incidence of prostate cancer specific death. Parker et al30
used data from a 15 year cohort study of patients with conservatively treated prostate cancer143 in
a model to estimate the effect of radical treatment on survival. They included in their model an
estimate of overdiagnosis in these patients based on the model used by Draisma et al as well as
the hazard ratio from Biii-Axelson et al. They found that survival benefit was greatest in patients
with high grade disease, which conflicts with the current patterns of care from the CaPSURE
study. Thus patients with lower grade disease seem to be at high risk for invasive treatment with
little survival benefit, placing them at high risk of overtreatment.
Significant side effects can occur as the result of treatment for prostate cancer, including
impotence, urinary incontinence, and pain. These problems occur more often in older patients,
thus many overdiagnosed patients are at higher risk of treatment-related adverse effects. The
Prostate Cancer Outcomes Study150 found that older men were more likely to have high levels of
incontinence after surgery(l4% of75-79 year olds as compared to 0.7-4% of younger men). In
addition, men over the age of 60 were more likely to have problems with impotence after surgery
than younger men (78-85% vs. 61 %). Similar problems can occur after external beam
Active surveillance is one treatment option for patients with low risk cancers that could
help limit the extent of overtreatment and adverse effects. Active surveillance is an expectant
management protocol with frequent monitoring of PSA doubling time, velocity, or amplitude
and symptomatology with the option of curative therapy should progression occur. Some
algorithms include repeat biopsies of the prostate to monitor progression. Active surveillance is
inherently a more proactive approach than watchful waiting because patients are monitored so
closely with biochemical and clinical parameters. An example of an active surveillance protocol,
developed by Choo eta!, 151 stated the criteria for progression as a PSA doubling time< 2 years based on 3 separate measurements over 6 months, a final PSA > 8 or a Gleason score > 7 on
repeat biopsy of the prostate at 12-18 months. In addition, patients were considered to progress
if they had an increase of more than double of the maximum perpendicular diameters of the
lesion, local progression requiring TURP, ureteric obstruction, or evidence of metastases. Active
surveillance protocols are one way in which treatment can be tailored to the clinical situation in
individual patients to avoid overtreatment.
Thus according to current estimates, up to 56% of prostate cancers seem to be
overdiagnosed, with higher rates of overdiagnosis in older patients and those with low stage
disease, the same patients who seem to be at greatest risk for overtreatment according to the
results of the above studies. Thus the risk of overdiagnosis and overtreatment of screen-detected
prostate cancer are high. In addition, the risk of side effects from treatment is highest in older
patients who are at greater risk of overdiagnosis due to comorbidities.
Yet problems with study quality, including lead time distribution assumptions and other
assumptions inherent to the modeling process, limit estimates of overdiagnosis. Even the highest
vs. diagnostic PSA tests. Without high quality randomized controlled trial data with lengthy
follow up, it is difficult to assess the true amount of overdiagnosis that occurs. In addition, it is
extremely difficult to assess to what extent overtreatrnent occurs in these patients without
following them on an individual basis for a long period of time, which would likely require 15 or
20 years of follow up. The ongoing European Randomized Study of Screening for Prostate
Cancer (ERSPC) and the U.S. National Cancer Institute "Prostate, Lung, Colorectal, and Ovary"
Trial (PLCO) will eventually provide a much better estimate of the true amount of overdiagnosis.
Until then, it is likely that prostate cancer screening with PSA leads to a substantial proportion of
overdiagnosed cases, with our best estimates at 23 to 56% of all screen-detected cancers, with
higher rates for older patients and low stage cancers. Active surveillance is a good option for
patients with low stage disease to avoid overtreatrnent.
Overdiagnosis in Breast Cancer Screening
Estimates of overdiagnosis in breast cancer screening were highly dependent on whether
the study included a method to adjust for lead time and test sensitivity. The studies which did
adjust for lead time5• 83• 88• 89· 135 found rates of overdiagnosis ranging from 31 cases per I 000
cases of breast cancer to 80 cases per 1000 cases of breast cancer. One of these studies based its
model on randomized controlled trial data and the other four based their models on service
screening data. Studies which did not adjust for lead time86• 91• 102• 107 found higher overdiagnosis
rates, ranging from 91 cases per 1000 cases of breast cancer to 351 cases per 1000 cases ofbreast
cancer. Two ofthese studies based their models on RCT data, and the other two studies based
their models on service screening data. I excluded two studies28• 112 from the above analysis due
The highest quality studies, Zackrisson et al91 and Gotzsche et al, 86 were based on
randomized controlled data and neither of these studies included a measure with which to adjust
for lead time. Zackrisson et a! found an overdiagnosis rate of 99 per 1000 patients screened, and
Gotzsche et a! found a higher rate of 230 per I 000 patients screened. Zackrisson eta! followed
patients for 15 years after the end of the Malmo trial, whereas follow up in the studies analyzed
by Gotzsche et a! ranged from 7 to 9 years. The longer follow up in the Zackrisson study may
help eliminate some cases of breast cancer that are contributing to excess incidence due to lead
time. However, the Zackrisson trial also assumes that no 55-69 year old women in the control
group received mammography after the end of the trial, which certainly leads to an
underestimation of overdiagnosis rates. The shorter follow up in the Gotzsche study is
concerning in that some cases of breast cancer, particularly DCIS, may still be cases that were
destined to present clinically, even after 7-9 years of follow up. The Gotzsche estimate also has
potential for contamination in the control group that may lead to an underestimation of
overdiagnosis rates. A random sample of 500 women in the Malmo trial control group found a
contamination rate of 24 percent during the trial. Contamination is difficult to avoid in these
studies due to the widespread use of mammography by the time many of the trials were
conducted.
Studies which incorporate methods of adjusting for lead time found lower rates of
overdiagnosis than the above studies. Duffy et al,5 de Koning et a!,83 and Olsen et a!88 used the
model of Day and colleagues to adjust for lead time in their estimates of overdiagnosis. Duffy et
a! was based on two randomized controlled trials and de Koning eta! and Olsen et a! were based
on service screening data. Rates of overdiagnosis were lower in these studies, ranging from 31
assumptions needed in the model to adjust for lead time. Similar to many of the prostate cancer
models, this model assumes an exponential distribution of lead times in the study population. It
is not possible to define the distribution of lead times in the population, and assuming a specific
distribution oflead times may lead to an underestimation of overdiagnosis if the distribution of
lead times is more bimodal, with a high proportion of both short and long lead times. Patients
with longer lead times would be more at risk of overdiagnosis.
The two studies by Paci et a!89• 135 also include methods for adjusting for lead time. Yet
these studies also assume an exponential distribution oflead times with mean lead time durations
of3.4 years in the 2004 study and 3.7 or 4.2 years in the 2006 study, depending on the patient
age. In addition, these studies are based on service screening populations for which the potential
for contamination in the "prescreening" group from which the authors estimated expected
incidence remains unclear. All studies based on service screening populations also assume that
predicted trends in incidence can be estimated from prescreening data, when in fact external
forces such as the increasing use of hormone replacement therapy, may have led to an increase in
breast cancer diagnosis rates independent of screening.
Zahl et al102 used service screening data to estimate overdiagnosis rates without adjusting for lead time and found rates of 310 overdiagnosed cases per I 000 breast cancer cases in Sweden
and 351 overdiagnosed cases per 1000 breast cancer cases in Norway. Follow up was 5 years for
Norway and 10 years in Sweden, which may still be somewhat short in order to avoid the effect
oflead time on excess incidence. In addition, the authors assume that there is no baseline
increase in breast cancer incidence rates due to factors other than screening, and thus assume that
all excess incidence is a direct result of overdiagnosis. In addition, increased reporting of breast
The authors do not discuss the potential for contamination and do not include DCIS in their study,
which could both lead to an underestimation of overdiagnosis rates. Similar to the other service
screening studies above, the multiple assumptions used in this study make it difficult to figure
out what the results mean.
Differences in the study characteristics within the different included studies also make it
difficult to generalize the study results to a specific population. Different study populations and
different interventions were used in the studies. All of the studies included some type of
mammography screening, but screening intervals varied. Some studies included 2 view
mammography, some included one view mammography, and others did not specify what type of
mammography they used in the study. Many studies modeled biennial mammography, but some
studies used annual mammography, and one study used mammography every 18 to 24 months.
In addition, the age intervals screened differed between the studies. Screening began at age 50 in
five studies, at age 45 in two studies, at age 40 in four studies, and at age 35 in one study. Most
studies stopped screening women at age 69, but a few studies continued to screen women until
age 7 4 or 79. These studies would be expected to show higher rates of overdiagnosis because of
the higher risk of comorbid disease in elderly women.
Generalizability of the studies is most likely better in the more population-based service
screening studies because they patients were not excluded like they were in some of the
randomized controlled trial data. However, the women in these studies are volunteers who are
inherently different in unknown ways from the population as a whole. In addition, most of the
service screening studies were conducted in fairly small countries with ethnically uniform
populations, and thus their results may not be generalizable to more diverse populations such as
Implications for Overtreatment of Breast Cancer
The highest quality study above86 concluded that overdiagnosis occurred in about 23% of
all screen-detected cases of breast cancer. Other estimates of overdiagnosis are as low as 3
percent when adjustment for lead time occurs. However, the amount of contamination in these
studies is unknown, and increases in the baseline incidence of breast cancer by causes other than
screening are not always accounted for. Thus, overdiagnosis is likely a significant problem for
breast cancer screening with mammography, and even more of a problem for DCIS due to its
longer lead time. This problem is compounded by the high proportion of women with breast
cancer treated invasively, which places many overdiagnosed women at substantial risk for
overtreatment.
The primary treatment options for breast cancer include lumpectomy, lumpectomy with
radiation, and mastectomy. Unlike prostate cancer, watchful waiting has historically not been an
option for women with breast cancer. In 1999, over 28% of women with DCIS had mastectomy,
64% had lumpectomy, and 33% had radiation.Z2 Thus, there is potential for a substantial amount of overtreatment as a result ofDCIS. Ernster eta! performed a retrospective study of over
540,000 women who underwent mammography and found that 18 percent of screen-detected
cancers were cases ofDCIS.18 Although none of the included studies above specifically modeled the rate of overdiagnosis of DCIS alone, one study that modeled the incidence of
non-progressive and non-progressive DCIS using incidence data from the Swedish Two County
randomized controlled trial and multiple service screening programs found that 37% ofDCIS
cases detected by screening were nonprogressive.106 The authors defined nonprogressive DCIS as having no propensity to progress to invasive disease during the lifetime of the host. They