#
ABSTOACT
IVjenty preschool children feom the Frank Porter Graham Child Care Center, and their mothers, were mcxiitored for NO. e}^x3sure in their hemes emd at the day care center. Subjects were noiitored for one week during the summer and winter moiths losing Bendix 8101 Oxides of Nitrogen Anedyzers and Palmes passive mcnitors. In-4icme staticxiary Palmes tubes are very accurate compared to
2 . .
chemilximinescent mcaiitors (R =0.97). C3ieamlvnmnescent monitors and Palmes tubes worn by subjects do not give the same measurement of of persoial NO.
2 ...
e}q)osure (R =0.83), presumably because it is not possible for a stationary mentor to estimate personal exposure as well as Palmes tubes do. Mean winter
NO2 levels in hemes with kerosene space heaters varied widely (71.4 ±73.2 ppb),
but were more than 2 times the levels found in homes with gas stoves(26.5 ±14.2 ppb) and ten times the levels of hemes without confcustion sources (4.6 ±3.2 ppb). Clinical, epidemiological, and toxicological evidence suggest that peak short-term levels are more iitportant than Icaig-term averages in determining human health effects. Ccaitinucus monitoring data indicate that
ocmbustion appliances caused peak NO^ levels of 100 ppb or more during 9 of the
40 monitoring-weeks in this stucfy. Regression analysis suggests that peak values contributed more significantly to a mother's net ej^xjsure than to her child's (P < 0.05).In ccKiclusion Palmes tubes provide an accurate and ccaivenient measure of net perscxial e>$>osure to NO.. Average ejqxDsure, hcwever, is not the best
indicator of indoor NO- levels vAiich may have significant heeilth iinpacts.
Increased venting and iirproved ccnbusticxi appliance technology provides the most feasible alternative for lowering.in-4ieme es^xisure to NO-.
Table of Oaitents
Adkncwledgments
IntroducticMi I^e
Studies Measuring Indoor NO Levels... 1
Fhysical/Cheanical Properties of NQj... 3
Levels: Outdoor and Indoor NO... 5
Sources of NO2... 7
Literature Review Health Effects of NO... 8
Ocaitrolled Rniian Esiposure Studies... 9
HuDDoan Epidemiology Studies... 11
Animal Studies... 15
Health Effects Summary... 18
jt^terials and Methods Stuc^ Population... 20
NO Monitoring Techniques... 21
CSontinuous Monitors... 21
I^ssive Monitors... 22
E2jposure Assessment... 25
Data Analysis... 26
OcMTtinucus Monitor Quality Assurance... 26
Results (Tables 4 through 6 and Figures 1 throu^ 4)... 28
Discussicsi Palmes Tube Reliability and Personal MMiitoring... 36
E3^x3sure Assessment... 37
Sources of Bias... 38
Reccnmendatics^ Methods of Reducing NO Exposure... 39
Policy Implications... 41
Aaa«}WIEDCMSNTS
This project was funded by the U.S. Environmental Protection Agency and the Consumer Product Safety Ccnmissicai. I wish to thank Dr. Fredericdc Henderson
and Dr. Albert Collier of the Frank Porter Graham Child Development Center for
their st^jport and guidanoe. Most importantly I wish to thank Boy colleague Ms. Holly F. Reid for her ocaistant ooqperaticn, good humor, helpful ccraments, and
Introduction: Studies Measuring Indoor NO Levels
Hie Oxides of Nitrogen (N0„) are formed chiefly during the cxxiibustion of
fossil fuels, throu^ NDL. are produced whenever ocmbustion above 1350 degrees F
occurs (conventional ocntoustion temperatures are greater than 2250 degrees F)
(Wark and Warner, 1981). Outdoor sources of NOl. include autcmcbiles, pcwer
staticais, and emissions by plants manufacturing nitric acid and e>q)losives.
Indoor air may be contaminated by N0„ from outdoor sources, but indoor sources
such as gas stoves, kerosene qpace heaters, and tobacco smoke also contribute
significantly to NOj^ levels. While NOy are a large family of ocatpcunds, only
one ocupound, nitrogen dic»d.de (NO2) is cc^isidered a threat to human heeilth at
levels normally encountered in hones (USEPA, 1982).
Studies measuring indoor levels of NO2 have suggested an association, in
children and asthmatics, between increased respiratory illness (oot5)led with
decreased lung function) and lew level es^xasure to gas stove related
pollutants, including NO,, in the range of 0.1 to 1.0 ppn. Sane of these
studies have oonsictered the presence of a gas stove syncarymous with ej^xDsure to
NO2 (Florey C. du V. et al., 1979; Melia, R.J.W. et al., 1977). Wbre recently
other studies have measured NO2 levels using passive sanplers, known as Palmes
tubes (Palmes, E.D. et al., 1977a and b). These have provided ample evidence
establishing hi^ier NO2 levels in homes with gas ocnpared to hones with
electric stoves (Federal Register June 19, 1985). At least 7 studies have
r^»rted long-term NO2 levels betweai 50 and 300 ug/m"^ in hemes with gas stoves
and smokers (USEPA, 1982). S|pengler et al. (1983b) took week-loxf NO,
measurements using Palmes tubes inside and outside of 137 hemes in Ftortage,
Wisconsin over a 1 year period, and found NO levels inside the kitchens of 112
hemes with gas stoves averaged about 25 ppb (50 ugAi ) hi^ier than outdoor
percent of the gas cxjoking hemes h^ annual average kitchen levels hi^er than
3
the Naticaial Anbient Air Quality Standard of 100 ug/m . Ihese researchers also
noted a wide range in the variability in perscaial ejqxjsure. Only 5% of the
variability could be accounted for by stratificaticai by stove type, vJiereas vp
to 60% could be esqplained by measurements in the hone.
only one large scale study has measured both average and real-time NO^
levels in hemes with ocnibustion souroes other than gas stoves or smokers.
Leaderer et al. studied acute respiratory illness associated with the use of
unvented kerosene space heaters in 333 residences in OcsTnecticut frtxn S^Jtember
1982 to April 1983. Of these 333 heroes 14 were mcxiitored with a
chemiluminescent analyzer for a period of between 2 and 7 days. The remaining
hemes in the study were mcmtored for 2 week periods using Palmes tubes. Indoor
to outdoor ratios of NO ccaioentratic«s were found to be 0.58 +0.31 for
residences without kncwn scuroes of NO,. IVo-week average levels of indoor NO
exposure were found to be excellent predictors of total personal N0_ exposure
for a small saitple of eidults.
Ihis study was undertaken to determine NO^ levels in heroes to assess the
relatiOTtship between e}$x3sure to NO- and urinary ejccretion of hydrojcyproline,
v*uch previous research has suggested is a biological marker of ej^wsure to NO
(Yanagisawa et al., 1986). As a part of this larger stucty this technical
r^xsrt will: 1) assess the reliability and cost effectiveness of Palmes tubes
in determining NO, levels in the field; 2) detennine how precisely personal
ejqposure to NO2 can be estimated using chemiluminescent monitors and Palmes
tubes; and, 3) examine in-hcroe NO2 ej^xssure in lic^t of ^idemiological,
clinical, and toxioological evidence suggesting individuals are more sensitive
assess the health effec±s associated with NO it is first necessary to examine
the properties of NO^ and ambient levels found in other monitoring studies.
Fhysiccil/Chemiczil Prcperties NOj.
Nitrogen dioxide is a hi^ily reactive ccnpound, formed via several
pathways; therefore its formaticxi and subsequent health effects cannot be
discussed ^art frcm the entire nitrogen cscides family of ocnpounds that serve
as potenticil sources. Typically all NOj. derived frcm indoor ocmbustion
processes are discharged as nitrogen oxide (NO), with the rate of formation
rapidly increasing as the ternperature increases (Wark and Warner, 1981). Only
about 5-10% of total NO produced by ccnjbusticxi is NO,; almost all the
remainder is NO. Nitrogen dioxicte, N0_, the primary oxide of concern for human
health effects, is mainly formed by the oxidation of NO at Icwer tenperatures.
Tables 1 and 2 list the equilibrium ccxistants (K ) for the following two
reacticxis:
1) N2 + ©2 ?^ 2N0
2) NO + O2 ^ NO + O
The K for reacticai two is large at rocm tenperature, i.e. NO, formation is
favored at lew temperatures, but at hic^ier teamperatures it dissociates back
into NO and 0^. The K for reacticxi one is small at rocm tenperature, thus
little NO is formed; vdiatever NO is formed is rapidly ocawerted to NO . These
laboratory kinetic c±)servaticais are cc»if irmed in studies of the aging of
sidestneam cigarette smoke, viiidi has relatively hi^ier proportions of N0_ than
mEdnstream smoke (Lindvall, 1985). To sumnarize the two major ocaxjlusions
Table 1
Equilibrivm Ocxistants for the Formaticai
of Nitric Oxide fran Molecular QiQ'gen and Nitrogen
N2 + O2 f=^ 2N0
_____Temperature K
_________________CK)___________IF}________________I___
300 80 ^0~'^°-q
,^^^ '-'- 7.5 X 10
V[NO] 1000 1340
lonn T7nn
___________ 1200 1700 2.8 X 10"^
[N ] [O ] 1500 2240 1.1 X 10_^
2000 3140 4.0 X 10 ^
2500 4040 3.5 X 10
Table 2
Equilibrium Cjonstants for the Oxidation of Nitrogen Oxide to Nitrogen Dioxide
NO + 1/2 ©2 r^ NO2
_____Tecpperature K
X-K)________LF)____________L
V
[NO ] 300 80 10^
500 440 1.2 X 101000 1340 1.1 X
lO"-'-[NO] [0]-^/^ 1500 2240 1.1 X 10_^
2000 3140 3.5 X 10
From Wark et al., 1981, p. 376-377.
with increasing teuperature; and 2) the rate of N0_ formation increases with
increasing NO levels.
Relatively lew emissions of NO^ result in formation of more NO than ini^t
be expected sinply by measuring scuroe ejdiaust directly or via predictive
models based en eidiaust colvmm emissions. Outdoors the thermal oxidation
reaction 2N0 + O-#2N02 is too slew to account for any significant fraction of
the NO to NO2 conversion observed in the atmosphere for typical aitfcient levels
of NO, because the rate at viiich NO is converted to NO- throu^ oxidation by
(USEPA, 1982). Indoor ocnibustiai e^lianoe NO^^ e)dTavist has a hi^
ccaicentratiOTi of NO; this is important in generating a relatively hi^
proportion of NO, (i?) to 25% of total N0„) during the initial cccibustian source
plume cooling and dilxiticai, viien the oaxsntraticai of NO is hi^ (USEPA,
1982). In conclusion, indoors the above reaction produce hi^ier than ej^jected
levels of NO- because it is very sensitive to the hi^ levels of NO produced by
oaiixjstion ^pliancjes.
Other oxides of nitrogen inclxade nitrous oxide (N-O), unsyinmetrical and
symnetrical nitrogen trioxide (NO-), dinitrogen trioxide (N^O-), dinitrogen
tetroxide (NjO ), and nitrogen pentoxide (N_Og). Of these CTily N-0 is present
in the outdoor atmo^iiere in appreciable ooncentraticxis (USEPA, 1982). It is
not considered a hazard at indoor levels.
Ambient Levels: Outdoor and Indoor NO^
Outdoor NOj. levels contribute to indoor levels substantially: at least 50%
of indoor NO^ comes Lixxa outdoor sources—if there is no indoor source
(Leaderer, B.P. et al,, 1986). Indoor levels of NO , the primary oxide of
ocaioem for human health effects, are generally lower than outdoor levels.
Gas heating and cooking ^plianoes can increase the indoor levels, vfaLch may
occasionally rise in places to several thousand ug/m , d^jending on the t^'pe
and age of the house, edr esoiiange, decay rates, and source strength (Sexton,
K. gt al., 1983). Furthermore ccHwective kerosene heaters produce
^praximately 3.5 times more NO, than the radiant type (Woodring, J.L. et al.,
1985). NDl. in mainstream cigcirette smoke are mostly present as NO; sidestream
smcfce raises indoor NO, levels because NO is ocarverted to NO, via the reaction
noted in the last section. One cigarette produces between 160-500 ug IKL.,
Background levels of NO have been determined for both urban and rural
areas in the U.S. Ihe background ocxKentration of NO- in rural areas visually
3 ___
ranges fincm 0.5 to 10 ug/in (0.3 - 5.3 ppb) (USEPA, 1985). Urban levels vary
3
widely, d^jending cai locaticai and tune. Annual means are about 20-90 ug/m
(11-48 ppb); for exanple, the mean annual ocxxjentraticai ftrcm 186 urbanized areas in
the U.S. during 1977-79 was 55 ug/m"^ (29 ppb) (USEPA, 1985). The effect of
outdoor levels cxi indoor levels was addressed in two s^seu-ate studies. Sexton
et al. developed a model relating total NO^ e3?x)sure to background ambient
levels, indoor valiies, and human activities. Results suggest indoor N0_
cc8X3entratic»TS in private dwellings vary primarily with outdoor levels and l^'pe
of cooking fuel, but are also affected by factors such as eiir-eacchange rates
and strength of indoor sources. An exposare assessment performed frcm
S^jteniser 1982 to April 1983 by Leaderer and colleagues (1986) found that the
indoor to outdoor ratios of NO- were 0.58 + 0.31 for residences without known
sources of NO-.
In the past data frcm central mcaiitoring sites have been used to establish
cdr pollutic^ exposures. It is now recognized, however, that people ^lend a
majority of their time away fixm fijffld mcaiitors vJjere polluticai concentration
may be drastically different (Sexton, K. et al., 1983). Several inportant
e}qx3sure studies over the past 10 years have demcaTstrated that personal
exposures to many pollutants show little or no relationship to outdoor
measurements obtained at central moiitoring sites and that perscaial e>qx)sures
are often hi^ier than, thou^ poorly correlated with outdoor ey^xjsures
(Spaigler, J.D. etal., 1983b, 1984). DocikBry et al. (1981) showed that
personal exposctres are functions of outdoor levels as well as stove type;
perscaial exposures of subjects with gas stoves were two tines hic^ier than those
with electric stoves. Ptjrthermore incSoor NO levels in hones with gas stoves
were three times hi^ier than outdoor levels. Leaderer et al. also shewed that
persOTicLl and indoor NO levels for subjects using xmvented Kerosene heaters
were significantly higher than outdoor levels. In sunmary total personal
exposure to NO- is d^jendent chi the levels and amount of time spend in each of
the xnany indoor and outdoor "microenvircxTments" an individual passes throu^
each day (Sextan, K. et al., 1983).
Sources
Of the indoor sources listed previously, NO mcxiitoring has identified
kerosene heaters as the hi^iest N0„ producers. Kerosene heaters cane in two
types: cawective and radiant. Ihe caivective type has an exposed flame and
the radiant type has a metal mesh over the wick. Woodring et al. measured
aaiissiai rates from both types of heaters and fcund that coTvective heaters
produce ajprojdmately 3.6 times more NO^ than radiant heaters (p <0.001).
Ocnpariscai of these figures with data an gas ranges show that convective
kerosene heaters have greater emissioi rates. Ihe hi^iest peak levels found in
gas stoves were the lowest levels expected from caivective kerosene heaters.
In-hone measures of N0_ levels ty Leaderer et al. (using Palmes tubes) found
that levels for homes with a kerosene heater caily and those with a gas stove
oily were similar. Hones with a kerosene heater and a gas stove had average
two-week N0_ levels e^jproximately 2 times those with oily one source. Hiese
seemingly cortradictory results may have been obtained because the measurements
from the laboratory studies were taken directly fron the exhaust gas column,
vftiereas the in-hone levels actually measured resulted from the room temperature
kinetic interactiois menticsned in Tables 1 and 2. Average levels are also
d^)endent on the duration of use of the ca±usticai e^pliance; levels in hones
reflect different cocking and heating activities.
Literature Review: Heeilth Effects of NO2
NO is the most prevalent oxide of nitrogen eanitted into the antoient air frcm ocnixistiOTi sources. Ocxioem about possible health effects of virtually all of the types of nitrogen oxide ocmpounds, inclvKiing NO, has existed for many years. Despite these ccaxems "and considerable scientific inquiry, there
is now little hard data linking specific health effects to any of the oxides of
nitrogen, with the notable exc^>tion of NO-" (USEPA, 1982).
NO- is a pulmcaiarY irritant, but has a hi^ odor threshold, easily raised by ad^Jtation (Lindvall, T., 1985). Thus NO- has insufficient sensory warning properties, especially since the dcndnant irritatiai effects of the substances
are localized to the de^jer eiirways. NO also causes bronchoconstriction via various mechanisms, resulting in increased airway resistance (Lindvall, T.,
1985). "Hie irritant and bronchooonstrictive effects of NO- on the respiratcry
systam are the most extensively characterized to date and e^jpear to be of most
ccaioem in tenns of both acute and long-term health inplications (USEPA,
1982).
Acute accidentcil ej^xasure (less than one hour) to levels of NO- greater
than 300 ppm causes r^id death from edama; e^qxssure to levels greater than 25 ppm cause bronchitis or bronchial pneumcma (USEPA, 1982). Irwer levels
(< Sppoa) are associated with a variety of re^iratory system effects.
InvestigatiOTis ciiaracterizing low level health effects have taken three general
e^:proaches, shewn belcw, each c^roach showing different but related
respiratory system effects (OSEPA, 1982):
1. OOTTtrolled Human Exposure Studies—increased airway resistance and other
indicaticais of altered pulmOTiary function.
2. aiman Epideanioloqy Studies—increased incidenoe of human re^iratory
illness, especicilly in sensitive populations.
3. Animal Toxicology Studies—lung tissue damage and increased
Collectively, these studies provide evidence indicating that certain human
health effects may occur as the result of exposure to N0_ ocaxentrations
approaching or falling vdthin the range of recorded ambient eiir NO levels:
1 hour peaks of 0.4 to 0.5 ppti in sane xirban areas, and annual means of
0.11-0.48 ppm in urban areas (USEPA, 1982). EPA scientists have identified three
important issues to consider when reviewing the lew level heeilth effects
literature:
1. "QxTsideraticai of Icwest effective single NO, ej^xDsure level (s) inducing
particular respiratory effects in healthy and sensitive human subjects;
2. Assessment of Icwest effective exposure levels at v*iich repeated or
intermittent N0_ ej^xDsures produce effects in human populations; and
3. OcHTsideration of the relative significance of observed effects in terms
of understanding the likely impact of ambient NO- ej^xasures on human
health" (USEPA, 1982).
Ihe follcwing is a brief summary of respiratory system effects observed in the
three major study approaches.
Controlled Human Ej^josure Studies
Controlled clinical studies have generated extensive informatics about the
lowest effective dose levels for the inducticai of respiratory effects due to a
single short-term NO, es^xasure. Ihe mechanism underlying most of the changes
in lung function ascribed to such e}^x3sure is still unclear, but would appear
to be the irritatic»i of smooth muscles or i^jecific reo^jtors (Lindvall, T.,
1985).
E>5X3sure at ocgKentraticaTS of 9,400 ug/m (5.0 ppn) NO, or above for as
little as 15 minutes will increase airway resistance in healthy human adults
and inpede the normal transport of gases between the blood and lungs (vcai
Nieding et al., 1973). In healthy adult individuals, ocaxjentraticais of 4,700
3ng/m (2.5 ppn) NO2 for 2 hours have been reported to increase airway
resistance significantly without altering arterial ooQ'gen pressure (USEPA,
3 1982). Single e>?x3sures for 15 minutes to NO- at conoentraticxis of 3,000 ug/m
(1.6 ppn) are etlso likely to increeise eiirway resistcinoe in healthy adults and
individuals with chroiic bronchitis but not to interfere with the transport of
gases between blood and Ivmgs (USEPA, 1982). Single e}$)osures for times
3 ranging frcm 15 minutes to 2 hours to NO- at oaioentrations of 2,800 ug/m (1.5
ppm) or below have not been shewn to affect respiratory function in healthy
individuals or in those with bronchitis (LindVcill, T., 1985).
In its most recent review of technical data chi this subject EPA ocaxilxxJes
that the more recent ccsitrolled human e^iposure studies pres^it mixed and
ccxiflicting results ccHioeming re^iratory effects in asthmatic and normals in
the range of 0.1 to 4.0 ppm NO- (Federed Register June 19, 1985). Whether
asthmatic subjects are more sensitive than healthy adults in experiencing
NO^-induced pulmcxiary function changes remains to be definitively resolved. Ihe
results of one ocxrtrolled human ej^josure stutfy suggest that seme asthmatics may
experience chest disccmfort, dyspiea, headache, anci/or sli^t nasal discharge
following 2 hour es^xisures to 0.5 ppa NO- but did not provide ocxivincing
evidence of pulmonary function changes in asthmatics at that NO- ccax^entration
(Grant, L. 1982). Results by Bauer et al. shcMed that in asthmatics pulmonary
function decrements occurred at 0.3 ppoa NO . Ihese results were replicated at
EPA Health Effects Research Lab in Ch^jel Hill by Grant (1982)
Studies have been performed on bronchieil reactivity induced by NO. in vAiich
lung function was tested for sensitivity to agents that ccxTtract the eiirways
(Lindvall, T., 1985). Orehek et al reported increased bronchial reactivity in
3
asthmatics at fairly lew cxMicentratiCTTS (190 ug/to ) during 1-hour e^^xssures.
The results of this study st^iport the results by vcai Nieding et al, v4k>
suggested that acute effects on pulmonary acetylcholine seisitivity to NO may
3 3 ___
sulfur dioxide (300 ug/in ) and ozone (50 xig/m ) (USEPA, 1982). Ihese results are inccxjclusive—^the Qrehek stu^ mainly because the gxxxxpjjng of the subjects was made after the pulnoiary test with no independent criterion for pulmonary sensitivity and in the von Nieding study because the results were inconsistent
(Lindvall, T., 1985). These studies, thou^ flawed, suggest a possible ejqxjsure-effect associaticxi with complex mixtures, such as those eanitted by
unvented caoobusticai appliaiK^es.
Human Epidemiology Studies
E^idemiologiceil studies of the effects of coratiiunity air polluticai ai^e difficult to do well since there are edmost adways ccnplex inixtures of
pollutants in the air. Usually the most that can be dertonstrated frcm such studies is a "close associaticai between health effects and ambient
oonc^itraticHTS of a given mixture of pollutcuits or subfracticHis of the mixture" (IBEPA, 1982). E^idemiologiccil studies of edr pollution effects are also often hampered by difficulty in defining actual ej^xDsures of study
populaticsTS. Due to differences in mcaiitoring techniques and analysis, but also becai:ise fesa of these studies have adequately considered indoor e^qx^sure
levels, outdoor studies have produced conflicting results. Althou^ outdoor
studies are too numerous to mention in full, am series of studies of local
interest has been widely cited, criticized, and its data analyzed and re¬
analyzed to an extent that it should be menticxied here.
Studies in Qiattanooga, Tennessee, from 1968 to 1973 related anbient air
levels an the order of 40 to 90 ppb mean NO (mostly frcm a local TNT plant) to
respiratory disease incidences in the general pcpulus (USEPA, 1982). Initial findings indicated that e-mcarth average antoient NO- levels (using the Jacob-Hociiheiser method, vMcii was later found to be erratic) were related to
decreased Ixmg functicHi and increased respiratory disease incidence. No fewer
than 5 subsequent analyses have been performed cxi the same data, most xising
mare sophisticated statistical techniques and additicxial questicxmaire data.
Results of these subsequent studies have not provided a clear picture since, for instance, Harringtcxi and Kr\;5xiick found that "over the range of pollution valiies ej^jerienoed, more illness is eissociated with lew pollution values than with hi^ cues (Harringtcxi and Kn^anick, 1985)." EPA has concluded that:
"The Chattanooga studies provide limited quantitative evidence of an associaticMi between elevated Icxig-term NO. ej^xDsures and the occurrence of
increased incidence of acute re^iratory disease and lung functicai
iitpairment. Ihe findings of these studies are not inconsistent with the
hypothesis that NO in a ocnplex mix with other pollutants in the ambient air adversely affects Ixmg functicxi and contributes to excess respiratory illness in children" (Federal Register June 19, 1985).
Other outdoor studies of NO ocax^Qitraticxis in the range of 0.02 to 0.51 ppn awong adults found no differences in pulmcHiciry function tests eilthau^ ccnplex mixtures of other pollutants were not controlled for (USEPA, 1982). A study performed in Japan did r^xsrt a statistically significant correlaticai between
caie-hour ccxicentraticxis of NO2 in the range of 0.01 to 0.19 ppn and decreased
respiratory function of school children (Kagawa and Toyama, 1975). Hcwever, at
typical «ie-hour mean NO^ omcentrations temperature was more strongly
associated with decreased lung function than any of the pollxitants measured in the study (NO-, NO, 0_, S0_, and su^jended particulates) (Lindvall, T., 1985).
Wiile these anisient air studies indicate a correlation between NO. and
respiratory problems, particularly with younger children, and do demcaTstrate that peak exposures are most likely more inportant than average exposure, they
are qualitative in nature because they do not measure indoor or perscaal exposure levels directly. Since people generally spend 70-90% of their time
dose-respcaise relatioiship with re^)ect to susceptible pcpulaticais, but also to
show the tannfXDral nature of the dose-re^xxise relaticaiship.
Indoor epideaou-ological studies ty British (Melia, R.J.W. et al., 1977, 1978, 1982) and Harvard (Speizer, F.E. et al., 1980; Docdcery et al., 1981; Ware, J.H. et al., 1984; Berkley C.S. et al., 1986) investigators provide seme
si^jport for the hypothesis that ehildren are at i^iecial risk for N0_-induced
increases in acute re^iratory illnesses. These studies investigated possible
decrements in lung functicxi and/or increased respiratory synptems and illness
rates ancxig children living in heroes using gas stoves for cooking in ocnparison
to ehildren frcm heroes with electric ranges (USEPA, 1982). Gas cooking can
produce considerable indoor NO^ levels, and several studies substantiate that
hitler NO levels accumulate in hemes using gas stoves in ccnpariscai to
NO-levels found in hemes with electric stoves. In 1978 Melia et ^. reported that
average NO ccancentraticxns in 2 heroes over a 96-^Kxir test period, during viiieh
3
stoves were in use for 8.5 to 10 hours, were 136 ug/m (72 ppb) when gas was 3 . . .
burned, and 18 ug/m (10 ppb) in 2 hemes v^iere electricity was used. Other
studies, including those by Goldstein et al. and Spengler et al. (1983b)
ccxif irm that the levels of NO in gas stove hemes are hi^ier than those in
hemes using electric stoves. The initial publicaticn by Melia et al. (1977)
reported a weak associaticai between increased ra^iratory illness in school
children and residence in homes using gas stoves. This stucfy, however, failed
to adjust for tobacco smoking in the heme. Later publications ty Melia et al.
(1978, 1982), vhich corrected for the nuirtoer of smokers in the home, found weak
associations between gas cooking and re^iratory illness in children in urban
areas but not in njral areas (USEPA, 1982).
In the U.S. Speizer et al. (1984), in the first of a series of studies, reported that 6 to 10 year old children frcm homes with gas stoves had lower lung capacity and a greater history of respiratory illness befoire two years of age. Florey et al. (1979) found no relationship between NO ooioentrations in either bedrocnas or kitchen and the results of lung functicn tests on school-age children. However, the prevalence of re^iratory illness was found to increase
with the NO- levels in the bedrocras of children in heroes with gas stoves. In a
pqpulaticm of rural, nav-ssnaoking, adult women in the Netherlands Fischer et al. (1985) found no significant associatiai between N0_ eoqxssure and pulmonary functiOTi decline. Mast recently Berkley et al. (1986) r^xjrted an association between expoetJocB to sidestream cigarette snoke or gas stove emissions and pulmcaiary functicai level and grcwth rate in a large sainple of children 6-10 years old. The data from this report provide seme evidence for an association between gas stove e^iposure and puliKXiary functicai level, especially at ycunger ages, but no evidence for an effect of gas stove ej^xasure en growth rate.
Ihe inconsistency of results obtained so feir is most cleeirly shewn in the case of Speizer et al (USEPA, 1982). When they reanalyzed the same data that they had previously reported on with additicaial cohorts from the same
population and a more detailed assessment of socioecc»ioniic status, one of the findings, a statistically significant increased incidence of respiratory
illness before age 2, became less statistically significant (Ware, J.H. et al., 1984). Ihis stucfy also demeaistrated that, in children annually tested, with respect to the rate of change in lung function, no cumulative effect of gas-stove ej^xasure was revecd.ed. Noietheless this stu^ does ccaifirm small but
statistically significant decreases in lung functicai in school age children, althcu^ there is seme evidence that parental educaticai levels may confound
better vmderstanding of the health significance of indoor pollutants such as
N0_ may require more def ir Register June 19, 1985)."
N0_ may require more defined measurements of personal ei^xasure (Federal
Animal Studies
Clinical and ^idemiological studies have suggested, in a qualitative sense, an eissociatic»i, in children and asthmatics, between increeised
re^iratory illness and low level exposure to gas stove related pollutants such
as NO in the ranges of 0.1 to 1 ppn (USEPA, 1982). Two types of animal
ejqperiments have shed li^t on the nature of the physiologic damage and NO dose re^xHTse curves:
1. Experiments measurincf alteratiais in puiinonaiv function. -Biochemical
parameters of exposure have been detected as lew as 752 xig/m (0.4 ppn).
2. Experiments inducincr susceptibility to pathogenic bacteria. One study has shewn an excess in mortality (after bacterial challenge) following a 3 hour exposure to NO- at ocxicentraticais as low as 1 ppn (Lindvall, T.,
1985). ^
While NO studies have been performed at levels above 10 ppn, EPA has judged that this caicentration is the maximum at vAiich animal studies provide relevant
data to estimating the human heeilth effects of ambient or near ambient
ccax3entraticns of N0_ (USEPA, 1982). No studies so far have shewn that NO, is
a carcinogen, even at hi^ ccxx3entratiais.
An unusual aspect of the toxicity of N0_ is a delay between exposure and
observed health effects (USEPA, 1982). The nature of this tertporcil sequence is
inportant for understanding the toxicity of N0_ and has inportant inplications
for the effects of both short-term and laig-term e^qxssures to this eiir
pollutant. Ihis trend has been observed in many sgeciss despite the
differences in NO2 sensitivity among these species and the many different
ent^ints of toxicity (USEPA, 1982).
•
NO^ water solvible and can be absorted in the nuoous lining of the
nasopharyngeal cavity vSiere it cawerts to nitrous and nitric acid (Lindvall,
T., 1985). Few data examining respiratory tract v^ptake and transformation have been published, but it seems that about 50-60% of inocming NO- is retained in
___ . . . 13 .
animals (USEPA, 1982). Kadiotraoer studies in mcxikeys have shcvTn that NO. is
fairly vmifonnly distributed in the Ixmg and retained for a prolOTiged period
(USEPA, 1982). A significant fraction of N0_ is not removed in the i;5)per
airvays, and this penetrates de^ within the lung to produce its toxic
effects. Because of its hi^ reactivity, the predcminant response observed on
the inhalaticxi of NO, is direct injxary to the tissues of the lung, possibly
resulting in cell death. "Ihe magnitude and site of the injury resulting frcm
NO exposure will di^)end xxpcxi the ocxicentraticai of NO- vAiich was inhaled;
therefore, the absolute degree of re^xHise will depend xjpan both the rate and magnitude of respiraticxi and the NO- ccaxjentraticxi (USEPA, 1982)."
Morphologically, the damage caused in animal pulmonary tissues by prolonged
3 ej^xDsure to nitrogen dioxide at fearly hi^ ocaxentraticaTs (600-2000 ug/m or
above) is inflanmatory; signs of brraxiiitis are topical findings in rodents (Lindvall, T., 1985). Changes in lung morphology and eatphyseama-like effects
occur at hi^ier esqxDsure levels, with resultant decrements in Ivmg functic»i.
Ihe most obvious effect of ej^xDsure to NO- is a change in paLmonary
function. In rats, increased re^iratory rates have been observed at 1500
3
ug/m (0.75 ppn) after long-term e>qxDsure (Lindvall, T., 1985). The same
effect has been found in other animals at hi^ier levels (ncxi-human primates,
guinea pigs, cats), eilthcu^ the sensitivity between ^jecies varies.
Increased susceptibility to airway infecticai etfter e^qxssure to NO^ has been
•
3
ug/m (3.5 ppm) or above, the mortality amcxig exposed mice, hamsters, and
squirrel mcaikeys was hi^ier than amcaig control animals (Lindvall, T., 1985).
Mortality due to eMDgenous infectious agents is influenced more by the
ccncjentration of N0_ than the e^^osure. The EPA ND„ Criteria Document (1982)
points out that this cbservaticai is consistent with the hypothetical tetrporal
sequence of injury. It is thou^t that paLmaTary damage occurs rs^idly on e>^xDSure to N0_, but the functiCTied effects of pulmcffiary damage may be observed
much later, d!^)ending v^xxi the extent of damage and the system vAiich has been
vised to measure the damage: biochemical enc^XDints or suso^jtibility to airborne infectioTs (USEPA, 1982). The t^Tpothesized teamporal sequence of injury and r^>air for short-term (less than 8 hours) cme-time ejqxDsures begins with an essentieilly instantaneous chemiccil reaction of N0_ with the tissues of
the re^iratory tract. Susc^itibility to microorganisms begins to rise eilmost
imnediately, and biochemical indicators of injviry peak about 18 hours after exposure; cell death peaks at 24 hours, and replacement of dead and injured cells and biochemical indicators of repair reach their maximum at 48 hcurs
___ 3
(USEPA, 1982). Injury caused by NO. ccsicentraticais as lew as 4,700 ug/m (2.5 ppn) may result in excess cell mortality f rent a single exposure of caily 3 hours
(Gardner D. et al., 1977). The injury of a 3 hour exposure appears to be repedred within 24 to 36 hours after eo^xssure, but not by 18 hours (USEPA,
1982). Ihe increased susceptibility to edrway infections caused by exposure to
HD^ ni^t be due to an effect of the gas en the lung macrophages, the
auoocilliary clearance mechanism, or the inraune system (Lindvall, T., 1985).
Lcxig-term ej^xssures to NO- also result in major alteratioTs of lung
xaorphology (USEPA, 1982). Ihese studies, hcwever, are difficult to interpret
because of the fine gradaticai and slow development of respcxise once the initial
phase of replacement of cells susc^Jtible to NO. has passed. Ihe development
of an eamphyseraa-like disease in ei^jerimental animals requires ocaisiderable time
as seen in studies of rats and mice.
Health Effects: Sunanary
In oonclusicn the most ocranonly oiaserved human heedth effect due to N0_
exposure is increased eiirway resistance mediated by the stimulaticn of local
receptors or other reflex mechanisms not necessarily specific to NO
(Lindvall, T., 1985). A number of e>5)eriments have shewn that challenge with N0_ increases brxaichial sensitivity. This leads to the general inpression that organisms mi^t be more sensitive to short-term exposures of hi^
conoentratiCTis of NO- than to IcHig-term e}^)06ures to lew ccaxjentrations
(Lindvall, T., 1985). This view is supported by studies cai animals, such as
those by Gardner et al. en the influence of exposure mode on the toxlcitY of
NO in combinaticxi with bacteria. Gardner found that vAien a caistant
oonaentratiai*time level was enplcyed, a short-term exposure to a hi^
ccaioentration produced a greater effect than exposure to a Icwer oCTxentration administered over a Icaiger period. With this in mind and an 0.05 ppn annual
mean expcysare standard to jxastify EPA (1982) ooxilxided that "estimates of
repeated short-term peak ocaicentraticns of NO- possibly associated with
increased re^iratory illness in heroes with gas stoves are not markedly below
the general range of the lewest (0.5 to 1.0 ppm) intermittent ej^xjsure
caxentrations found to cause increased suso^xtibility to respiratory
infecticxis in animal infectivity model studies." In order to attribute health
effects to NO- e>qx3sure more hard data cai levels actually encountered by
individuals is needed.
To put these cax:lusions in perspective, ambient air NO ncaiitoring results
indicate that peak l-*our NO rarely exceeded 0.4 to 0.5 ppm (USEPA, 1982).
standard, were only fcund in a few scattered locaticais, mostly in Southern
California and Chicago (USEPA, 1982).
Materials and Methods
Stixfy Pcpulation. The study pcpulaticsi vere volvmteers frcan among the
families with children at the Frank Porter Qraham Child Developnent Center
(FPG) and data were collected between February 1986 and July 1987. IV^ent^
preschool children fran FPG and their mothers were monitored for NO, exposure
in their hemes and at the day care center during a seven day period. Ihe
children range in age fron 6 mcsnths to 4 years old. Volunteers were recnoited
Table 3
in Study ]
ISivented Sources No. of Vented
Potential NO, Sources in Study Hcnaes
Family Soace Heater Gas Stove Smokers Heatincf Ccxnments
Kerosene Space Heaters
*
1 Kejrosene None 0 Oil Moved
2 Kerosene Pnpane 0
Propane
3 Kerosene None 1 Electric
4 Kerosene NOTje 0 Electric
ͣ
jf
5 Kerosene None 1 Elec. Baseboard Moved
Gas Stoves
6 None Natural Gas 1 Gas
7 None Propane 1 Prcpane
8 Ncaie Natural Gas 1 Natural Gas
9 None Natural Gas 0 Natural Gas
10 None Propane 0 Propane Gas Dryer
Smokers
11 None None 2 Kerosene
12 Ncaie Ncxie 2 Natural Gas
13 None None 1 Natural Gas
14 Ifona NcHie 2 Elec. Heat Puirp
15 None None 1 Natural Gas
Ncxv-Smokers
16 None None 0
Elec. Heat Purtp
17 Ncxte Hone 0 Elec. Heat Puirp
18 None None 0 Elec. Baseboard
19 NOTje NCTie 0 Natural Gas
20 Nc»ie None 0
Elec. Heat Punp
fcon heroes in 3 potential ei^xasure categories, and a ccaitrol grot^): 1)
kerosene ^aoe heater xisers; 2) gas stove users; 3) tobacco smokers without
vmvented ccnbusticxi appliances; and 4) ncai-tobaooo smokers vdthout vmvented
ccnbusticai appliances. There were twenty families were included in the stuc^;
two of the families in the kerosene ejqxjsure category and 3 from the gas stove
exposure category were also smokers. One of the families in the kerosene
e>qx3sure category were also gcis stove users. A ccnplete description of each
family's eo^xasure to cotribustion appliances, tobacco smote, and their central
heat source is listed in Table 3.
NO, Mtxiitoring Techniques
Most studies of perscaial ej^xDsure to NO- rely eilmost exclusively on
passive monitors kncvm cis Palmes tubes. These are ccsisidered less reliable
than the oonventicxvG. "gold standcu?d," chemilimdnescent monitors, but are far
more caivenient for measuring perscaicil ejqxjsures. In this study both
monitoring techniques were used: Palmes tubes and ocartinuous chemilurainesoent
Bendix 8081 Oxides of Nitrogen Analyzers (Bendix instruments subsidiary was
purchased and is new operated by: OcnbustiOTi Engineering Incorporated, U.S.
219 North, Lewisburg, West Virginia 24901).
Continuous Mcaiitors. Oc»Ttinuous chemiluminesoent mcaiitors, vdiich are EPA's
reference method for measuring NO,, provide both peak short term levels and
average oonoentratioi over any period of time. They do not measure NO,
directly. Rather, they obtain NO ccaxsentraticxis by measuring the luminescence
produced by hi^ energy NO, during the gas phase reacticxi between NO and
ozcMie. The instrument has two sampling phases; in the NO phase it diverts a
portion of the saitple air to a reducticai catalyst that ooawerts NO, to NO. NO
originally present in the sanple reanains unchanged. The seccxid phase, or NO
channel, is not ccnverted. The two samples are then analyzed by the
Ivradnesoenoe chairtoer. Ihe instrvmient interprets the measured ocaioentrations as
NOy=(NO + NO-); thus the sanple N0_ cxanoentraticai is determined by the
differencje betweai NOj. and NO phases of sampling (Bendix, 1977).
ThB Bendix mcxiitors used in this study are sensitive in the range of 5 to
500 ppb NOp. Ihey sample 150 cubic centimeters of edx per minute using Thanas
vacuum punps (purchased frcm Southern Fluid Power, Late Wylie South Carolina,
29710) emd the inlets were fitted with one ei^th inch diameter teflon tubing.
The mcxiitors were calibrated using a Bendix 8861 "suitcase" calibrator and
nitric oxide span gas purchased from Airoo Industrial Gases (Research Triangle
Park, North Carolina) and certified by EPA-Research Triangle Park.
Passive Itoiitors. The Palmes tube is a passive N0_ or NO monitor that
provides an average e^iposure level over a week or mcxrth. Palmes tubes have
typiccilly been used for am week e^^xssure periods, both indoors and outdoors,
and for persCTial mcMiitoring. The principle of cperaticxi is based on Pick's
First Law of Diffusicxi (Palmes, E.D. et al., 1977a):
J= -D dC/dL
Where:
J = amount of NO- passing throu^ a unit area per unit time^ moles/an -sec
D = diffusion coefficient = cm /sec C = coioentration = moles/cm
L = diffusion path length = cm
Ihe ri^t hand side of the equation is negative sinoe flux is in the direction
of decreasing ccaicentraticoi, i.e. as L increases C decreases (Palmes, E.D. et
al., 1977a)
Khen the above equation is used to calculate the quantity of
NO-tran^)orted by molecular diffusiai throu^ the tube in a given time, it must be
modified to include the cross-secticnal area of the tube. A, and the time for
•
•
1977a):
Q = JAt = -D C/L At
Where:
Q = Quantity of NO, transferred = moles ,
A = cross-sectioncLL area, of the tube = cm t = time = seconds
The quantity of gas transferred, therefore, d^jends cai the three constants, D, A, and L, and the two variables, C (ocaxsentration) and t (time).
The sanpler depends an the transfer of NO2 by diffusion to a
triethanolamine (TEA) coated collector at the sealed end of a tube; the qpen
end of the tube is exposed to the test envircaiment:
"The quantiti^ of gas transferred by diffusion from the environment throu^ an orifice of kncwn dimensions into a chantoer maintained at
substantially zero ccaxentraticai by a suitable collecting medium [TEA] can be used as the basis for calculating average conoentrations during the time
the sanpler is in the envirtximent (Palmes, E.D. et al., 1977a)."
TEA was selected as the absorber instead of other reagents for several reasons: it captures N0_ very efficiently, can easily be coated on to solid materials,
and the TEA-NO, ccxrplex is very stable. The minimum sampling period is
d^jendent i^xan expected NO ocxicentratiOTis; the detecticxi limit of the Palmes
tube is 600 ppb*hrs (Majahad, A.M., 1986).
Palmes (1977b) reports a 97%-102% efficiency (in lab studies) for the sampler and a precision of +3% as ccnpared to the chemiluminescent analyzer. These devices have also been ccnpared with standard chemiluminescent N0_
mcaiitors by Warren Spring Laboratory, Lawrence Berkeley Laboratories, and the
U.S. Naticxial Bureau of Standards. "Aocuracy has been shown to be better than
±10%. Replicate samples indicated an absolute difference of 10%. Hence, these
NO2 devices are accurate to within 10% and have a precisicxi of 10%" (Dodkery et
al., 1981). In a stud/ by Goldstein and co-woricers two mBasurements of NO
levels were obtained in each of 507 kitchens. The difference between the pairs
of readings was less than 10 ppb in 63% of cases and less than 20 ppb in 83% of
the cases. The lower limit of sensitivity of 600 ppb*hours makes these devices
suitable for week-lcaxf integrated measurestents at antoient levels (Majahad,
A.M., 1986). Palmes tubes are inexpensive, vmobtrusive, and have been used to
obtain average indoor N0_ levels in a number of leunge sccde studies (Spengler,
J.D. et al«, 1983b,1984; Melia, R.J.W. et al., 1978,1979).
Like any other sanpling system, Falioes tubes have limitaticais. Results are
r^xDrted as average ccxx3entraticais for the period saitpled: they give no
infozmation about pestk e>q)osure levels, and acute levels are most likely more
inportant in terms of human health effects (Lindvall, T., 1985). Rirthermore,
diffusicxi theory predicts caily a 1.7% change in the sanpling rate with a 10
degree C change in tenperature at 21 degrees C (Girman, J.R. et al.). TEA,
however, has a liquid-solid phase transiticxi at 21 degrees C. Ginnan et al.
have found that the collection efficiency of the sanpler is d^jendent on
tenperature, with the collection efficiency decreasing 15%, frcm 96% to 82%,
v^ien the temperature decreetsed front 27 to 15 degrees C. This change in the
Cc^xture efficiency would under-report actual vcLLues, thus false positives (hi^
readings) would be less likely at the te9oi)eratures found in this stuc^. The
cause of the variaticxi in collection efficiency with phase is unkncwn. If it
is due to the kinetics of absorpticai, the possibility exists that the sampling
rate is concentration dependent at low tenperatures. Ginnan r^xarts an 87%
collecticm efficiency at 21 degrees C, lower than the efficiencies of 92-95%
r^xarted by Palmes (1977a) and Woehkeriberg (1982).
Ihe Palmes tubes used in this stucty were purchased frcm the Harvard School
of Public Health Six City Air Polluticxi Health Study Group (Harvard School of
Public Heeilth, Canbridge Massachusetts) and developed by Anthoqy M. Majahad,
the Qualily Assurance/Quality CXxitrol Officer. lots of 100 Palmes tubes were
initial aoqiiisiticai date, viiich is within the shelf life lijnit for this
sanpler. Results eire cbtcdned by measuring the absorbanoe of the diazo
compound of NO- and NEDA in the presence of a color reagent
(NED2^=tJ-[l-Napthyl]-ethylene diamine dihydroc±LLoride) (Majahad, A.M., 1986). Ihe samples are
measured at 540 nm and ccxiverted to nancmoles of nitrite bcised an the forced
regressicxi coefficient of a standard calibraticai curve. At least 5% of the
tubes in each lot were field or laboratory blethlcs.
Ei?x3sure Assessment Protocol. Hones were monitared for om week during the
heating seascai (Novenber-^ril) and another during the sunmer rocsTths
(May-October) . On the first day of the monitored week (usually Sunday) the
chemilumu nescent monitor was instcdled and questicainaire data collected to
indicate heating, cooking, and smoking status to document possible
NO-sources. The inlet of the chemiluminescent monitor was placed in a location to
sample edr from the evening activity room of the child. One Palmes tube was
attached approxixaately five inches from the end of the inlet tube for the
chemil\miinesoent mentor. At the same time individual Palmes tubes to be worn
by the child and mother were opened. Parents were also instructed cai record
keeping on source use and the heating system was checked to ccaif irm its t^'pe
and ventilaticxi. A second chemiliiminescent mcxiitor recorded NO- levels in the
child's classrocm at school. On the seocaid day of the week the in-home
chemilxminesoent monitors were calibrated (NO ^an = 400 pgb) using the Bendix
8861 suitcase calibrator. Continuous mcaiitors were recalibrated before they
were unplugged at the end of the mcaiitored week. The in-school continuous
monitors were calibrated weekly. Thus for each subject there is a ccaitinuous
record of e^qxssure at heme and school as well as an estimate of average
ejqjosure from the Palmes diffusicxi sairpler.
m
m
Data Analysis. For eacii participating family five different measures of NO es^xjsure, or response variables, were obtziined. Palmes tubes results were r^xDrted as FPb*hours. A Textrcnics digitizing tablet (cxxirtesy of the UNC Department of Geogre^iiy) was used to ocnpute the area xmder the cajrve frcm the Hnfm\ 1 nmiTv>griP>Tiri- monitor Strip charts (c.f. Figure 1). The area under the curve values obtedned from the digitizer were ocawerted to mean ppb NO per
week using the lotus spreadsheet package to divide total NO^ by el^)sed time
mcxiitored. Ihe five respoTse variables measuring perscHial and in-hcme NO levels (in ppb) are described belcw:
1) OCMT? - seven day in-hone chesniluminesoent mcaiitoring value.
2) HSOOJ - a ooDdbination of hcrae and school chemiluminescent monitoring values. Ihis re^xiaise variable is the wei^ted average of NO. levels at school and at heme. Ihe assunption xased in creating HSC3CW is that the child is at hone vftien not in school. Ihis vcdue, then, is the closest ^prc&dLmation of a child's persc^ial e>qx)sure using a chemiluminesoent
monitor.
3) FH7D - Palmes tube in-hcroe valvie. This tube was attached to the chemiluminesoent mcxiitor inlet, to provide am indicaticxi of Palmes tube reliability.
4) PKID - Palmes tube worn by child.
5) BCM - Palmes tube worn by the child's mother.
HSC£»J, PKID, and HCM are individued. eiqxDsure averages v^iereas (XNH7 and FH7D are average levels obtciined in a subject's primary microenvironment. Two Palmes tubes were lost over the course of the study, both by mothers, hence I901 is ^lort aots. ctsservaticsi in each of the mentoring seascais.
Statistical analysis was dcx>e using PC-SAS (SAS Institute Incorporated, Box 8000, Gary, North Carolina). Paired mean T-tests were performed using Proc Means; regressicxi analysis was performed using Proc GIM.
Continuous Itoiitor Data Qucility Assurance. Chemiluminescent momtor
calibration data were checked for error. No ccaitinuous moiitoring data was
used if the monitor calibraticxi changed more than 10% over the course of a
The mcxiitors used in this stucty were tested for a low level response to
elevated relative humidity, v*iicJi could possibly lead to overestimation of NO
levels. Ihis phencroena has been observed in Bendix 8101 Oddes of Nitrogen
Analyzers, but is e^jparently mcaiitor specific (personal ocranunicaticMi, Dave
Ginble, Environroental Monitoring Systeaaos Incorporated). Monitors were zeroed
using dry air (relative hvnnidity < 30 %) frcro the Bendix 8861 calibrator and
then sampled humidified edx (relative humidity > 72 %) for as little as 3 and
as many as 7 hours. Five replicate experiments were performed cai four
mcsiitors lased in this study. Ihe amount of change in the zero was recorded
from the strip chart recorders as a positive or negative response (ppb) to the
increased relative himiidity.
Results
Reliability of Palmes tubes verses cJieanilxmdnesoent mcaiitoring results was assessed using vmivariate regressicai analysis. Table 4 lists the correlation
coefficients for ccnpariscaTS of chemiluminesoent verses fixed Palmes tubes,
fixed Balmes tubes verses persOTial Palmes tubes, and two personal Palmes tubes. Ihe regressicai of FH7D en CX»OT7 gives the equaticxi
PHTD = 2.8ppb + 0.94CX»Or7 (P=1121; d.f. 2,19; P >F 0.001) with an R^ of 0.97.
Ihis indicates a very hi^ degree of precisicai between OOTrtinuous monitors and
Palmes tubes. The regressicai of PKED cai HSOMJ yields the equaticai: PKED = 6.0
+ 0.64HSOai (F=192.3, 1,39 d.f., P > F 0.0001) with an R^ of 0.83. These data
indicate that thou^ chemiluminescent monitors provide a close e^proximatian of
perscaial expcjsure, Palmes tubes are more precise indicators of the variability
in perscaicil exposure. The variability between measures of the hcrae
microenvircMiment and personal ejqxasure is due, mcast likely, to to an individual
spending more time away frcm the fixed sairpler's microenvironment, as can be 2 . .
seen in the lower R for the summer monitoring seascai.
Table 4
Univariate Regressicai Ocmparing Perscaial and Microenvironment NO, Levels
regress
Model
3ion mcxaeis
(Y=X)
are signiric
Overall R^
HHD = OCMT? 0.97
HSa3N = (XMU 0.99 PKID = oorav 0.81 EMGH = O0NH7 0.90 PKID = HSOON 0.83
FMGM = IH7D 0.88
PKID = rH7D 0.85
PKID = HCM 0.69
r2
Summer Winter
0.91 0.97
0.96 0.99
0.48 0.81
0.79 0.90
0.48 0.83
0.74 0.87
0.45 0.85
0.40* 0.65
One of the initial aims in this study stuc^ was to see if personal exposure
levels differed significantly frcm week long In-hcme levels. Table 5 and
Figure 1 data shew overall and stratified (summer and winter) mean NO levels
for the five respcaise variables. The annual mean HSOCN level is 3.9 ppb lower
than HTZD (T=-3.43, P > |T|=0.001) ; all the other means are not significantly
different at the 0.05 confidencse level. Figure 1 is a graphic r^resentation
of soroe of the data in Table 5. Mean winter measures of perscmal esqxssure are
two tx> three times the corresponding sunnier levels. Winter values, however,
have much larger standard deviations, indicating a wide range of source use.
The paired difference T test for the stratified data set indicates that the
sunaner NO^ levels r^xarted by HSOCSN were, cm the average, 2 ppb less than
those reported by PKID (Tt^2.18, 19 d.f., P > |T|=0.042). This indicates that,
during the summer, HSOC»J is not as good an indicator of a child's exposure to
NO as PKTD IS.
Table 5
Mean NO Levels in Mcaiitored Hemes (ppb)
CXDNH? EH7D HSCON PKID HCM
Mean +S.D. 17.7 +33.9 19.5 +32.6 16.6 +29.6 16.6 +20.7 16.3 +19.8
Range 2.0-173.9 1.9-152.1 2-139.6 1.4-98.9 2.6-106.2
n = 40 40 40 40 38
Mean N0_ Levels by Season (ppb)
SUMMER CCMH HTZD HSOON PKID HO!
Mean +S.D. 7.7 +4.9 10.0 +8.7 7.3 +4.3 8.7 +5.6 9.3 +4.5
Range 2.0-20.4 1.0-32.2 2.2-18.0 1.4-19.7 2.6-18.9 n = 20 20 20 20 19
WlNl'ER
Mean ±S.D. 27.7 ±45.0 29.3 +42.5 25.8 +39.0 23.9 +26.4 23.2 +25.4
Range 2.1-173.9 1.2-152.1 4.0-139.6 1.9-98.9 4.2-106.2
n = 20 20 20 20 19
_c^
o
a 2 m a. a.
40
35
-30
25
20
15
10
5
-0
ConHT PH7D HSCON PKId PMOM
Palmes Tube and Continuous Means
\W winter
/ /\ Summer
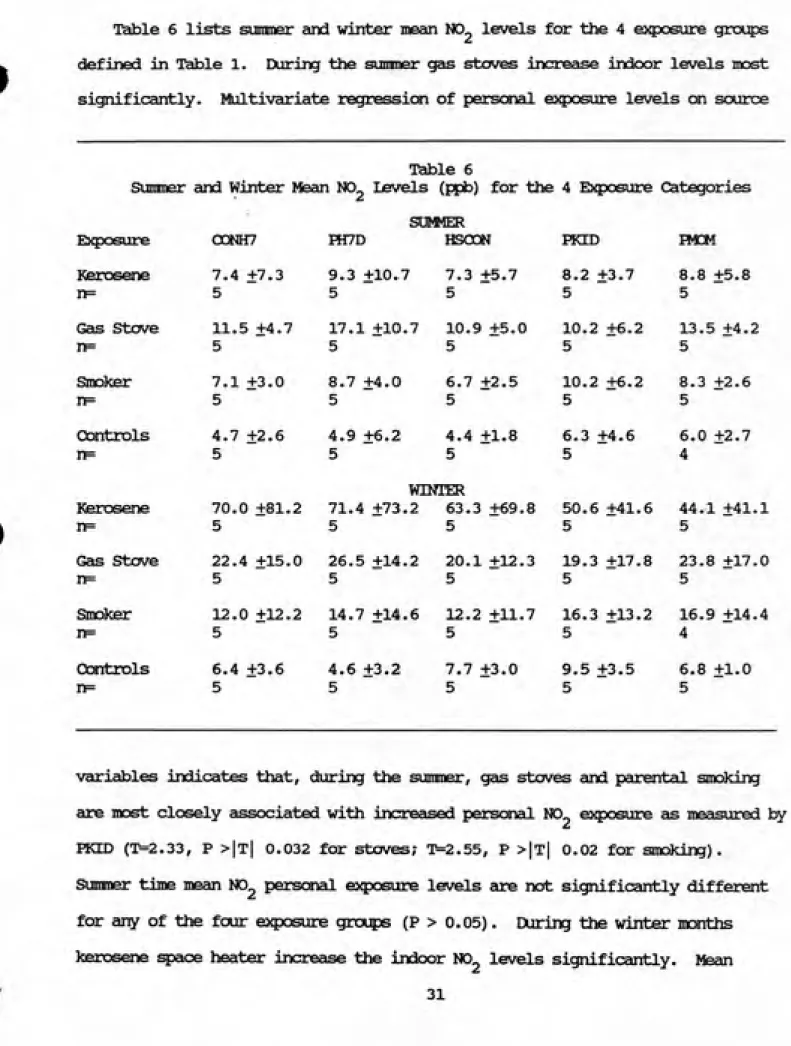
Table 6 lists summer and winter mean NO- levels for the 4 ej^xDsure groins
defined in Table 1. During the sumner gas stoves increase indoor levels most significantly. Moltivariate regressicai of perscaial ejqxasure levels on source
Sumner
Table 6
and Winter Mean N0_ Levels (ppb) for the 4 E}$X)sure Categories
Exposure CCSNH7
SUfMER
HT/D HSODN FKID B«M Kerosene n= 7.4 ±7.3 5 9.3 ±10.7 5 7.3 ±5.7 5 8.2 ±3.7 5 8.8 ±5.8 5 Gcis Stove n= 11.5 ±4.7 5 17.1 ±10.7 5 10.9 ±5.0 5 10.2 ±6.2 5 13.5 ±4.2 5 Smoker n= 7.1 ±3.0 5 8.7 +4.0 5 6.7 +2.5 5 10.2 +6.2 5 8.3 +2.6 5 Controls nF= 4.7 ±2.6 5 4.9 +6.2 5 4.4 ±1.8 5 6.3 +4.6 5 6.0 +2.7 4 Kerosene n= 70.0 ±81.2 5 WlNi'ER
71.4 +73.2 63.3 +69.8
5 5
50.6 +41.6 5
44.1 +41.1 5
Gas Stove 22.4 +15.0 5 26.5 ±14.2 5 20.1 +12.3 5 19.3 ±17.8 5 23.8 +17.0 5
Smdlcer 12.0 ±12.2 5 14.7 ±14.6 5 12.2 ±11.7 5 16.3 ±13.2 5 16.9 ±14.4 4 Craitrols n= 6.4 +3.6 5 4.6 ±3.2 5 7.7 +3.0 5 9.5 +3.5 5 6.8 +1.0 5
•
variables indicates that, during the summer, gas stoves and parental smoking are most closely associated with increased personal NO- exposure as measured by
FKID (T=2.33, P >|t| 0.032 for stoves; T=2.55, P >|t| 0.02 for smoking).
Sumner time mean NO2 persaial ej^xjsure levels are not significantly different
for any of the four exposure gnxps (P > 0.05). During the winter iKaiths
kerosene space heater increase the indoor NO- levels significantly. Mean
L^UyueueebaQBOSG 0000030,eaBd D^e^BQit
m^
^i^^^f^f^^
. n Mt (niNin-i - — xiio', .VON mvdjna rjouvoor
., O o C O C .Q..G C'000000(J'<.,:U0OOUc;0'vJ00uOt50
Figure 2. Chemiluminescent monitor strip chart trace of NO levels during
kerosene heater use. One percent on the Y axis is equal to 4 ppb NO ; chart
80
o z
a.
D. o o
01
> (U
0) OJ 3
OJ x:
m
nj C
0) o c
CL,
70
-60
50
40
30
20
10
-/
1^ /. -^ I 1/ / / I___[/ / /
'ͣ' -. ' 'ͣ I///I l/Z-Zi1.9 4.8 18.4 19.2 19.7 19.8 48.3 93.2 98.9
PKTD Weekly N02 Levels for 9 Subjects
Figure 3. Comparison of continuous and Palmes tube personal monitoring data: 9 subject's
exposure to NO levels greater than 100 ppb. This bar chart compares personal exposure, as
measured by PICID, and peak exposure levels, expressed as a percentage (ratio of elapsed time >
100 ppb NO^/total elapsed time monitored »100) of the monitored week with levels greater than
f.:
Pr
VI,
O n a. Q. o
o
/S
01
>
0)
at 3
01
01 00
a c
ot
o 0) a.
60
70
<30
50
40
30
-20
/O
-0 / / /1 l> > > ͣ 1/ / / I 1/ /T /1 fT-Tm
;p.3 ;a.7 16.4 20.6 21.9 33.6 45.3 65.9 106.2
i
PMOM Weekly N02 Levels for 9 Sutjects
Figure 4. Comparison of continuous and Palmes tube personal monitoring data: 9 subject's exposure to NO levels greater than 100 ppb. This bar chart compares personal exposure, as
measured by PMu/1, and peak exposure levels, expressed as a percentage (ratio of elapsed time >
levels in the kerosene heater heroes are, on the average, more than two times
the levels in gas stove hcnes and ten times the mean NO- levels of the control
grot?) homss. Personal ei^xasure levels follow this same pattern, and
multivariate regression using the three souroe variables indicate that stoves
and kerosene heaters ej^lain 63% of the variability in perscHial N0_ levels (P >
0.05). In the winter time parental smoking is not significantly associated
with a c±iild's perscsial NO- ei^josure, but this is mcsst litoely due to the much
stronger gas stove and kerosene heater scuroe variables, since previcxis
research (Leaderer, B.P. et al., 1986) and the sunmer seascsi mcaiitoring results
from this stuc^ indicate that smoking is associated with a small but
statistically significant 3-5 ppb increase in indoor levels.
Figure 2 is a photocopy of a continuous monitor strip chart from a heme
v^ere a kerosene mcaiit:or was being used. IfO levels c^proached 300 ppb and
stayed above 100 ppb for more than an hour. Ihis suggests that mean values, as
measured with Palmes tubes, do not reflect ejqjosure levels actucilly existing
vJiile sources are in use.
Figures 3 and 4 investigate the relaticxiship between average e>5X3sure, as
measured by Palmes tubes, and peak exposure level data collected using
chemilxjminesooTt mcxiilaDrs. In 40 weeks of in-^icroe mcxiitoring there were 9
weeks with at least cxie peak of 100 ppb or greater, and 7 of these were during
the winter mc^iitoring seascxi. 100 ppb NO was chosen as a reference point
because that is the lowest ocax3entraticai at vAiicti hijman esiposure research
surest adverse effects in sensitive individuals (USEPA, 1982). Regression of
EH3M CTi percentage of the week with levels > 100 ppb indicates that HCM
2
(R =0.85) reflects source vise more closely than FKTD. Ihis would indicate that
mothers sp&nd more time in and around ocnbusticxi sources than their children.
Discussirai
Palmes Tube Reliability and Personal Mcaiitoring
NO- msasuremaits taken in the same static locaticxi with both
chemiluminesoent N0_ analyzers and Palmes tubes gave very similar results.
Henoe it ^jpears that Palmes tubes provide a reliable measure of in-home NO
levels. However, c±temiluminescent monitors and Palmes tubes do not give the same measurement of personal N0_ ej^XDSure, presumably because it is not
possible for stationary mcaiitors to estimate personal exposure as well as
Palmes tubes. Palmes tube perscxieil mcaiitoring provides the best measure of net
exposure for individuals, especially during the sunner months vAien people spend
more time with windcws open, outdoors, and/or away frotn ocrabustion sources. It
is cLLso clear from the data in Tables 4 and 5 that mcaiitoring a mother is not a
substitute for mcaiitoring her child. Total NO- exposure is more easily
predicted with in^ione mcaiitoring of than by mcaiitoring a family member: the
2
correlation between FKCD and FMCM (R =0.69, 0.4 during the summer) is not as
strc3ng as the oorrelaticai between PKLD or HCM and any of the inHione data valvies (EH7D, CX3NH7). Apparently during the winter the home microenvirconent
provides a majority of an individual's e>$)osure to NO,. This si^jports earlier
research shewing that net perscaial expc3sure is determined by exposure in the
series of different micxoenvircaTments an individual passes throu^ each day
(Dockery et al., 1981).
Ihus Palmes tubes provide a ocawenient, reliable, and cost effective measure of mean N0_ exposwre and microenvircaiment levels. Ciiemilvtminescent
mcaiitoring equipment accjuisiticai, operaticsi, and maintenance ccasts run well
into the tens of thousands of dollars, d^sending on the cJuraticai and sccpe of
the stuciy. Palmes tubes cost $7.50 e^iec» to purchase and analyze, viiich
E2$x3sure Assessment
Ihe most inportant questicai in this stucfy is the relationship between peak
levels and net eaposure. The data in Tables 5 and 6 clearly shew that winter
time ccratustion appliance use provides a majority of an individual's annual net
e^qxDsure: winter NO averages are 15-50 ppb hi^ier than hemes without
ocnibusticai sources. Oliese results are ccxisistent with results of Spengler et
al. (1983) and Leaderer et ^. (1986) viio used Palmes tubes to assess indoor
levels, but not perscxial exposure.
Figures 2 and 3 ^ew the relaticaiship between peak NO, levels greater than
100 ppb, as measured in-^icroe 1:^ the continuous monitors, and net dose as
measured by an individual's Palmes tube. With only 9 weeks of data with peaks
greater than 100 ppb (7 of them occurred during the winter monitoring season,
with) it is difficult to make substantive ccxxjlusicxTS ccnceming peak es^xDSure
levels and their relation to average personal e^^xssure levels. Ihe data in
Figure 2 are inocxisistant, sinoe cx>e individual with very lew net exposure (1.9
ppb/week) lived in a heme vAiere peak levels were >100 ppb almost 10% of the
week (most of these in-4Kxae peaks occurred vdien the child was not at school).
One can only conclude that this child spent a majority of his time away frcm
cxxnbusticsi sources. Ihe regressicKi of either FKID or I901 on the percent^e of the week with levels greater than 100 ppb shews a feiirly strcaig correlaticai
between HCM and peak levels >100 ppb (P=39.6, P >F 0.0004), R^ = 0.85). Ihis
same relatiaiship is not nearly as strcaig for FKID, indicating that, in this
stucfy, children ^jent less t±ne near combustion sources than their mothers.
Ihis means that thou^ hi^ier average exposure and source informaticai could be
\jsed to predict the number of peak e}^)osure greater than 100 ppb NO^ cm a
weekly or annual basis, it is no substitute for direct personal real-time
monitoring. VBiether these levels translate into specific heeilth effects
cannot be said for tsertcdn, since the relationship between ejqxssure and effect
is not well defined. Ihe pending analysis of urinary hydroscyproline levels
frcm this populatitai could provide seme insist into the physiological
relationship between lung damage and peak levels, and perhe^JS help clarify the
eiqxDsure effect relaticxiship.
Sources of Bias
There are two itain sources of bias in this study. The first is self
protecticai. Tliis would bias the results by lowering NO- exposure, tut does not
seem significant in this case since NO- levels are still above the Palmes
threshold level. Moreover the levels found are ccxisistent with other