ABSTRACT
JODI S. BAKST. Assessing Data Quality for Life Cycle Assessment.
(Under the direction of Dr. Deborah Amaral)
Life cycle assessment (LCA) is an analytical decision support tool used to identify and evaluate opportunities to reduce environmental impacts associated with products, processes, packages, materials, activities. LCA has three primary components: development of a
quantitative life cycle inventory (LCI), conduct of an impact assessment (lA), and evaluation and
implementation of environmental improvements.LCAs typically use a multitude of data sources and types to draw important conclusions
about products and processes. Most LCAs released to date have included minimal data quality
evaluations. This document uses the concepts of quality assurance/quality control (QA/QC),
decision analysis, and the data reliability indicator system developed by Kollig, to develop a framework for the assessment of LCA data quality. The framework includes a quantitative
scoring system to evaluate LCA parameters against certain data quality indicators, and a system
of data quality worksheets and a data quality matrix to translate the information into a usable
ACKNOWLEDGMENTS
I would like to thank Dr. Deborah Amaral and Dr. Douglas Crawford-Brown for their
personal interest and guidance during the development of my Masters Technical Report. I am
also grateful to John Warren at Research Triangle Institute for his critical support in the
development of this document. Finally, I would like to thank my wonderful husband, Ron Evans,
for all his support throughout the last two years.
CONTENTS
Chapter Page
List of Acronyms...__...__...<....__... viii
I Introduction..---...---...---...—...—...—...—...—....—....1-1
1.1 The Current State of Data Quality Evaluation in LCA...1-2
1.2 What is Data Quality...1-3
1.3 Scope of Document...1-3
1.4 Overview of Document...1-41.5 Issues Outside the Scope of the LCA Data Quality Framework...1-5
1.5.1 Peer Review...1-5 1.5.2 Code of Good LCA Practice...1-61.5.3 Life Cycle Impact Assessment...1-6
n Data Quality Issues in Life Cycle Assessment ...2-1
2.1 Definition of Data Quality...2-1
2.2 Data Sources and Data Types Used in LCAs...2-2
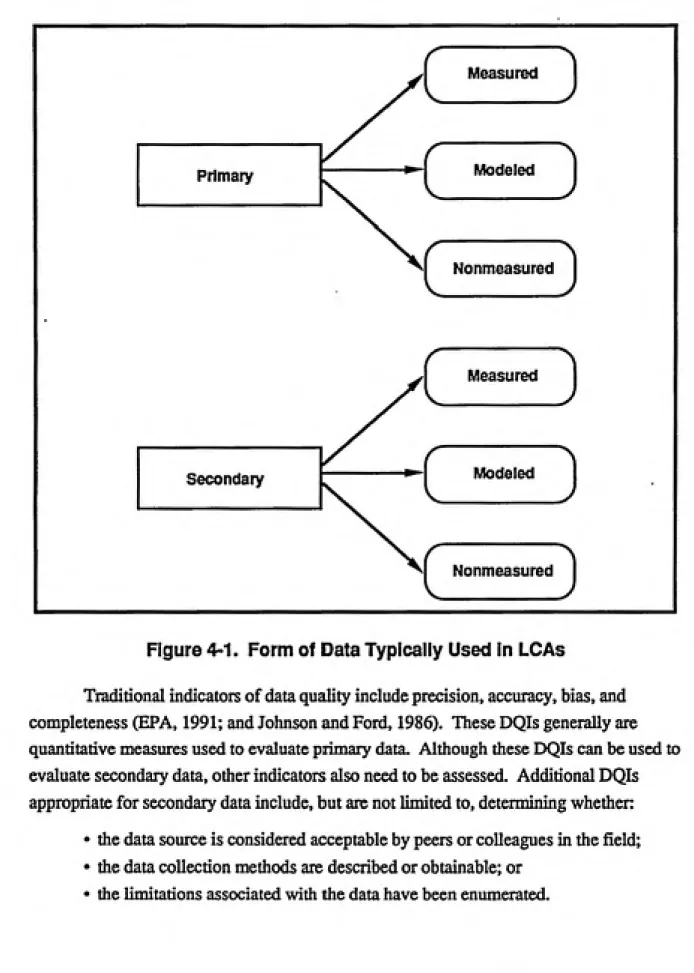
2.2.1 Data Sources...2-22.2.2 Data Types...2-3
2.3 Quality Issues for Different LCA Data Types...2-5
2.3.1 Primary Data...2-6
2.3.2 Secondary Data...2-6
2.3.3 MeasuredData...2-7 2.3.4 Modeled Data...2-7 2.3.5 Nonmeasured Data...2-82.3.6 Aggregated Data...'...2-7
2.3.7 Historical Data...2-8
CONTENTS (continued)
Chapter Page
in Incorporating Data Quality into Life Cycle Assessinents...3-1
3.1 Define the Scope of the LCA...3-1
3.2 Develop Data Quality Goals (DQGs)...3-4
3.3 Develop Input/Output Chart...3-4
3.4 Determine Data/Information Needs...3-6
3.5 Acquire Data...3-6
3.6 Determine Whether DQGs Were Met...3-8
3.7 Perform SensitivityAJncertainty Analysis...3-8
3.8 Evaluate and Select Data Compensation Methods...3-9
3.9 Assess Impact of Data Modification...3-10
3.10 Collect Additional Data, If Necessary...3-10
3.11 Assess the Quality of Assumptions, and Calculations...3-10
3.12 Acquire Additional Information to Refine Assumptions
andCalculations, If Necessary...3-10
3.13 Prepare Final Life Cycle Inventory...3-11
3.14 Conduct Peer Review...3-113.15 Conduct Impact Assessment (lA)...3-11
CONTENTS (continued)
Chapter Page
4.3.1 Precision...4-6 4.3.2 Bias...4-9
4.3.3 Accuracy...4-10
4.3.4 Completeness...4-11
4.4 Qualitative DQIs...4-12
4.4.1 Representativeness...4-12 4.4.2 Comparability...4-13 4.4.3 QA/QC...4-14 4.4.4 Acceptability...4-15
4.4.5 VerificationA^alidation...4-15
4.5 Additional DQIs...4-16
4.5.1 Description of the Data Collection Method...4-16
4.5.2 Enumeration of Limitations in Data Collection Methods...4-17
4.5.3 Provision of Statistical Measiu-es...4-18 4.5.4 Provision of Model Documentation...4-18
4.5.5 Enumeration of Model Limitations...4-19
4.5.6 Level of Data Aggregation...4-19 4.5.7 Accessibility...4-19 4.5.8 Reproducibility...4-20
4.5.9 Level of Reference...4-20
V Data Quality Assessment Framework for Life Cycle Assessments....___..5-1
5.1 DQI Hierarchy and Scoring System...5-1
5.2 DQI Scoring System...5-2
5.2.1 Explanation of Scoring System...5-5 5.2.2 Calculating the Data Quality Score...5-6
5.3 Relationship Between the Data Quality Score (DQS) and DQGs...5-6
';^^,^ •'•ͣ'^r.-vrv'^'- ͣ
#
CONTENTS (continued)Chapter Page
5.5 Data Quality Matrix...5-7
5.6 Justification for Using the Framework...5-7
5.7 Data Quality Framework: Example...5-11
VI Application of Sensitivity Analysis and Uncertainty
Analysis to Life Cycle Assessment Data...6-1
6.1 Deterministic Sensitivity Analysis...6-2
6.1.1 Tornado Diagrams...6-2
6.1.2 Two-Way or Three-Way Sensitivity Analysis...6-4
6.1.3 Ratio Sensitivity Analysis...6-5
6.2 Uncertainty Analysis...6-8
6.2.1 Sources of Uncertainty...6-8
6.2.2 Methods for Determining Uncertainty Propagation and
Analyzing Uncertainty...6-11
6.2.3 Applicability of Uncertainty Analysis to LCA
Data Quality...6-12
vn Methods to Compensate for Missing Data and Data Deficiencies ...7-1
7.1 Missing Data and Data Deficiencies...7-1
7.2 Methods to Adjust for Missing Data and Data Deficiencies...7-2
7.2.1 Imputation...7-2
7.2.2 Weighting Methods...7-7
7.3 Meta-Research...7-8
«
CONTENTS (continued)
Chapter Page
Appendix A: Quality Assurance/Quality Control Method...A-1
Appendix B: The NUSAP Method________._____.___________________B-1
Appendix C: Data Reliability Indicator....___...__...__...__.______..__.___..C-1
Appendix D: Data Usability...__... D-I
Appendix E: Bibliography...E-1
TABLES
Number Page
2-1 Examples of LCA Data Sources...2-4
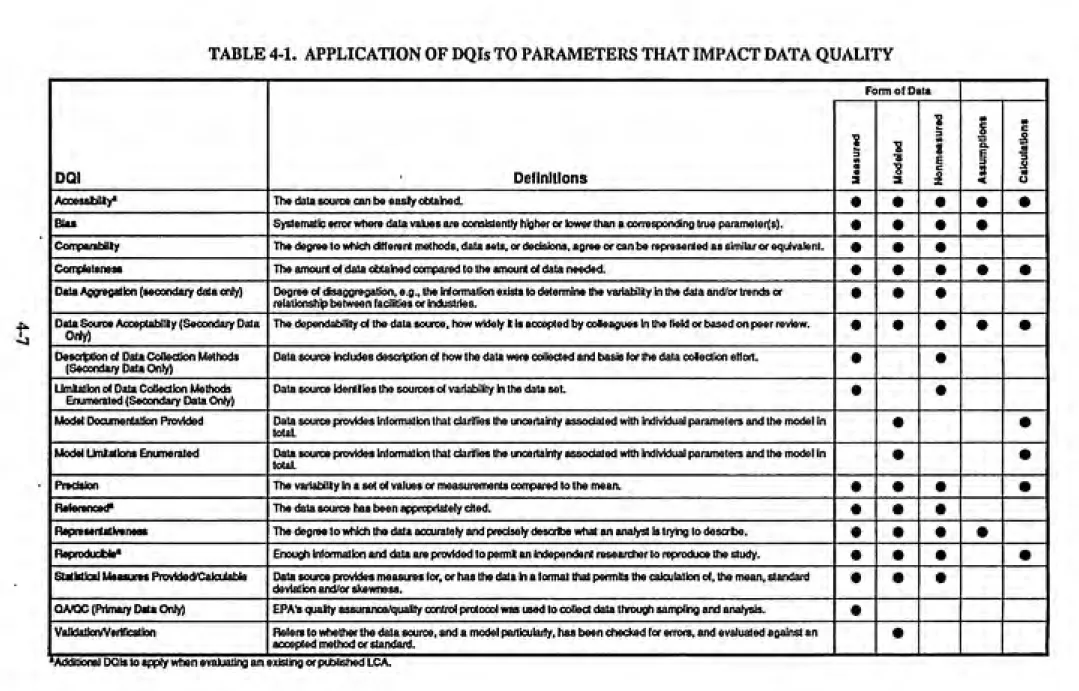
4-1 Application of DQIs To Parameters that Impact Data Quality...4-7
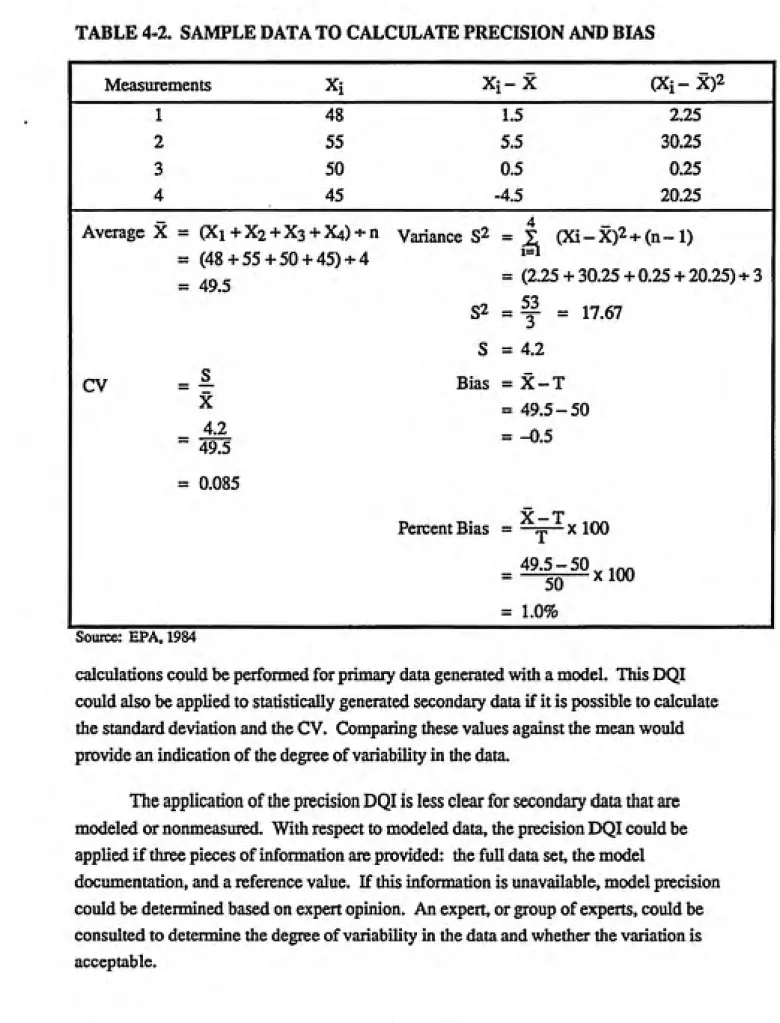
4-2 Sample Data to Calculate Precision and Bias...4-8
5-1 Worksheet: LCA Data Sources...5-9
5'2 Worksheet: Assumptions and Calculations...5-10
5-3 Example LCA Data Quality Matrix...5-11
6-1 Energy Sensitivity Analysis on Two Production Systems...6-7
FIGURES
Number Page
3-1 Life Cycle Inventory for Industrial Process...3-2
3-2 LCA Data Development Steps...3-3
3-3 Example Product Life Cycle Input/Output Chart...3-5
4-1 Form of Data Typically Used in LCAs...4-4
4-2 Four Combinations of Precision and Bias...4-11
LIST OF ACRONYMS
cv
DQG DQI DQO DQS DRI
DU
GDQP
lA
LCA
LCI
NUSAP
QA/QC QAPJP
SETAC
TRI
Coefficient of Variation
Data Quality Goal Data Quality Indicator Data Quality Objective Data Quality Score
Data Reliability Indicator System
Data Usability
Good Data Quality Practices Impact Assessment
Life Cycle Assessment Life Cycle Inventory
Numerical, Unit, Spread, Assessment, Pedigree Method
Quality Assurance/Quality Control Quality Assurance Project Plan
Society of Environmental Toxicology and Chemistry
Toxic Release Inventory
CHAPTER 1
INTRODUCTION
Life Cycle Assessment (LCA) is an analytical tool used to identify and evaluate
opportunities to reduce environmental burdens and associated impacts of products,
processes, packages, materials, or activities. Practitioners use this methodology to
analyze the entire life cycle of industrial processes by gathering data on, and assessing the
impacts from, raw materials extraction and processing; manufacturing, transportation, and
distribution; use/reuse/maintenance; recycling and composting; and the final disposition
of materials.
The LCA approach has three components:
• developing a quantitative life cycle inventory (LCI) of energy, resource use, and
environmental emissions to air, water, and land;
• conducting an impact analysis (lA) of the effects of these emissions on the
environment using the LCI data; and
• evaluating and implementing opportunities to effect environmental
improvements.
LCA practitioners and researchers, however, consider goal definition and scoping
to be the fourth component of an LCA. These steps, which are taken prior to - or at the
outset of - an LCA involve linking the goals of the analysis with the extent or scope of
the overall study (EPA, 1992b). Goal definition entails identifying and defining the
purpose and objectives of the LCA, setting the boundaries for the analysis, and
identifying the study's overall data needs. LCA goals are revisited repeatedly to ensure
and maintain consistent definition throughout the conduct of the study. Scoping is used
to define the extent of coverage for an analysis. This includes identifying the process(es)
or product(s) to be evaluated, the impacts or system parameters of concern, users of the
study, and whether the analysis will be publicly available (i.e., internal versus external),
and absolute or comparative. In short, goal definition and scoping is viewed as a key
phase in the LCA process because practitioners use it to define the overall purpose and
objectives of an LCA, based on known time and resource constraints.
To date, most practitioners have compiled inventories and drawn conclusions
(e.g., the least or most environmental impact) based on simple data aggregation
techniques. Few practitioners have conducted actual impact analyses based on inventory
,i^=---j»^^*;j«.- 0^-.::
expected to conduct more impact analyses and improvement analyses . This document
follows current convention and uses the term "LCA" to refer to both the life cycle
inventory and life cycle impact analysis phases of an LCA.
A variety of organizations use the LCA methodology to serve a number of
different purposes. Companies use LCA results internally to support management
decisions on production processes, product design, and product packaging. Companies
also use LCA results externally to advertise a single product or advocate one product over
another. Government agencies use LCA results to support both policy and regulatory
decisions. Consumer and environmental groups also utilize LCA results to compare the
environmental "friendliness" of competing products.
LCAs require the acquisition and synthesis of significant amounts of data. Given
the data-intensive nature of this methodology, and the important decisions that are made
based on LCA results, data quality is a critical concern. LCA practitioners usually
imdertake some level of data quality evaluation. However, the rigor with which that
evaluation is applied, and the extent to which LCA reports discuss data quality varies
significantly. Important problems can arise if LCA results are based on data of poor or
inadequate quality. For example, if internal analyses are conducted, misleading results
could cause costly process or product decisions. Conclusions based on external analyses
where poor data were used could result in misleading the pubhc in the belief that one
product is superior to another. Due to concerns such as these, there is a growing
consensus among LCA practitioners that data quality evaluations need to be incorporated
into LCAs more formally and the results discussed more fully in future LCAs (ADL,
1993)
1.1 THE CURRENT STATE OF DATA QUALITY EVALUATION IN LCA
Data quality evaluations typically are found in studies that contain primary data
(i.e., facility-specific, measured, monitored, or estimated data). When primary data are
unavailable, however, analytical tools such as LCA often rely on secondary data sources
(i.e., data collected for a different purpose than the LCA being conducted). Currendy,
there is a lack of formal guidelines to assess the quality of data other than those generated
pursuant to statistical protocols. Practitioners recognize that because the decisions that
come out of LCAs are used in influential ways, there is a need to develop appropriate
data quality assessment procedures. On a general level, practitioners have suggested
evaluating LCA data quality against traditional data quality indicators, such as accuracy,
representativeness, and completeness, and employing sensitivity analysis to determine the
most sensitive LCA parameters (SETAC, 1991; EPA, 1992b). This document discusses
the applicability of these and other approaches to an evaluation of LCA data quality.
1.2 WHAT IS DATA QUALITY?
What does it actually mean to have good data quality? From a philosophical
standpoint, there are two components of data quality. Some would argue that the sole
basis for determining if data are of good quality is whether they represent, or correspond
to reality. Others would argue, however, that good data quality depends not only on their
correspondence, but their intended use. In other words, for data quality to be considered
"good," data must both reflect what they are supposed to, and be applicable to the
particular simation under evaluation. The following pages provide a framework for
assessing the quality of data used in LCAs. Under this approach, data quality evaluations
are based both on what the data represent and how the data are applied.
13 SCOPE OF DOCUMENT
This document presents a framework for evaluating LCA data quality and
translating this information into a usable format that includes a quantitative data quality
scoring system, data quality worksheets, and an LCA data quality matrix. The document
discusses where and how data quality should be considered when conducting an LCA,
what type of data quality goals should be set, and what data quality indicators are
appropriate based on the type of data used in LCAs. The document also defines good
data quality practices (GDQPs) for LCAs. This process includes incorporating the results
of data quality evaluations into LCA reports to both increase the transparency of LCAs
and enhance their overall credibility.
Users of this document may include
• practitioners who are conducting LCAs,
• analysts who are working to develop and improve LCA methodologies,
• analysts who need to assess the quality of data used in existing LCAs, and
• decision makers who use LCA results.
The framework presented below provides a systematic approach for assessing
methodological rigor to the data quality evaluation process. Even though the scoring
system may be time consuming in the early stages of its use, it will provide LCA
practitioners with increased confidence to accept or reject LCA data sources, and
ultimately in LCA results.
Although practitioners should consider and incorporate data quality evaluations
into all LCAs, the framework is most applicable to external analyses. Unlike internal
LCAs, results of external analyses are made publicly available. Practitioners use external
LCA results to educate the public about products and processes, or to advocate a
particular public policy issue. Given the public nature of the information, identifying the
accvuacy of LCA results is an important concern. If practitioners conducting external
analyses evaluate data quality, and summarize the results according to the framework set
forth in this document, users or recipients of the analyses will have increased confidence
in LCA results.
1.4 OVERVIEW OF DOCUMENT
Chapter 2 reviews the data sources and data types typically used when conducting
an LCA and discusses potential problems Avith data quality. Chapter 3 provides a flow
chart of the steps associated with building the inventory component of an LCA, during
which essentially all of the data are collected, and discusses the implications for data
quality at each step.
Chapter 4 explains the concepts of data quality goals (DQGs) and data quality
indicators (DQIs) and describes specific DQIs applicable to evaluating LCA data quality.
Chapter 5 outlines a quantitative data quality scoring system based on DQGs and DQIs
and provides report cards and a data quality matrix as a means to translate the information
into a usable form. Chapter 6 reviews sensitivity and uncertainty analysis methodologies
and their potential applicability to LCA. Chapter 7 discusses methods for handling
missing data and data deficiencies found in LCA data sources. Chapter 8 summarizes the
information presented in this document into a set of GDQPs for LCAs.
Appendices A through D provide information on alternative data quality
assessment methodologies and discuss their applicability to assessing LCA data quality.
Appendix A reviews traditional, statistically based procedures, referred to as the "quality
assurance/quality control" (QA/QC) method. Appendices B through D present three
qualitative approaches to data quality assessment: the Numerical, Unit, Spread,
Assessment, Pedigree (NUSAP) method developed by Funtowicz and Ravetz (1990); the
Data Reliability Indicator (DRI) system developed by Kollig (1987); and the Data
UsabiUty (DU) criteria developed by EPA (1990).
1^ ISSUES OUTSroE THE SCOPE OF THE LCA DATA QUALITY
FRAMEWORK
In addition to data quality concerns, three issues are important to the problem of
increasing the transparency of LCA results: the development of an LCA peer review
process, a code of good LCA practice, and a framework for conducting life cycle impact
assessments. It is beyond the scope of this framework to define or discuss any of these
issues in detail Rather, they are addressed only in their relationship to LCA data quality
concerns.
1.5.1 Peer Review
The Society for Environmental Toxicology and Chemistry's (SETAC) document,
'Technical Framework for Life-CIycle Assessment," indicated that peer review is a
necessary and important step to ensure the technical and scientific credibility of LCAs.
In response, SETAC identified an LCA Advisory Group that developed an Interim Peer
Review Framework (SETAC, 1992b). The framework recommends, among other things,
that a peer review panel be established at the beginning of any LCA, and that LCA
practitioners and sponsoring organizations have the panel review:
• the study purpose, boundaries, and data categories,
• the stand-alone data, and• the draft filial report.
In general, the Interim Peer Review Framework provides LCA practitioners and
sponsoring organizations with a recommended set of guidelines to begin incorporating
peer review into LCAs. As discussed below, the LCA data quality framework
recommends that peer or expert review be incorporated into the data quality assessment
process. The data quality framework, however, does not define an appropriate peer
review process for LCAs. Rather, LCA peer review procedures will continue to be
1^.2 Code of Good LCA Practice
There is growing interest in the need for a code of good LCA practice. The
inconsistency and uncertainty in LCA results has resulted in the recognition of the need
for a standardized LCA methodology (Denison, 1992). The LCA data quality framework
sets forth good operating principles for the evaluation and reporting of LCA data quality.
The framework does not, however, outline a code of good practices for the entire LCA
process. The development of such principles has been, and will continue to be,
undertaken by SET AC. In fact, this topic was the subject of a recent SET AC World
Congress workshop in Lisbon, Portugal (March 28-31,1993).
1^.3 Life Cycle Impact Assessment
Data quality concerns also exist when conducting the second phase of an LCA, a
life cycle impact assessment. This document discusses different data quality concerns
that may arise when gathering an inventory only or when conducting an impact
assessment. This document, however, does not discuss the framework for conducting an
impact assessment, or the broader issues related to this phase of an LCA. Rather, these
issues are addressed in EPAs draft final report entitied, "Life Cycle Impact Assessment
Parti: Issues"(EPA, 1993).
CHAPTER!
DATA QUALITY ISSUES IN LIFE CYCLE ASSESSMENT
Analysts use many different types and sources of data in LCAs. Some analysts
use primary data (facility-specific, measured, monitored, or estimated data), whUe other
analysts use secondary data (data collected for a different purpose than the LCA being
conducted). Primary and secondary data used in LCAs typically are of the following
types, measured, modeled, and nonmeasured. Understanding the potential problems that
can arise with different types and forms of data provides an analyst with a basis for
evaluating data quality. This chapter defines data quality in the context of an LCA,
reviews the data sources and data types commonly used by LCA practitioners, and
discusses data quality problems that can occur with various types and fomis of LCA data.
2.1 DEFINITION OF "DATA QUALITY"
The term data quality can take on a variety of meanings. For purposes of these
guidelines, data quality is defined as the degree of confidence an analyst has in a data
source or data value based on an evaluation of data quality goals (DQGs), data quality
indicators (DQIs), and the role of the data in an overall LCA. (See chapter 3 for a
detailed discussion of DQGs and DQIs.)
Data quality is tlie degree of confidence an analyst has in a data source or a
data value based on an evaluation of data quality goals (DQGs), data quality
indicators (DQIs), and the role of data in an overall LCA.
The quality of LCA data sources is influenced by the primary or secondary nature
of the data, the type of data employed (e.g., measured, modeled, or nonmeasured),.and
the level of data aggregation (e.g., individual plant or industry average data). For
example, secondary data sources are perceived as being less specific, and thus of lesser
quality, than acmal measured or monitored plant-specific data. Similarly, aggregated data
may provide littie indication of the variability in a parameter of interest, such as
facility-specific air emissions. Nonaggregated data, on the other hand, can be used to calculate
statistical measures such as the mean, standard deviation, and skewness to provide an
The remainder of this chapter defines data sources and data types typically used in
LCAs and discusses the data quality problems that can arise with different types and
forms of LCA data.
2J. DATA SOURCES AND DATA TYPES USED IN LCAs
Data used in LCAs come fix»m a wide range of sources and are of various types.
In discussing LCA data quality it is important to develop consistent definitions of these
terms. LCA data sources fall into several general categories (e.g., industry data,
government documents or databases, and the open literature). A data type is defined as
the data resulting from different data generation methods. Examples of different types of
LCA data include measured data (statistically based or nonstatistically based), modeled
data, and nonmeasured data (educated guesses or estimates).
Data source includes a number of categories including industry reports;
government documents, reports, and databases; journals; and reference
booths, etc.
Data type is defined as the data that result from different data generation
methods (e.g., measured, modeled, or nonmeasured data).
Example: A data source could be the Census of Manufacturers and the data
type could be measured data for SIC 2911.
2.2.1 Data Sources
Data sources have been defined fairly consistently throughout the LCA literature.
Although different documents have specified varying levels of detail with respect to data
sources, authors agree on the definition of a data source within the context of an LCA.
Generally, LCA data sources include the following major categories (SETAC, 1991;
EPA, 1992; EPA, 1991a; and EPA 1991b):
• industry data, reports, databases, or consultants,
• laboratory test data,
• government documents, reports, databases, or clearinghouses,
• other publicly available databases, or clearinghouses,
• journals, papers, books, and patents in the open literature,
• reference books (e.g., the Encyclopedia of Chemical Technology),
• trade associations,• related LCIs, and
• product/process specifications.
Certain LCA documents provide examples of data sources within two or more of
these categories. EPA's LCA Guidelines and Principles document indicates that sources
of government documents include the U.S. Department of Commerce Census of
Manufacturers; the U.S. Bureau of Mines Census of Mineral Industries; the U.S.
Department of Energy Monthly Energy Review; and EPA's TRI database (EPA, 1992b).
SETAC's 1991 LCA report also refers to data sources in general categorical terms and
provides specific examples of information sources within the different sovffce categories.
Table 2-1 provides additional examples of LCA data sources.
2^.2 Data Types
No prior attempt has been made to categorize, or define, different data types.
Rather, various terms, such as industry-average or annual data, have been used as
examples of different data types. Within the LCA context, the term "data type" has been
used to refer to:
• the level of data aggregation (e.g., industry average, annual, individual plant,
etc.) (SETAC, 1990; and EPA, 1992);
• the LCA input/output data category (e.g., energy, water, and raw material inputs
and waste stream outputs) (EPA, 1991a; EPA, 1991b), and.
• data resulting from different data generation methods (e.g., measured, modeled,
or nonmeasured data).
Multiple uses of the term data type can confuse discussions of LCA data quality.
Accordingly, for purposes of these guidelines, data type is defined as the method used to
ͣ
SW^V^^Wf-'iV-TABLE 2-1. EXAMPLES OF LCA DATA SOURCES
1 Data Source
Example SourceReference |
1 Industry Reports
SRI Industry ReportsStanford Research Institute 1
Electric Utility Reports
Electric Power Research 1
Institute |
1 Trade Associations
Utility Company DatabaseUtility Data Institute 1
American Iron and Steel Database American Iron and Steel 1 Institute 1 Coke and Coal Database
American Coke and Coal 1
Chemicals Institute 1
Wood Database
Western Wood Products 1
Association |
1 Industry Databases
Chemical Industry Competitive IntelligenceDatabase
Chemical Industry 1
Energy Infonnation Database
Energy Industry 1
Coal Database
Coal Industry 1
ECO Mine
Minerals and Mining 1
Industry 1
Related LCIs/LCAs Resource and Environmental Profile
Analysis of Polyethylene and Unbleached Paper Grocery Sacks
Franklin Associates, Ltd., 1
1990 1
Comparative Analysis of Selected
Characteristics of Disposable and Reusable Towels
Barber etal., 1977 1
Life-Cycle Analysis on PVC Packaging
Systems
Cascone, 1992 1
Resource and Environmental Analysis of High-Density Polyethylene and Bleached Paperboard Gable Milk Containers
Franklin Associates, Ltd., 1
1991 1
Comparative Energy and Environmental Impacts for Soft Drink Delivery Systems
Franklin Associates, Ltd., 1
1989 1
Environmental Effects of Different Packaging Systems for Fresh Milk
Mekel and Huppes, 1990 1
Govemment
Documents/Reports/ Databases
Monthly Energy Review
Annual Energy Outlook with Projections to
2010
Department of Energy 1
(DOE)
DOE 1
Manufacturers Energy Consumption Survey:
Con^mption of Energy 1988
DOE 1
Minerals Facts and Problems
Department of Interior (DOI 1
Minerals Yeartx)oli
DOI 1
Minerals Commodity SummariesDOI 1
continued
TABLE 2-1. EXAMPLES OF LCA DATA SOURCES (CONTINUED)
1 Data Source
Example Source Reference |Government
Documents/Reports/ Databases (continued)
Industry-Specific New Source Performance Standards
EPA 1
Industry-Specific Water Effluent Guidelines
and Water Quality Documents
EPA 1
Toxic Release Inventory System
EPA 1
Resource Conservation and RecoveryInformation System
EPA 1
Treatment, Storage, Disposal, and Recycling
(TSDR) Database
EPA 1
Lifecycle Assessment Methodology: DataNeeds and Development Task 1:
Identification and Evaluation of Existing Data and Infonnation
EPA (Draft) 1
Lifecycle Assessment Methodology: Data Needs and Development Task 2: Evaluation of the Need to Devetop New Information
EPA (Draft) 1
Journals/Papers/
Books/Reference Books
Journal of Air and Waste Management
Air and Waste Management 1
Association 1
Encyclopedia of Chemical Technology
Kitk-Othmer 1
Metal Statistics American Metals Market 1 "Energy Flows in Industrial Processes"Wall, 1988 1
Handbook of Industrial Energy AnalysisBoustead and Hancock |
Sources: RTI, 1992; SETAC, 1991; EPA, 1992; EPA, 1991a; and EPA, 1991b.23 QUALITY ISSUES FOR LCA DATA
Data used in LCAs can be categorized as (1) primary, or (2) secondary, and (3)
measured, (4) modeled, and (5) nonmeasured. Each data category and type can also be in
different forms, i.e., aggregated or nonaggregated, and historical. The type, category, and
form of data sources are not mutually exclusive. For example, a data source could be
10-year old estimated water emissions data for the facility under evaluation. If a data source
falls into multiple categories, data quality problems could be compounded. The
s^-j-1 ^^^g«^»^7?--"
2.3.1 Primary Data
Primary data are plant-specific, measured, modeled, or estimated data. In most cases, primary data are preferred for use in LCAs because they are specific to the product
or process being evaluated, and they are more amenable to assessing data quality
concerns. To date, however, companies doing or commissioning LCAs have classified their primary data as proprietary. Under this circumstance, the data and the associated collection methods have been unavailable for review or simply not released in a publicly accessible manner. In some cases, summary results are made available but they do not include the actual plant-specific data. Consequently, verifying the quality of these data can be difficult. If an LCA involves the use of proprietary information, the associated data quality rests solely on the reputation of the company providing the LCA results. Despite these shortcomings, plant-specific data, which tend to be more representative of what is being evaluated and thus of higher quality, are recommended highly for use in
LCAs.
Practitioners must be aware, however, that although plant-specific data generally have high quality, they are not always preferred to industry-based data as inputs for LCAs. Situations can arise where plant-specific data arc less representative than aggregate industry figurcs. For example, a steel can manufacturcr may buy steel on the metals market but may not be able to specify how or wherc the steel was manufactxired. In this case, an LCA that used plant-specific manufacturing data may be less
reprcsentative than data that reflect the mix of plants and processes that constitute the steel commodity market (ADL, 1993).
23 J, Secondary Data
Secondary data are those collected for a different purpose than.the LCA being conducted. Secondary data sources are more complex to evaluate from a data quality perspective because they come in various forms and types, and typically lack explanation of the data collection methods and the variability in the data. Secondary data may be specific to a product or process under evaluation, or they may be aggregated industry data. In the latter case, the data may require some form of manipulation to generate values suitable for use in LCAs (see discussion below on aggregated data). Based on these concems, it is recommended that, where possible and appropriate, primary data be used in LCAs. When primary data are unavailable, practitioners may have no other option but to use secondary data to fill in LCA data gaps.
23.3 Measured Data
Measured data are monitored or sampled data, or data generated from a census or
a survey. These data can be collected under statistically based or nonstatistically based
protocols. As indicated above, measured data can also be either primary or secondary in
nature. In addition to the concerns expressed above regarding primary and secondary
data, measured data present the following potential data quality problems. Monitored or
sampled data could be inaccurate due to the use of an inappropriate sample size, bias in
the monitoring or sampling devices, improper equipment calibration, or the continuous
misreading of measurement instruments. Problems with survey or census data could be
due to an inappropriately worded question, or some other flaw in the survey or statistical
protocol.
For primary data, the problems identified above can be minimized by carefully
designing an experiment, or using proper statistical procedures when employing
measurement and/or monitoring techniques. If primary data are collected for use in an
LCA, practitioners may want to consult a statistician to help determine the appropriate
sampling design and methods. For secondary sources, however, to understand the
problems associated with measured data, it is important, at a minimum, to have a
description of the data collection methods, or the statistical protocol. If a description of
the data collection methods is available, practitioners should consider consulting a
statistician to assess their validity.2.3.4 Modeled Data
Practitioners use models to generate data for LCAs, or they may rely on
secondary sources that use a model to generate the data. Models can be used to simulate
an industrial process, or estimate emissions from a production process. The potential
shortcomings associated with "modeled data" primarily pertain to how the model was
constmcted. To have confidence in simulated data, models should be both verified and
validated. Verification entails determining whether the model provides the correct
output. Validation techniques include using expert opinion to determine whether the
model presents an adequate representation of the process, or exercising the model to
reproduce an historical data set. A model that is not validated and verified may produce
It is easier to verify and validate primary rather than secondary modeled data.
With respect to primary data, practitioners should have access to their own models to
assess the accuracy of the results. Secondary data sources, however, may neither provide
the full model, which would enable a user of the material to assess the accuracy of the
model and the associated results, nor include information regarding the author's
verification and validation activities. If this, or similar, information is unavailable in
secondary data sources, practitioners may have difficulty determining the accuracy of the
model results.
23.5 Nonmeasured Data
Examples of nonmeasured data include plant-specific estimates or educated
guesses and data sources such as EPA's TRI (Toxic Release Inventory) database which
contains data collected annually on a certain segment of the chemical manufacturing
industry pursuant to a legal reporting requirement.
Nonmeasured data sources pose several potential problems. The data may be
aggregated and thus contain the shortcomings outlined in the aggregated data section
below. More importantly, however, many nonmeasured data sources describe neither the
methods used to collect or estimate the data nor whether mathematical, or other,techniques were employed to compensate for missing data and data deficiencies.
Assessing the quality of these data requires reviewing the evidence and assumptions that
went into deriving the value(s). Without sufficient understanding of how and why the
data were collected, an analyst could make biased inferences using the data. Unless
experts who developed the data can be consulted, or there is adequate peer acceptance of
the data source, the analyst may be unable to determine the extent of potential bias.
2.3.6 Aggregated Data
Aggregated data typically are presented as summary reported values. An
aggregated data set usually does not list the intermediate values that went into compiling
the data. The data aggregation process can eliminate valuable information (e.g.,
variability in the data) needed to evaluate the quality of a data set. Consequendy, the
quality of aggregated data can be more difficult to assess than nonaggregated data.
Aggregated data also may require some sort of manipulation (e.g., interpolation,
extrapolation, or back calculation) to generate a value suitable for use in LCAs. Any
•
uncertainty associated with the aggregated data could be compounded by the method
used to produce appropriate LCA data values. For example, the DOE Monthly Energy
Review contains a section with monthly and yearly totals for residential and commercial,
industrial, transportation, and utility energy consumption. Within each class of end
users, the data are broken down by the type of fuel used to generate the energy. To use
these data to perform an LCA on a product (e.g., tires), an analyst would have to make
assmnptions about the percentage of industrial energy consumption used in tire
production, the percentage of tire production attributed to each plant, and the percentage
of fuel used to generate energy for each plant. These percentages may be estimated by
using expert opimon/knowledge or based on a mathematical model. The level of
uncertainty in the aggregated consumption values could be compounded by the
uncertainties associated with any assumptions used in modifying the data.
Nonaggregated data may or may not provide fiirther information to assess data
quality. On one hand, nonaggregated data can be used to calculate such statistical
measures as the mean, standard deviation, and skewness which may provide an indication
of the central tendency and total variability in the data set. On the other hand,
nonaggregated data may be composed of inputs fipom different plants within the same
company. Differences in the data could be due to the way the parameter was measured
(e.g., direct measurements, statistical sampling, engineering estimates, modeling, etc.),
the different operating characteristics of the plants (e.g., fuel and raw material mixes,
regulatory requirements, etc.), or the period of measurement (episodic, continuous,
random sampling, daily/monthly/aimual, etc.). Under this scenario, nonaggregated data
may provide no additional useful information unless the other sources of variability also
are discussed.
2 J.7 Historical Data
Problems with historical data mainly concern the age of the data set. In
determining the age of a data set, the analyst should be concemed with the actual date the
data were generated, not simply the date of publication. For example, emissions data
published in 1983, could have been generated in 1981. These data would be 11 years old
in 1992, not 9 years old. Older data may not be representative of a current situation
because a process may have changed significantiy since the data were compiled. There is
no benchmark to determine whether a data set is too old. By reviewing the history of the
process and potential plant modifications, the analyst can assess whether the age of the
CHAPTER 3
INCORPORATING DATA QUALITY INTO LIFE CYCLE ASSESSMENTS
The LCI is the initial data generation and collection component of an LCA. As such, the quality of data used in an LCI directly affects the results of an LCA. SET AC (1990) and EPA (1992b) have prepared key LCA documents that outline the stages of an
LCI. SETAC and EPA indicate that an LCI should include data on:
• raw materials acquisition,
• manufacturing (which includes material manufacture, product fabrication, and filling/packaging/distribution,
• use/re-use/maintenance, and
• recycling/waste management.
Each stage of a life cycle receives inputs such as energy and raw materials and produces outputs such as waste streams (air, water, and solid/hazardous waste), recyclables, co-products, and final, or usable, products. Figure 3-1 shows the life cycle stages for an industrial process.
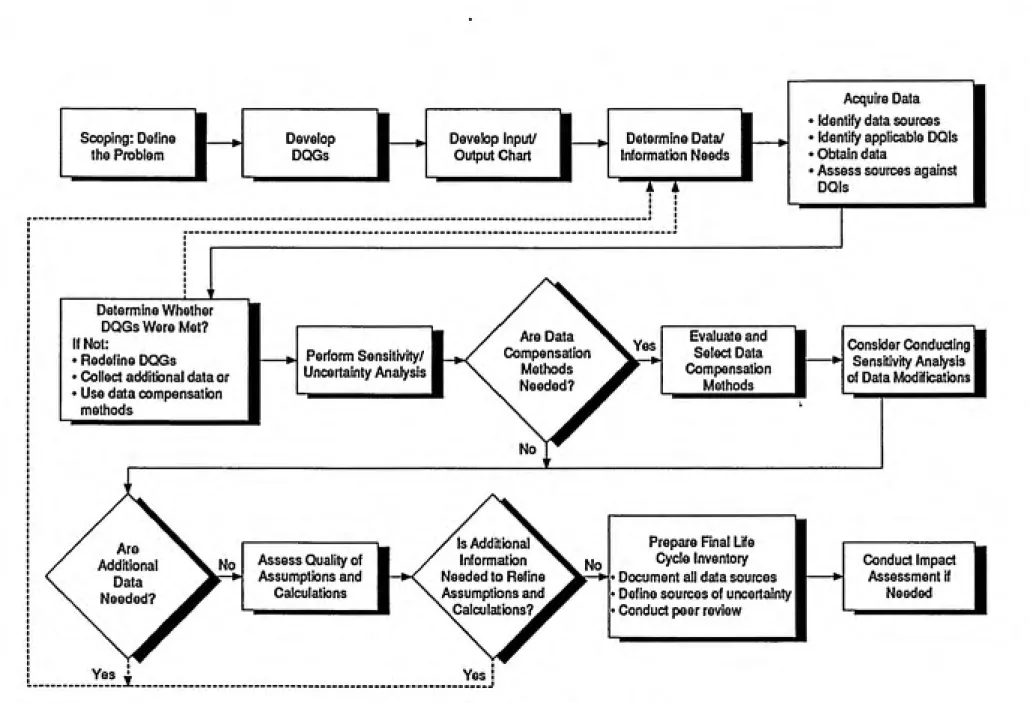
Figure 3-2 outlines the steps necessary to develop the inventory of data used to
conduct an LCA. In addition to providing a jframework for building a data base of life cycle data. Figure 3-2 identifies those points in the process where data quality should be
considered. The following sections discuss each step in the inventory development process and its relation to an evaluation of LCA data quality.
3.1 DEFINE THE SCOPE OF THE LCA
Life Cycle Stages
Inputs
Energy
Raw
Materials
System Boundary
Raw Materials Acquisition
Manufacturing
Use/Reuse/Maintenance
Recycle/Waste Management
Outputs Atmospheric
Emissions Solid Wastes Waterborne Wastes Co-Products Other Releases
Source (EPA, 1992b)
#
Scoping: Define
the Problem
H
DevelopDQGs
H
Develop Input/Output Chart
H
Determine Data/ Information Needs
i i
h
Acquire Data • Identify data sources • Identify applicable DQIs
• Obtain data
• Assess sources against
DQIs
Determine Whether DQGs Were Met?
If Not:
• Redefine DQGs
• Collect additional data or
• Use data compensation
methods Perform Sensitivity/ Uncertainty Analysis Are Data Compensation Methods Needed? Evaluate and Select Data Compensation Methods
H
Consider Conducting Sensitivity Analysisof Data Modifications
Are
Additional Data
Needed?
I
Assess Quality of Assumptions and
Calculations
Yes
Is Additional
Information
Needed to Refine
Assumptions and
Calculations?
Prepare Final Life Cycle Inventory
Document all data sources
Define sources of uncertainty Conduct peer review
Conduct Impact
Assessment if Needed
Yes I
Practitioners should also consider data quality as they define the scope of an LCA. They should consider the type of data needed for the analysis and the level of data quality necessary to support the intended purpose of the LCA. In addition to defining the overall purpose of the study, practitioners should determine, fix)m the outset, the steps and level at which they intend to stress data quality. With respect to data quality, practitioners should ask the following questions when defining the scope of the LCA:
• Will the data be used for an inventory only, or will they be used to conduct an lA?
• What type of decision will be made using the data, e.g., modifying a product or an industtial process, imposing a regulation, or comparing one product to
another?
• Can data commensurate with the scope of the study be acquired given the
available resources?
3.2 DEVELOP DATA QUALITY GOALS (DQGs)
In addition to defining the scope of an LCA the analyst should define the level of data quality that will be sufficient to support the study's purpose given available
resources. Data quality goals (DQGs) are specifications for the adequacy of data used in an LCA, or for certain LCA parameters used in an analysis. DQGs provide a framework
for balancing available time and resources against the quality of the data required to make a decision or statement of overall environmental or human health impact (EPA, 1986a). Practitioners should use DQGs as performance criteria (i.e., where data quality will be
stressed in the analysis) and measure their achievement by a documented, systematic evaluation of data quality indicators (DQIs).
Chapter 4 provides a more detailed discussion of DQGs.
3 J DEVELOP INPUT/OUTPUT CHART
After clearly defining the scope of the LCA, and the acceptable level of data quality, an LCA analyst should delineate the system with appropriate boundaries. This information is typically provided in an input/output chart or matrix, which identifies all inputs of materials to and outputs from an industrial process (see Figure 3-3). The
I
Muiu1wtur»rt/V«ndOfs of Input!
^ͣRtleasMtoAIr
0-FM»asMtoL<nd A -RdtasMtoWatar ExfacHon/ Production of Input! Manufacturing Inputs Supptlw I
I Chamlciit I r lnput<j
TIT
AOi
Uanufaoturlng/lnduatrlal Faolltty Dittrlbutora/RttallarB I Conaum*rs Poat-Conaum*r
Pra-Produdton Storagt of Inputs
T
A Production Ptocmms AOAtil
Splllt\
In-ProctM dotadtoop raqrdingn
hvplant racyding Off-alta Racyding Motarials ExchangasTIT
AOA A toKlnarirtlon A JL Traabnant Wastawatar TraatmantT
A (WlofDIictMrgo-^^ ^T /•H„-dou.NI WaMljnd
h*-V a«po«ti y
C Solid WMtt \.^.
UndOtipoMl J^^
AOA
H Post-production
,-Stoniga AOA
lit
Product AUaa Post-production Stoniga AOAm
AOAA A
U
SoldWaM LandUtpoul-)
Product Racyding AOA Producing RawMotorlal* to Bo U«*d In Product
Making Bnio Compenonta
of Product
w
Making tha ProduetIntarnal
Storaga
WDIatrlbutlonl ^^^^^ Httall I _ rl Product I Storage ITl "" F
Produet ^^ jDlapoaal or
Rsoyola
Tranaportatlon
important to note, however, that an LCA should indicate clearly where—and why— system boundaries have been drawn. It is possible for LCAs on similar processes to have different results, not due to differences in data quality, but due to where practitioners drew the boundaries of the analysis. If practitioners clearly identify the boundaries of their analysis, LCA results will be more transparent to users of the material.
3.4 DETERMINE DATA/INFORMATION NEEDS
The analyst's next step is to determine the appropriate data needs based on both the input/output matrix and the scope of the LCA. The inpui/output matrix, in
combination with the appropriate system boundaries, defines the data necessary for a complete inventory. The matrix identifies the inputs and outputs of the process being inventoried, and the secondary processes—^those not directiy involved in the production of the product such as energy and transportation—for which data may also need to be collected. The scope of the LCA also may affect the overall data needs. For
example, an analyst especially interested in air emissions may decide to put less emphasis on data quality (e.g., use estimated rather than measured data) for non-air releases. This lessened emphasis should be reflected in a statement of the LCA's purpose and the
associated DQGs.
3.5 ACQUffiE DATA
The data acquisition phase includes five parts: • identifying the appropriate data sources, • obtaining the data,
• identifying applicable DQIs,
• assessing the data sources against the DQGs and DQIs, and • collecting additional data, if necessary.
The data acquisition phase is an important point in the inventory process for assessing the quality of data soiurces. Most LCAs conducted to date have used a mix of
primary and secondary data. Assessing the quality of secondary data sources is difficult,
particularly because they typically do not contain raw data, statistical information, or other information that could be used to detenmne data quality. Regardless of the level of
difficulty, at this point in developing the inventory, the analyst should make an effort to determine the quality of the data source, be it primary or secondary. The results of such
an analysis can be used to indicate the uncertainty associated with various study
parameters and, based on available resources and the importance of the data component,
whether additional data sources should be consulted.
The next step is to select applicable DQIs. DQIs are qualitative and quantitative
measures used to evaluate data quality. Examples of DQIs include accuracy, age, representativeness, and precision. The analyst should select DQIs that correspond to the
data source (primary or secondary) and how the data will be used in the inventory. If data
from a secondary source are going to be used in an LCA, the analyst may need to interpolate, extrapolate, or back-calculate the data. For example, suppose an analyst has DOE energy consumption data for a particular industry, with the DOE data representing total domestic consumption by utilities for different energy sources, such as coal-based electricity. To determine the appropriate value that can be used in an LCA (i.e., for a facility or group of facilities), the analyst may need to back-calculate from the DOE aggregated data. If this is the case, the analyst will rely on his or her knowledge of the process to make the necessary assumptions and calculations. Under this scenario,
different DQIs will be necessary to assess not only the quality of the data source, but also the assumptions and calculations used by the analyst to generate LCA data values.
LCAs use various types of data, such as modeled, statistical, or nonmeasured data. Different DQIs also may be selected depending on the form of the LCA data. For
example, data generated through a statistical analysis could be evaluated in terms of whether a QA/QC process was used to generate the data, whereas data generated through
models could be evaluated based on whether the model was verified and validated.
Wholly different quality issues arise with normieasured data, such as whether the data source is widely accepted by peers or colleagues in the field.
The above discussion is written from the perspective of the practitioner
conducting the LCA data quality evaluation. However, data quality evaluations can also be conducted by analysts reviewing existing or published LCAs. In addition to the DQIs
described above, analysts reviewing existing LCAs may need to consider whether the
data are accessible, reproducible, and referenced.
Chapter 4 provides a detailed discussion of the DQIs that are applicable to
different types and forms of data used in LCAs.3.6 DETERMINE WHETHER DQGS WERE MET
Once data sources have been identified and assessed against all applicable DQIs,
it is appropriate to determine if the source meets the DQGs set after the scope of the study
was defined. If the DQGs are not met, practitioners have three options, they can:
redefine their DQGs,collect additional data, or
apply available and appropriate data compensation methods to fix problems with
die data.
This stage of the process stresses the iterative nature associated with setting and adhering
toDQGs.
3.7 PERFORM SENSHTVITY/UNCERTAINTY ANALYSIS
Evaluating the impact of different parameters on LCA results is important. For an
inventory, sensitivity analysis and, to a lesser extent uncertainty analysis, may be used to
evaluate these effects. Sensitivity analysis is used to examine the effects of changes in
inputs on model outputs (Morgan and Henrion, 1990; and Clemen, 1991), whereas
uncertainty analysis is used to evaluate the importance of input uncertainties with respect
to their relative contribution to the uncertainty in model outputs, or results (Morgan and
Henrion, 1990; Vesely and Rasmuson, 1984; EPA, 1985; and Finkel, 1990). If an analyst
knows which inputs have the greatest impact on system outputs, he/she can prioritize
parameters in terms of their necessary data quality. For example, if a sensitivity analysis
shows that waste generation does not change due to modifications in energy values (i.e.,
energy would be considered an insensitive parameter), the analyst could place less
concern on the quality of energy data. In other words, the results of sensitivity analyses
could identify where resources should be directed such that data quality is maximized for
the most "important" system parameters.
large benefit would be derived by focusing data quality resources on these parameters. Second, this technique, which includes such processes as error propagation, could be used to estimate the uncertainty in overall LCA results.
Chapter 6 provides a more detailed explanation of applications of sensitivity analysis to LCA data.
3.8 EVALUATE AND SELECT DATA COMPENSATION METHODS
An inventory could be missing pieces of data or contain data with gaps or deficiencies for a particular industry, facility, product or process. For example, data derived from surveys may be missing due to nonresponse by facilities receiving the survey (unit nonresponse) or missing data for specific items on a questionnaire (item nonresponse) (Lepkowski et al., 1987). The analyst may have identified these problems
during the previous evaluation of data quality. This step involves evaluating various data
compensation methods, such as imputation (e.g., proxies, deductive imputation, random
imputation overall, and hot-decking), different weighting methods, and meta-analysis and
selecting the approach most applicable to adjust for deficient data in the inventory. Data compensation methods are mathematical techniques that can be used to replace missing data and adjust for data deficiencies. Although these techniques are generally acceptable, they do not replace collecting additional, more applicable data. Imputation and weighting methods typically do not reduce the variability in the data set. Some forms of imputation, however, can reduce the variability of the data set and, hence, provide a false sense of precision. These techniques likely are best applied to the
parameters that a sensitivity analysis shows to be less important to the inventory. However, their use should be reviewed with statisticians familiar with relevant data compensation methods.
Compensating for missing data or data deficiencies may not be necessary in all cases. After performing sensitivity analyses, the analyst has the choice of correcting for
problems with the data or moving forward to assessing the quality of any assumptions or
calculations used to develop values for data in the inventory.
Data compensation methods are discussed in more detail in Chapter 7.
3.9 ASSESS IMPACT OF DATA MODIFICATION
If quantitative measures have been used to compensate for data gaps, deficiencies,
or missing data, the impact of this modification should be evaluated. If sensitivity
analysis has been used, the analysis could be repeated to determine whether modifying
the data changes the results of the analysis.
3.10 COLLECT ADDITIONAL DATA, IF NECESSARY
The collection of data may be done on an iterative basis. After evaluating a data
source against the selected DQIs, an analyst may decide to consult additional data
sources. The results of sensitivity analyses also may indicate where additional data may
need to be collected.
3.11 ASSESS THE QUALITY OF ASSUMPTIONS AND CALCULATIONS
Data used in LCAs may often come from secondary sources, such as government
reports/databases or aggregated industry data, rather than actual data from monitoring the
process of interest. In many circumstances, secondary data may not be in a form that can
be used ditectiy ui an LCA. For example, an often-used soiuce of energy constimption
information is DOE's Annual Energy Review. These data are aggregated for all utilities
that consume various sources of energy. To determine the energy consumption for a
particular facility or industry based on this information, a number of assumptions and
calculations may be necessary to calculate an ultimate value suitable for an LCA. In
cases such as this, data quality must be considered not only with respect to the data
source, but also with respect to the assumptions and calculations used to generate LCA
data values. Chapter 4 describes the DQIs used to evaluate assumptions and calculations.
3.12 ACQUIRE ADDITIONAL INFORMATION TO REFINE ASSUMPTIONS
AND CALCULATIONS, IF NECESSARY
Based on the results of evaluating assumptions and calculations against the chosen
DQIs, the analyst may determine that his/her knowledge of the process was insufficient to
develop adequate assumptions and subsequent calculations. Under these circumstances,
3.13 PREPARE FINAL LIFE CYCLE INVENTORY
A final inventory should include explicit information regarding the quality of the
data and assumptions used throughout the report. An LCA should include a review of the
appropriate sources against the applicable DQGs and DQIs. Similar results should be
included for the review of the assumptions and calculations employed when the data
could not be used directly in the inventory. This information will provide an indication,
and allow for an outside assessment, of overall data quality.
To the extent possible, the sensitivity and uncertainty associated with each
important parameter (or class of parameters) used in the analysis also should be reported.
In addition to indicating data quality, the report should identify the degree of variation in
each parameter. This information is important to understanding the total variabUity in the
results, regardless of whether it will be used solely as an inventory or as part of an lA.
3.14 CONDUCT PEER REVIEW
Peer review is an important aspect when publishing any type of study, technical or
nontechnical, that is used to state a position, advocate a point, or make a decision. Peer
review typically is used in scientific fields and is increasingly being applied to the field of
policy analysis (Morgan and Henrion, 1990). Peer review is equally important for
assessing LCA data quality. Data typically come from disparate sources with multiple
problems and are combined to fit into the LCA framework. This process involves
creativity, expert judgment, and many assumptions. Opening an LCA to peer review to
include an assessment of data quality will provide the LCA external credibility.
Practitioners conducting external LCAs should consider distributing the analysis
for peer review. However, if the LCA is for internal use only, it may be unnecessary to
peer review the document based on issues of confidentiality and cost.
3.15 CONDUCT IMPACT ASSESSMENT (lA)
Practitioners base LCA results on inventory data only, or on the application of
environmental and human health impact assessment methodologies to the data collected
in the inventory. lAs are concerned with determining such criteria as the number of
deaths or sicknesses, or the extent of contamination or exposure, caused by the release of
potentially harmful pollutants or materials. This contrasts with using inventory data to
simply assess the magnitude of outputs due to various inputs. Conducting an impact
assessment typically involves using a range of models and analytical methodologies, such
as fate and transport models, health impact assessment models, dose-response models,
and uptake models, which tend to require the use of plant- or site-specific data rather than
aggregated data. Based on the criteria and models used to conduct lAs, this phase of an
LCA may dictate the type of data needed in the inventory. This does not imply, however,
that one phase of an LCA calls for higher or lower data quality than another. Rather,
given a practitioners available time and resources, each phase of an LCA should use data
CHAPTER 4
DATA QUALITY GOALS AND DATA QUALITY INDICATORS
This chapter and Chapter 5 provide a framework for assessing LCA data quality,
which can be used by LCA practitioners, analysts working to develop and improve LCA
methodologies, and users of LCAs. There are three aspects to this task. First, as with any
analysis using environmental data, data quality goals (DQGs) must be set that define the
level of data quality sought in the overall analysis, or in individual parameters used in the
analysis. Second, benchmarks, typically referred to as data quality indicators (DQIs),
must be identified and used as measures of whether the DQGs have been met Third, the
results of this analysis must be documented in the final analysis. This procedure parallels
closely the traditional quality assurance/quality control process used to evaluate the
quality of primary environmental data (See Appendix A).
DQGs and DQIs are discussed in this section. Sections 4.1 and 4.2 explain and
define the concepts behind these terms in the context of evaluating LCA data quality.
Sections 4.3,4.4, and 4.5 discuss specific DQIs that can be applied to an assessment of
LCA data quality. Where possible, examples have been provided to make the
information more accessible to LCA practitioners and analysts. Chapter 5 provides a
framework for applying DQGs and DQIs to an assessment of LCA data quality and a
mechanism for translating this information into LCA data quality worksheets and an
overall data quality matrix.
4.1 DATA QUALITY GOALS (DQGs)
LCA is a methodology used to evaluate environmental releases and resource
consumption and the consequent environmental and human health impacts associated
with a product, process, or material. Results from these analyses are used for a variety of
purposes: by companies internally for decision-making, externally for communicating
information about a product or advocating or promoting one product over another, and by
government agencies for policy and/or regulatory decision-making. To have confidence
in LCA results, it is necessary that analysts consider and evaluate the quality of the data
used in the analysis.
Data quality goals (DQGs) are specifications for the adequacy of data used in
ͣ
a5^»?f3>^il-^ '^-i..-»^,-^p=^
An important first step in a data quality evaluation is defining data quality goals.
As indicated in Chapter 3, once the scope and boundaries of an LCA have been
determined, DQGs should be enumerated. DQGs are specifications for the adequacy of
data used in an LCA, or for certain LCA parameters. DQGs serve two primary purposes:
• structuring an approach for data acquisition, and
• serving as data quality performance criteria (e.g., data are evaluated against
DQIs to determine whether DQGs have been met).
DQGs are qualitative statements that indicate the level of confidence required in
the input data to support LCA results. DQGs should identify the level of data quality
sought for the overall analysis, or for individual parameters used in the analysis. There is
no required number, or standard set, of DQGs for an LCA. Rather, given the scope of the
study, practitioners should determine the number of DQGs necessary for the LCA and
then tailor them accordingly. Examples of DQGs include:
• approximate data values are adequate for the energy data category,
• obtain air emissions data within a given range with 90 percent confidence, and
• use certified primary data for the recycling/re-use data category.
Defining and applying DQGs in an LCA data quality evaluation is a subjective
process. However, if DQGs are defined prior to assessing the quality of data sources,
they will help increase the clarity and transparency of LCAs. If LCA practitioners define
the scope of their analyses and the accompanying DQGs, two benefits will result: a
structure will be imposed that enables data to be quality controlled prior to its use in an
LCA, and users of the analysis will have sufficient indication of where the LCA gave
priority to data quality. LCA practitioners should make it a regtilar practice to report in
detail the objectives of the LCA and the related DQGs.
4J FACTORS AFFECTING THE CHOICE OF DQIs
After defining DQGs for an LCA, practitioners should specify which data quality
indicators (DQIs) will be used to evaluate LCA data quality. DQIs are the cornerstone of
any data quality assessment methodology. They are benchmarks against which data
quality can be assessed to ensure that the DQGs have been achieved. The identification
and analysis of DQIs helps to determine the level of confidence an analyst can have in the
•
Data Quality Indicators (DQIs) are data characteristics that serve as
t)enchmarks against which data quality can be assessed to ensure that
DQGs have been achieved.
An important aspect of assessing LCA data quality is determining which DQIs are
most applicable to the analysis. The selection of LCA DQIs is influenced by:
• the form of the data (i.e., whether the data are primary or secondary);
• manipulations made to the data (i.e., whether the data are modeled,
nonmeasured, or extrapolated, interpolated, or back calculated); and
• the type of data quality analysis being conducted (i.e., whether data quality is
being assessed during the conduct of the LCA, or by an analyst reviewing an
existing LCA).
Data Form