CLASSIFICATION MODEL FOR LEARNING
DISABILITIES IN ELEMENTARY SCHOOL PUPILS
*I.O. AWOYELU AND I.A. AGBOOLA
Department of Computer Science and Engineering, Obafemi Awolowo University, Ile-Ife, Nigeria.
*Corresponding Author:[email protected] Tel.
of these disorders may appear in the pre-school years, for example, difficulty learning names of letters or counting objects), but they can only be diagnosed reliably after starting formal education. It causes a child to have trouble in learning and using certain skills (David and Balakrishnan (2011). The affected children are neither slow nor men-tally retarded; they can be of average or above-average intelligence, they do not have any major sensory problems (for example,
ABSTRACT
Learning disability is a general term that describes specific kinds of learning problems. Although, Learning Disability cannot be cured medically, there exist several methods for detecting learning disa-bilities in a child. Existing methods of classification of learning disadisa-bilities in children are binary classifi-cation – either a child is normal or learning disabled. The focus of this paper is to extend the binary classification to multi-label classification of learning disabilities. This paper formulated and simulated a classification model for learning disabilities in primary school pupils. Information containing the symp-toms of learning disabilities in pupils were elicited by administering five hundred (500) questionnaire to teachers of Primary One to Four pupils in fifteen government owned elementary schools within Ife Central Local Government Area, Ile-Ife of Osun State. The classification model was formulated using Principal Component Analysis, rule based system and back propagation algorithm. The formulated model was simulated using Waikatto Environment for Knowledge Analysis (WEKA) version 3.7.2. The performance of the model was evaluated using precision and accuracy. The classification model of primary one, primary two, primary three and primary four yielded precision rate of 95%, 91.18%, 93.10% and 93.60% respectively while the accuracy results were 95.00%, 91.18%, 93.10% and 93.60% respectively. The results obtained showed that the developed model proved to be accurate and precise in classifying pupils with learning disabilities in primary schools. The model can be adopt-ed for the management of pupils with learning disabilities.
Keywords: Learning Disabilities, Classification, Principal Component Analysis (PCA), Multi-layer Perceptron Network (MLP)
INTRODUCTION
Learning Disability (LD) is a general term that describes specific kinds of learning problems among school pupils all over the world. It can be described as a type of neu-ro-developmental disorder that impedes the ability to learn or use specific academic skills (for example reading, writing or per-forming arithmetic), which are the founda-tion for other academic learning (American Psychiatrist Association, 2016). Early signs
Journal of Natural Science, Engineering
and Technology ISSN:
Print - 2277 - 0593 Online - 2315 - 7461 © FUNAAB 2018
blindness or hearing impairment) and yet struggle to keep up with people of the same age in learning and regular functioning (Upadhyay, Singh, Turkar and Singh, 2013). Learning disabilities are not caused by lack of educational opportunities, change of schools, poor school attendance or lack of instruction in basic skills but they are caused by genetic factors, medical factors (for example, poor feeding), environmental factors (such as poor teaching methods and child abuse) and some behavioural disor-ders (Igwue and Ashami, 2013). Kemp, Smith and Segal (2015) outlined many types of learning disabilities namely: dyslexia (difficulty with reading), dyscalculia (difficulty with mathematics), dysgraphia (difficulty with writing), dyspraxia (difficulty with motor skills), dysphasia/aphasia (difficulty with language), auditory pro-cessing disorder (difficulty in hearing differ-ences between sounds) and visual pro-cessing disorder (difficulty interpreting visu-al information); but most students affected have more than one kind of these disorders. Its behavioral characteristic varies across children; for instance, some children may be good in mathematics while their reading, spelling, spoken language, reading compre-hension and written expression will be con-siderably below average and vice-versa.
According to Kohli and Prasad (2010), a conventional method for evaluating a learn-ing-disabled child is to register the child for screening exercise and this is done in stages. The junior level learning disability specialist (for example, a school psychologist) carries out some tests in order to identify if the child has traces of learning disabilities. The child is then referred to a senior level learn-ing disabilities specialist (e.g. a clinical psy-chologist) for further screening. A final
specialist (e.g. a clinical neuropsychologist) before admitting the child in a special inten-sive counseling unit. Other diagnostic tech-niques for diagnosing learning disabilities include the use of discrepancy model, re-sponse to intervention, diagnostic and statis-tical manual and international classification of diseases among others. Classification is the problem of identifying to which of a set of categories a new observation belongs, on the basis of a training set of data containing instances whose category membership is known. This paper focuses on multi-label classification of learning disabilities in ele-mentary school children. It is based on the combination of Principal Component Analy-sis (PCA) as a preprocessing method and Multilayer Perceptron (MLP) for classifying pupils with learning disabilities in elementary schools into dyslexia, dyscalculia, dysgraphia, dysphasia; these can occur independently or in combination of any of these disorders. Theoretical background
There are a number of works on the diagno-sis and classification of learning disabilities in children using soft computing approaches. David and Balakrishnan (2011) developed a model for learning disabilities prediction us-ing decision tree and clusterus-ing technique. Information about learning disabled children was collected using checklist containing the signs and symptoms of learning disabilities in children. J48 algorithm was used to classi-fy the children into learning disabled or non-learning disabled with a classification accura-cy of 77.6%. K-means clustering algorithm was also used to create clusters of learning disabilities attributes into learning disabled or non-learning disabled. The classification result of J48 algorithm was compared with the result of Rough Set Theory (RST) algo-rithm and Learning from Examples Modules
J48 outperformed RST and LEM1 in terms of predicting key attributes for classifying learning disabilities in children but this study was limited to binary classification of learning disabilities in children. It could only classify that a child has learning disa-bility or not. David, Shereena and Raja (2014) addressed the importance of han-dling missing attributes values in LD pre-diction in children using closest fit algo-rithm for replacing missing attribute values and decision tree for classification. Their model achieved an accuracy of 95% with 90% confidence rule. The work showed that handling missing attribute values in datasets improves the classification accura-cy of the model but the model could only work for binary classification of learning disabilities in children. Jain, Manghirmalani, Dongardive and Abraham (2009) developed a computational model for diagnosing learning disabilities among primary-level school children. The study adopted single layer perceptron model of artificial neural network for diagnosing children as being normal or learning disabled. Their model showed 90% diagnosis rate but their model could only diagnose if a child has learning disabilities or not. Kohli and Prasad (2010) developed a model for identifying dyslexic students using multi-layer perceptron and stratified ten-fold validation technique. In-formation about LD children was collected using the result of reading ability test. Their study adopted artificial neural network for classification and further improved the per-formance of the system using stratified ten-fold cross validation method. Their model was able to classify potential dyslexic stu-dents into being dyslexic or non-dyslexic with a classification accuracy of 75% but only dyslexia was considered in the study, which is only one of the types of learning disabilities. Margaj and Purohit (2016)
per-formed a comparative study for predicting dyscalculia in primary school children. Their study compared the efficiency of Sequential Minimal Optimization (SMO) and naïve bayes classifiers using performance metrics (cross validation and percentage split). Result obtained showed that SMO gave an accuracy of 94.51% and naïve bayes gave an accuracy of 94%. This implies that SMO is a better classifier in predicting dyscalculia in children but only dyscalculia was considered in the study, which is one of the type of LD. Mishra and Kulkarni (2013) developed a model for classifying LD in children using Support Vector Machine (SVM). Infor-mation about LD children was collected us-ing result of curriculum-based test. Their model was able to classify children as having learning disabilities or not with an accuracy of 84.60% but their study was limited to bi-nary classification of LD extension could be made to multi label classification of LD. Al-so, the system was trained with limited da-tasets, more datasets would have produced a better accuracy. Muangnak, Pukdee and Hengsanunkun (2010) compared naïve bayes classifier and decision tree for classification of LD in students using the results of obser-vation of students by their teachers. Their observed result was used to classify children into learning disabled or non-learning disa-bled. Their classification result showed that decision tree classifier outperformed naïve bayes classifier in terms of percentage accu-racy of the model but this study was limited to binary classification of learning disabilities in children. Sabu (2015) addressed the im-portance of feature selection in predicting LD in school aged children. Their study used the Proportional Rough Set Relevance (PRS) method for feature ranking. Features with higher significance values were retained and sequential minimal optimization was applied to the features retained for predicting LD.
Result obtained showed that PRS method improved the model accuracy with an accu-racy of 97.60% but the model can only pre-dict if a child has LD or not.
Limitations of Existing Works: Existing studies have been on binary classification of LD i.e. diagnosing if a child has LD or not. Some studies selected one of the LD types and carried out a binary classification of the LD type. Binary classification of learning disabilities is not sufficient, hence, there is the need to for a classification model that can extend this. This study extends binary classification of learning disabilities to multi -label classification of learning disabilities, which is classifying learning disabled chil-dren into any of the classes: Dyslexia, Dy-scalculia, Dysgraphia and Dysphasia.
METHODOLOGY
This paper classifies learning disabled pupils in public elementary school into dyslexia, dyscalculia, dysgraphia, dysphasia and these
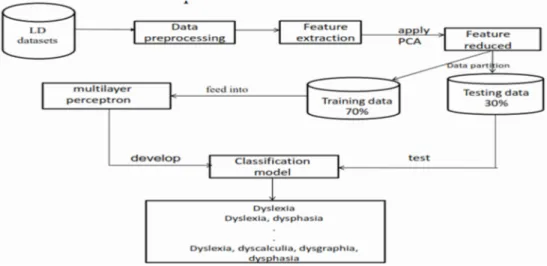
can occur independently or in combination. There can be fifteen categories of learning disabilities when considering four learning disabilities types. The approach used to col-lect the LD datasets is by using the LD-Checklist designed by the National Center for Learning Disabilities in the year 2007. This is a standard checklist that contains the signs and symptoms of learning disabilities in children. The dataset was preprocessed in order to remove some redundant features that will not contribute to the classification accuracy. Also, the dimension of the LD fea-tures was reduced using Principal Compo-nent Analysis. The reduced features were divided into training and testing set on a ra-tio of 70:30. The training set was fed into the multilayer perceptron network in order to build the classification model and the testing set was used to test the performance of the model training. The model was further eval-uated using precision and accuracy as perfor-mance metrics. The proposed LD-classification model is depicted in Figure 1.
Data Collection
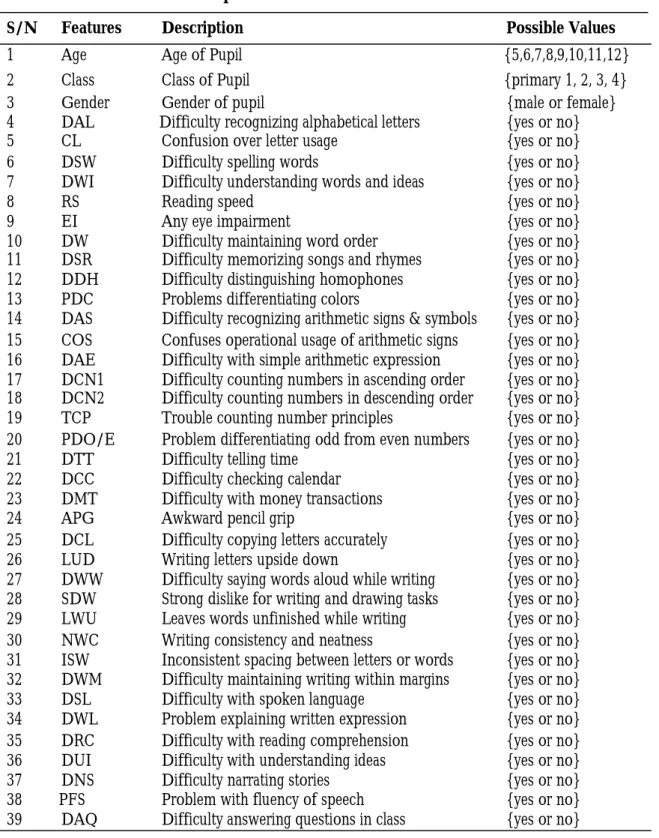
The LD - dataset contained 450 pupils’ rec-ords of Primary One to Four pupils in fif-teen government owned elementary schools within Ife Central Local Govern-ment Area, Ile-Ife of Osun State with 39 attributes of each pupil record as shown in Table 1. The data collected involved vari-ous symptoms observed in each pupil by their teachers which were filled in a ‘yes’ or ‘no’ format. There were two sections in the questionnaire: the first section comprised the pupils’ demographics which include age, gender and class while the second sec-tion comprised quessec-tions related to various learning disabilities types (reading, writing, solving basic arithmetic skills and language expression).
Data pre-processing
Data pre-processing is an important tech-nique in data mining process. It transforms data into understandable format since raw data is highly susceptible to noise, missing values, inconsistency and lacking certain trends. It draws improvement to classifica-tion problems by using Principal Compo-nent Analysis (PCA). PCA is a technique that converts a set of observations of possi-bly correlated variables into a set of values linearly uncorrelated variables called Princi-pal Component. The transformed dataset is defined in such a way that the first principal components account for much of the vari-ance. All the values of the variables in the datasets are string type but PCA works well with numeric data when using SPSS; there-fore, all “yes” cases in the datasets were converted to “1” and all “no” cases were converted to “0”. Therefore, all features with eigen values greater than 0.600 were retained in each of the components of each dataset. The rotated component matrix also known as loadings is the key output of
PCA. It contained estimates of the correla-tion between each of the variables and esti-mated components. Features with eigen val-ues closer to 1.0 were retained as features reduced for classification in each of the da-tasets.
Classification Using Multilayer Percep-tron
Classification is one of the major techniques in data mining. It normally uses a training set where all objects are already associated with known class labels. The classification algo-rithm learns from the training set and builds a model. The model is then used to classify new objects [12]. It normally employs a learning algorithm to build a classification model. In this study, Multilayer Perceptron. (MLP) is employed as the learning algorithm. It is an example of the feed forward neural network and it consists of an input layer, one or more hidden layers of computation nodes and an output layer of computation nodes. Each layer has one or more neurons. Every neuron is connected to the neurons of the next layer by a set of weighted links. It uses a learning algorithm known as the back prop-agation algorithm to train its network. At the input layer, the input signals are associat-ed with the attributes; the neurons in the hidden layer during the learning phase grad-ually discover the salient features of the problem space. The linear combinations of neurons are transformed into output signals using an activation function. These signals are sent in a forward direction layer by layer to the output layer which delivers an output for each output neuron. One method to learn the weights is back propagating i.e. propagate errors in a backward direction from the output layer to the input layer, up-dating the weight connections if an error is detected at the output layer.
Table 1: LD -Features Description
S/N Features Description Possible Values
1 Age Age of Pupil {5,6,7,8,9,10,11,12}
2 Class Class of Pupil {primary 1, 2, 3, 4}
3 Gender Gender of pupil {male or female}
4 DAL Difficulty recognizing alphabetical letters {yes or no}
5 CL Confusion over letter usage {yes or no}
6 DSW Difficulty spelling words {yes or no}
7 DWI Difficulty understanding words and ideas {yes or no}
8 RS Reading speed {yes or no}
9 EI Any eye impairment {yes or no}
10 DW Difficulty maintaining word order {yes or no} 11 DSR Difficulty memorizing songs and rhymes {yes or no} 12 DDH Difficulty distinguishing homophones {yes or no} 13 PDC Problems differentiating colors {yes or no} 14 DAS Difficulty recognizing arithmetic signs & symbols {yes or no} 15 COS Confuses operational usage of arithmetic signs {yes or no} 16 DAE Difficulty with simple arithmetic expression {yes or no} 17 DCN1 Difficulty counting numbers in ascending order {yes or no} 18 DCN2 Difficulty counting numbers in descending order {yes or no} 19 TCP Trouble counting number principles {yes or no} 20 PDO/E Problem differentiating odd from even numbers {yes or no}
21 DTT Difficulty telling time {yes or no}
22 DCC Difficulty checking calendar {yes or no} 23 DMT Difficulty with money transactions {yes or no}
24 APG Awkward pencil grip {yes or no}
25 DCL Difficulty copying letters accurately {yes or no} 26 LUD Writing letters upside down {yes or no} 27 DWW Difficulty saying words aloud while writing {yes or no} 28 SDW Strong dislike for writing and drawing tasks {yes or no} 29 LWU Leaves words unfinished while writing {yes or no} 30 NWC Writing consistency and neatness {yes or no} 31 ISW Inconsistent spacing between letters or words {yes or no} 32 DWM Difficulty maintaining writing within margins {yes or no} 33 DSL Difficulty with spoken language {yes or no} 34 DWL Problem explaining written expression {yes or no} 35 DRC Difficulty with reading comprehension {yes or no} 36 DUI Difficulty with understanding ideas {yes or no} 37 DNS Difficulty narrating stories {yes or no} 38 PFS Problem with fluency of speech {yes or no} 39 DAQ Difficulty answering questions in class {yes or no}
Adopted Model formulated from Multilayered Perceptron Network
The adopted model formulated from Multilayered perceptron network is as follows: Let features selected by PCA representing inputs to the model be written as in Equation 3.1.
( 1,2, 3, …..…….. ) (3.1)
Let the corresponding weights for each input be written as in Equation 3.2.
( 1, 2, 3, …….. ) (3.2)
Each input is multiplied by its respective weight as given in Equation 3.3.
1 1, 2 2, 3 3,……….. (3.3)
Sum of product is performed at each node by adding its respective bias (b) as given in Equation 3.4.
1 1 + 2 2, + 3 3+… + b (3.4)
Equation 3.4 was passed to an activation function (φ) (sigmoid function) as given in
Equation 3.5.
φs(z) =
(3.5)
Output was generated at each layer, which is written as in Equation 3.6.
= φ ( =1 )
(3.6) Where
Φ is the activation function,
is the weight connecting node i to node p, and
x is the input at node i.
If E = 1, back propagate for error from output to hidden back to input layer using Equa-tion 3.7
E = (a - p) (3.7)
where a is the actual output value set for training p is the predicted output value by the network if E = 0, no backward pass for errors, classification is okay. Check for error (E) after generating the output where E = {0, 1}
This study employed WEKA version 3.7.2 software for simulation. The process begins by converting the reduced attributes into attribute relation file format (arff), which is the file format understandable by WEKA. The learning algorithm i.e. multi-layer per-ceptron was selected and the classification was first done based on LD training set. 70% of each of the LD dataset with as-signed class labels was used for training the
model. The remaining 30% of each of the LD dataset with unknown class labels were used to test the performance of the models. The models can then be used to classify fu-ture instances of LD for which the class la-bel is unknown. Accuracy in LD classifica-tion refers to the ratio of the number of cor-rectly classified instances of LD to the total number of LD cases. This is expressed mathematically expressed as:
(3.8)
where
∆ is the weight change from node i to node p
∝ is the learning rate
is the rate of change of error rate with respect to the weight change
from node i to node p.
Accuracy = .
Precision in LD classification refers to the number of actual true LD instances. This is expressed mathematically as:
Precision = * 100%
where TP denotes true positive and FP denotes false positives.
RESULTS AND DISCUSSIONS
The LD dataset has 37 original features
including the class label. All the variables with absolute correlation value greater than 0.600 were retained but features with values closer to 1.000 were selected for classifica-tion. The retained features are as shown in Table 2.
After reducing the dimension of the features, the extracted features were transferred to Excel sheet and converted back to nominal values. Some classification rules were gener-ated based on the reduced features in order to assign class labels to each of the pupil rec-ord for model training.
Table 2: Reduced Features by PCA
Class Reduced features in order of significance
Primary One DDH, DW, DAL, CL, DSW RS. DAS, COS, DCN, DAE, TCP, PDO/E. ISW, DWM, APG, DCL, DWW, LWU. DNS, DRC, PFS, DSL, DAQ.
Primary Two
CL, DSW, DWI, DDH, PDC, DAL. DAS, COS, TCP, PDO/E, DTT, DCC. DWW, LWU, SDW, ISW, DWM. DWE, DUI, DNS, PFS, DRC.
Primary Three DAL, CL, DSW, DWI, DDH. DAS, COS, DAE, TCP, PDO/E. DCL, DWW, LWU, ISW, DWM. DSL, DWE, DUI, DNS,
PFS. Primary Four
DAL, DSW, DWI, RS, DDH, PDC. DAS, COS, DCN2, DAE, TCP, PDO/E. DCL, DWW, LWU, ISW, DWM. DSL, DWE, DRC, DNS, PFS.
Classification Rules Generated after Feature Reduction by PCA
The following rules were used to determine the exact learning disability type a pupil has. These rules will help decide if a pupil has one or more LD types.
For each dataset in Primary One
if (DSW, DW, DDH, DAL, CL = “yes” and RS = “no”) then the pupil has “Dyslexia” if (DAS, PDO/E, DCN1, COS, DAE & TCP = “yes”) then the pupil has “Dyscalculia” if (APG, DCL, DWW, LWU, ISW & DWM = “yes”) then the pupil has “Dysgraphia” if (DSL, DRC, DNS, PFS & DAQ= “yes”) then the pupil has “Dysphasia”
For each dataset in Primary Two
if (CL, DSW, DWI, DDH, PDC, & DAL = “yes”) then the pupil has “Dyslexia” if (DAS, COS, TCP, PDO/E, DTT & DCC = “yes”) then the pupil has “Dyscalculia” if (DWW, LWU, SDW, ISW & DWM = “yes”) then the pupil has “Dysgraphia” if (DWE, DUI, DNS, PFS & DRC = “yes”) then the pupil has “Dysphasia” For each dataset in Primary Three
if (DAL, CL, DSW, DWI & DDH = “yes”) then the pupil has “Dyslexia” if (DAS, COS, DAE, TCP & PDO/E = “yes”) then the pupil has “Dyscalculia” if (DCL, DWW, LWU, ISW & DWM = “yes”) then the pupil has “Dysgraphia” if (DSL, DWE, DRC, DNS & PFS = “yes”) then the pupil has “Dysphasia” For each dataset in Primary Four
if (DAL, DSW, DWI, DDH, PDC = “yes” & RS = “no”) then the pupil has “Dyslexia” if (DAS, COS, DCN2, DAE, TCP & PDO/E = “yes”) then the pupil has “Dyscalculia” if (DCL, DWW, LWU, ISW & DWM = “yes”) then the pupil has “Dysgraphia”
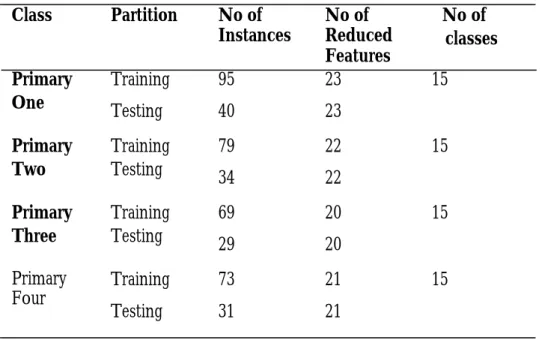
After assigning each pupil’s record its class label, the training and testing set were fed into the multi-layer perceptron (MLP) net-work by employing WEKA software for simulation at a learning rate of 0.3, momen-tum of 0.2 and 500 epoch. Each dataset was
then partitioned into training and testing set as shown in the Table 3.
The simulation process was performed on each of the datasets.
Table 3: Data Partitioning for Classification
Class Partition No of
Instances
No of Reduced Features
No of classes Primary
One
Training Testing
95 40
23 23
15
Primary Two
Training Testing
79 34
22 22
15
Primary Three
Training Testing
69 29
20 20
15
Primary Four
Training Testing
73 31
21 21
15
RESULT DISCUSSION
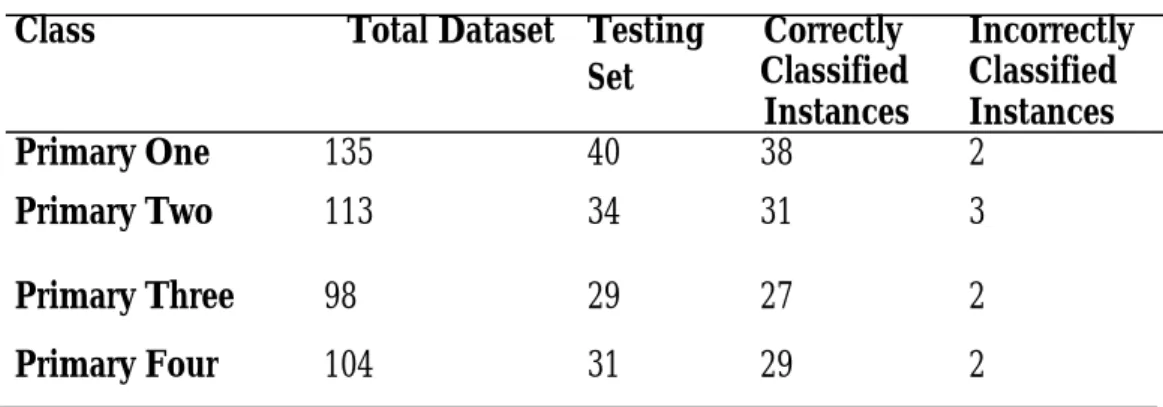
The simulation results obtained are as pre-sented in Table 4. Out of testing set of 40 cases for Primary One pupils, the proposed classification model correctly classified 38 instances and 2 incorrectly classified in-stances. For Primary Two pupils, a total of 31 instances were correctly classified out of testing set of 34 and 3 cases incorrectly clas-sified. For Primary Three pupils, a total of 27 instances were correctly classified out of testing set of 29 and 2 cases incorrectly clas-sified. For Primary Four pupils, 29 instanc-es out of 31 tinstanc-esting set were correctly classi-fied and 2 instances incorrectly classiclassi-fied. The true positives and false positives
ob-the precision and accuracy of ob-the proposed model as shown in Table 5. Each of the LD classification model gave a precision rate of 95.00%, 91.18%, 93.10% and 93.60% re-spectively and accuracy rate of 95.00%, 91.18%, 93.10% and 93.60% respectively. This study suggests that the degree of 1 out of 4 of the disorder is 0.25, degree of 2 out of 4 of the disorder is 0.50, degree of 3 out of 4 of the disorder is 0.75 and degree of the 4 disorder is 1.00. Therefore, if the degree of the disorder falls within the range of 0.25 to 0.50, teachers should assist the pupils’ area of weaknesses. If the degree of the disorder is > 0.50, the parent of the affected pupil should seek advice from qualified learning
CONCLUSION
The study concluded that the developed model proved to be accurate and precise in classifying pupils with learning disabilities in primary schools. This model can be adopt-ed for the management of pupils with learn-ing disabilities. Further work could be done by collecting more data samples and addi-tional essential features that will help build a well-supported classification model for fu-ture prediction of LD cases. Hybrid data mining algorithm could be adopted in this study for performance comparison with this study. Also, extension could be made to other learning disability types.
ACKNOWLEDGEMENTS
We acknowledge the contributions of teachers of Ife Central Elementary Schools for their time and patience in responding to
the questionnaires.
REFERENCES
American Psychiatrist Association 2016. Spe-cific Learning Disorder. Retrieved from: https://www.psychiatry.org/patients - families/specificlearning-disorder/what-is-specific-learning-disorder. Accessed on 13th
of December, 2016.
David, J. M., Balakrishnan, K. 2010. Sig-nificance of Classification Techniques in Prediction of Learning Disabilities. Interna-tional Journal of Artificial Intelligence and Applica-tions (IJAIA), 1(4): 111-120.
David, J. M., Balakrishnan, K. 2011. Pre-diction of Learning Disabilities in School Age Children using SVM and Decision Tree. International Journal of Computer Science and In-Table 4: Simulation Result
Class Total Dataset Testing
Set
Correctly Classified
Instances
Incorrectly Classified Instances
Primary One 135 40 38 2
Primary Two 113 34 31 3
Primary Three 98 29 27 2
Primary Four 104 31 29 2
Table 5: Evaluation Result Class
Primary One Primary Two Primary Three Primary Four
formation Technologies (IJCSIT), 2(2): 829-835. David, J. M, Shereena, V. B., Raja, S. 2014. Prediction of Learning Disabilities in Children: Development of a New Algo-rithm in Decision Tree. International Journal of Recent Advances in Engineering and Technology (IJRAET), 2(5): 6 – 13.
Igwue, D.O., Ashami, B.D. 2013. Learn-ing difficulties among Children: A Chal-lenge in the Implementation of the Univer-sal Basic Education Programme in Nigeria. Wudpecker Journal of Educational Research, 2(3): 26 – 33.
Jain, K., Manghirmalani, P., Dongardive J., Abraham, S. 2009. Computational Di-agnosis of Learning Disability. International Journal of Recent Trends in Engineering, 2(3): 64 -66.
Kemp, G., Smith, M., Segal, J. 2015. Learning Disabilities and D i s o r d e r s . Retrieved f r o m h t t p : / / www.helpGUIDE.org. Accessed on 7th September, 2016.
Kohli, M. and Prasad, T.V. 2010. Identi-fying Dyslexic Students Using Artificial Neural Networks. Proceedings of the World Congress on Engineering, 1(1): 1- 4.
Margaj, S. Purohit, S. 2016. Comparative Study for Prediction of Dyscalculia Using SMO and Naïve Bayes Classifier. International Journal of Scientific Research (IJSR), 5(8): 420 – 426.
Mishra, P.M., Kulkarni, S. 2013. Classifi-cation of Data Using Semi-Supervised Learning (A Learning Disability Case Study). International Journal of Computer Engineering and Technology (IJCET), 4(4): 432 – 440.
Muangnak, N., Pukdee, W., Hengsanun-kun, T. 2010. Classification Students with Learning Disabilities using Naïve Bayes Clas-sifier and Decision Tree. Proceedings of Interna-tional conference on Networked Computing and Ad-vanced Information Management, NCM. pp. 1-5. Sabu, M. K. 2015. A Novel Hybrid Fea-ture Selection Approach for the prediction of Learning Disabilities in School - Aged Children. International Journal of Artificial Intel-ligence and Applications (IJAIA), 6(2): 67 – 80. Upadhyay, A., Singh, S. K., Turkar, V., Singh, O. 2013. Proposed Method for Clas-sification of Learning Disable Students us-ing Artificial Neural Network and Decision Tree. Proceedings of National Conference on Emerging Trends, Innovations and Challenges in Information Technology, pp. 1 -5.