Sharif University of Technology
Scientia IranicaTransactions D: Computer Science & Engineering and Electrical Engineering http://scientiairanica.sharif.edu
The eects of demand response on security-constrained
unit commitment
E. Zarei
a;, M.H. Hemmatpour
b, and M. Mohammadian
aa. Department of Electrical Engineering, Faculty of Engineering, Shahid Bahonar University of Kerman, Kerman, Iran. b. Department of Electrical Engineering, Faculty of Engineering, Jahrom University, Jahrom, Fars, Iran.
Received 9 January 2016; received in revised form 18 August 2017; accepted 14 October 2017
KEYWORDS Bender's decomposition; Demand response; Real-time pricing; Restructured power market;
SCUC.
Abstract. This paper aims to study the eect of the hourly Demand Response (DR) on Security-Constrained Unit Commitment (SCUC) problem considering economic and security objectives. The demand side participation can solve some of the electricity market problems. In this paper, the DR is taken into consideration as one of the Demand Side Management (DSM) parts. The DR consists of xed and responsive loads. The xed loads can be satised under any circumstances, and responsive loads can reduce or shift to other operation hours. A combination of SCUC with DR is a complex and mixed integer non-linear problem. The bender's decomposition is used as an optimization technique for solving this problem. This technique solves the problem by decomposing it into master and sub problems. One of the advantages of this technique is short processing time. The performance and eectiveness of the proposed method are evaluated with respect to 6-, 24-, and 118-bus test systems.
© 2019 Sharif University of Technology. All rights reserved.
1. Introduction
The restructured power market is composed of several independent players who benet from the DR. These players are GENCOs, TRANSCOs, DISCOs, ISO, and other dierent parts [1]. The Independent System Operator (ISO) should schedule available resources for satisfying the demand by considering security at the minimum cost. The GENCOs submit their bids to the ISO for satisfying next-day demands [1,2]. In the electricity market, the marginal price is dened based on the last scheduled generator [3]. In such a market, the elasticity of demand is often thought to range from zero in the real-time markets, and the
*. Corresponding author. Tel./Fax: +98 34 31325900 E-mail addresses: [email protected] (E. Zarei); [email protected] (M.H. Hemmatpour); [email protected] (M. Mohammadian) doi: 10.24200/sci.2017.4536
demand side has no participation in the electricity market [4]. Thus, the generators submit their bids at a price much higher than the marginal market price [5]. The spike in prices also occurs at peak hours when sucient reserve is not available. To compensate for this absence of power, the generators with high marginal cost are employed [6]. In such a cycle, the DR participation is a good, economical method to overcome the system constraint and spike in prices [7]. These problems occur, when the hourly power dispatch does not consider the DR role in the market. Incorporating the DR in the market structure is protable for all of the market participants [8,9]. The demand side management consists of the distributed generation, the energy storage site, and the DR [10]. Here, it is focused on the DR considering a combination of xed and responsive loads. The DR is an opportunity for consumers to save money through reductions in the peak demand. The DR has the ability to defer the construction of new power plants and power delivery systems such as those reserved for use during peak
Figure 1. Energy market structure.
times. The DR can be categorized into two subgroups: economical and emergency DRs.
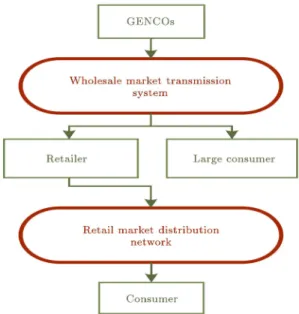
In addition, the emergency one curtails loads of the network according to the network's condition, and the economical one is curtailed voluntarily based on market prices. In a restructured power market, electricity prices will uctuate with time and place of loads [11-13]. The structure of the energy market is shown in Figure 1. The GENCOs and TRANSCOs submit their information to the ISO and DISCOs aggregate loads data for the ISO. Achieving a dynamic market with the best operation schedule is the main objective that ISO tries to realize by incorporating the DR in SCUC. This will make a new opportunity for customers and market participants [14].
In [15], to maximize social welfare, a new market clearing process was supposed in which customers submit their bids for buying energy. In this model, a power market with the auction pool is introduced; accordingly, the buyer or seller submits their bids to the ISO for making the right decision. The ISO gathers all submitted bids and solves the unit commitment problem to obtain the minimum cost. The most important objective of the ISO is to maximize the social welfare, which is dened as a summation of consumption and production surplus. In [16], a multi-directional auction was introduced; accordingly, the market participants attempt to nd an equilibrium point for submitting their bids. Here, the main dierence is that the seller and the market operators attempt to maximize the benet according to their needs. In [17], the load constraints with the hourly biding mechanism were modeled on the day ahead of the auction. For this purpose, security was considered as an ancillary service, and the price was the signal that specied the unit status. In [18], an iterative process
was used to calculate the market price and the DR change. According to the last load prole, the amount and method of the DR combination were estimated. The authors in [19] discussed a new concept of the DR as a DR exchange (DRX) that could make a good trade-o between a buyer and a seller. In [20], the DR was incorporated into SCUC, and the objective function maximizes the social welfare with the bender's decomposition technique. As observed, the market clearing process was conducted by either direct or iterative approaches. In the direct approach, the elastic characteristic of the demand price is used to set the demand.
The operation and transmission constraints are not considered in this approach. In addition, the iterative process is a time-consuming process, and the feasible solution may not be found by this method. Herein, the operation constraints of the DR and trans-mission line are not considered.
In this paper, the SCUC problem along with the DR is solved by bender's decomposition technique. This technique converges to the result at a proper time. 2. The market clearing model
The GENCOs and the loads submit their simple bids (it could also be complex) to the ISO. The transmission constraints and probabilities are considered in the base case. The objective function is aimed at maximizing the social welfare, which is dened by the prot obtained from selling the electricity power mines and reducing the generation cost. The hourly SCUC for the complex bids species the unit status and power dispatch for each unit and the hourly DR according to the submitted bids [1,11].
3. Load oer
The DR consists of xed and responsive loads. The xed loads are associated with price takers and should be fully satised in the market clearing process. The xed load prices reduce as demand increases.
The responsive loads could reduce or shift to other operation hours. This type of loads should oer the amount of hourly load and their price to the ISO. The load characteristic with their constraints is imposed on the SCUC problem. These constraints consist of the minimum on/o time, up/down rate, bus load, minimum hourly curtailment, and maximum load curtailment [15-17].
4. Formulation of SCUC with the DR and bender's decomposition
This is a mixed integer non-linear optimization pro-gram. The bender's decomposition technique is used
Figure 2. SCUC with bender's decomposition.
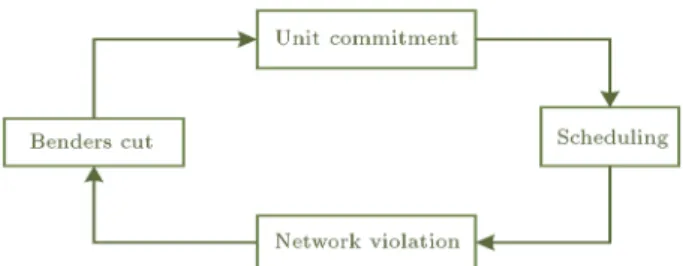
in this formulation to reduce a large amount of com-putation and time-consuming process. By using this technique, the problem is divided into master and sub problems. The master problem species the main unit commitment and units and loads status with their schedule. Checking the feasibility and probability condition is done in sub problems. If any violation occurs, the bender's decomposition cuts the process and adds to the master problem according to the violation. In the next iteration, the master problem is solved by this additional constraint. This iterative process between the master and sub problems continues until all constraints are satised. These iterative processes for the SCUC problem and DR are depicted in Figure 2 [1,2].
5. Formulation
The decomposition technique is applied to solve the mixed integer non-linear program. Therefore, the mas-ter and sub problems along with the related constraints are briey discussed below.
5.1. Master problem
The objective function of the master problem is to schedule the generation unit and loads by the prevailing system constraint in the base case to maximize the social welfare. The objective function of the master problem is shown in Eq. (1):
Max XNT
t=1 NB
X
b=1
CBbt(Dbt) NT
X
t=1 NG
X
i=1
Fci(Pit) Iit
+ SUit+ SDit
: (1)
5.2. System constraints
1. The power balance: Eq. (2) demonstrates the power balance in the power system. By this constraint, the power generation should be equal to the demand plus the network losses.
NG
X
i=1
PitIit= NB
X
b=1
Dbt+ PL;t; t = 1; 2; : : : :; NT:
(2)
2. The system spinning and operating reserve: To maintain system reliability, the adequate spinning
and operating reserves are required, which are dened as follows:
NG
X
i=1
RS;itIit RS;t; t = 1; 2; : : : :; NT; (3)
NG
X
i=1
Ro;itIit Ro;t; t = 1; 2; : : : :; NT: (4)
3. The ramp rate: for each unit, the output is limited by the up/down ramp rate at each hour as follows:
Pit Pi(t 1)1 Iit 1 Ii(t 1)URi
+ Iit 1 Ii(t 1)Pi;min;
i = 1; 2; : : : :; NG; t = 1; 2; : : : :; NT; (5) Pi(t 1) Pit1 Ii(t 1)(1 Iit)DRi
+ Ii(t 1)(1 Iit) Pi;min;
i = 1; 2; : : : :; NG; t = 1; 2; : : : :; NT: (6)
4. The minimum on/o time: thermal units cannot change their status suddenly because each unit has a cool and warm up time. These limitations are explained in the following equations:
h Xon
i(t 1) Tion
i
Ii(t 1) Iit 0;
i = 1; 2; : : : :; NG; t = 1; 2; : : : :; NT; (7) h
Xi(t 1)off Tioffi Iit Ii(t 1) 0;
i = 1; 2; : : : :; NG; t = 1; 2; : : : :; NT: (8)
5. Power output constraints: The power output of each unit has its lower and upper bounds as follows:
Pi;minIit Pit Pi;maxIit;
i = 1; 2; : : : :; NG; t = 1; 2; : : : :; NT: (9) This constraint is imposed to keep the power generation of each unit inside this band [1,21,22]. 5.3. Load constraints
the market. Eq. (10) shows that the summation of xed and responsive loads should be equal to the total loads at each bus. The minimum load curtailment and nonnegative responsive load are explained in Eqs. (10) and (11), respectively. The submitted responsive load is shown in Eq. (13). If the load is not curtailed, the responsive load schedule is submitted. The load of each bus should set their decrement and increment levels according to their ramp up/down limit rate, as given in Eqs. (14) and (15).
Loads such as generation units have the minimum on/o time of the loads, as explained in Eqs. (16) and (17). Loads use these constraints for restrict-ing on/o status of the loads. These constraints demonstrate the minimum number of the hours that the loads can be curtailed or restored. Constraint (18) restricts the total daily load curtailment. The hourly load curtailment is the dierence between the submitted responsive load and the scheduled responsive load. This term is positive when the load is curtailed, negative when the load is shifted to that hour, and zero when there is no load curtailment or shifting at that hour. By using this constraint, responsive loads may be shifted or curtailed [14,20].
Dbt= Dfbt+ Drbt; b = 1; 2; :::; NB; t = 1; 2; :::; NT;
(10)
Dbtr;max DXmin bt Dbtr
vbt 0;
b = 1; 2; :::; NB; t = 1; 2; : : : ; NT; (11) Dr
btvbt 0 b = 1; 2; :::; NB; t = 1; 2; :::; NT; (12)
[Dr
bt Dbtr;max] [1 vbt] 0;
b = 1; 2; :::; NB; t = 1; 2; :::; NT; (13) Dr
bt Db(t 1)r URb;
b = 1; 2; :::; NB; t = 1; 2; :::; NT; (14) Dr
b(t 1) Drbt DRb;
b = 1; 2; :::; NB; t = 1; 2; :::; NT ; (15) h
Xon
b(t 1) UTbi vb(t 1) vbt 0;
b = 1; 2; :::; NB; t = 1; 2; :::; NT; (16) h
Xb(t 1)off DTbi vbt vb(t 1) 0;
b = 1; 2; :::; NB; t = 1; 2; :::; NT; (17)
NT
X
t=1
(Dr;maxbt Dr
bt) EXbmax;
b = 1; 2; :::; NB: (18) 5.4. Sub problem and bender's decomposition The bender's decomposition technique is applied to solve this mixed integer non-linear optimization prob-lem. The unit schedules are cleared by solving SCUC in the master problem. Then, the feasibility and contingencies of results are checked in sub problems. In the case of violation, hourly cuts (Relations (19) and (20)) add to the master problem in the next iteration. In sub problems, the power mismatch is minimized at all buses [1,2,23].
^ wt+
NG
X
i=1
it
PitIit P^it^Iit
+XNB
b=1
bt
Dbt D^bt
0;
t = 1; 2; :::; NT; (19) ^
wt+ NG
X
i=1
(it it)
Pit P^it
+ NB X b=1 bt
Dbt D^bt
0;
t = 1; 2; : : : :; NT; (20) where ^wt shows the power mismatch in the base case
for the current bus. In addition, it, bt, it, and
it are the dual variables of hourly dispatch, the
load balance equations, and the hourly generation constraint, respectively.
6. Case studies
The proposed methodology is implemented on the modied standard IEEE 6-bus, 24-bus, and 118-bus systems. The simulation is carried out by GAMS 23.3 software with a personal computer [23]. In these cases, ten percent of the total load is considered as responsive, while the rest is xed. The consumption bid for the responsive loads is 15$.MW.
The operation constraints are:
1. The consumption bid is 15$/MWh for the respon-sive loads;
2. The minimum up-and-down time is 4 h;
3. The minimum hourly and maximum daily load curtailment rates are considered as 5 MW and 150 MW.
6.1. Case study 1: Six-bus system 6.1.1. Scenario 1: The base case
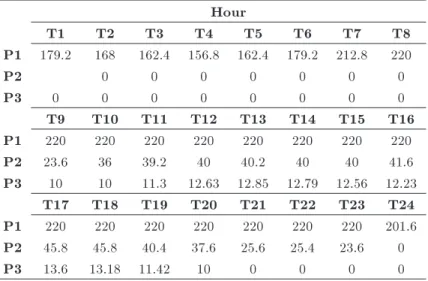
For this base case, the SCUC problem is solved without considering DR. The operation cost and the processing time are obtained $137491.924 and 3 min, respectively. The load is satised directly from three units at dier-ent hours. The hours that each unit generates power are shown in Figure 3. The hourly power generation over a period of one day is shown in Table 1. This table is summarized in Figure 4.
6.1.2. Scenario 2: A 6-bus system with the DR in all buses
By incorporating the DR into the SCUC, the total operation cost and the processing time are obtained
Figure 3. The unit status of the 6-bus system in the base case.
Figure 4. The aggregated power for the 6-bus system in the base case.
as $124421.209 and 5 min, respectively. The economic point based on the DR saves $13070.715 in comparison to the base case. The curtailed loads are depicted in Figure 5. The load curtailment is shown as a function of time deviation for each curtailed load in Figure 6.
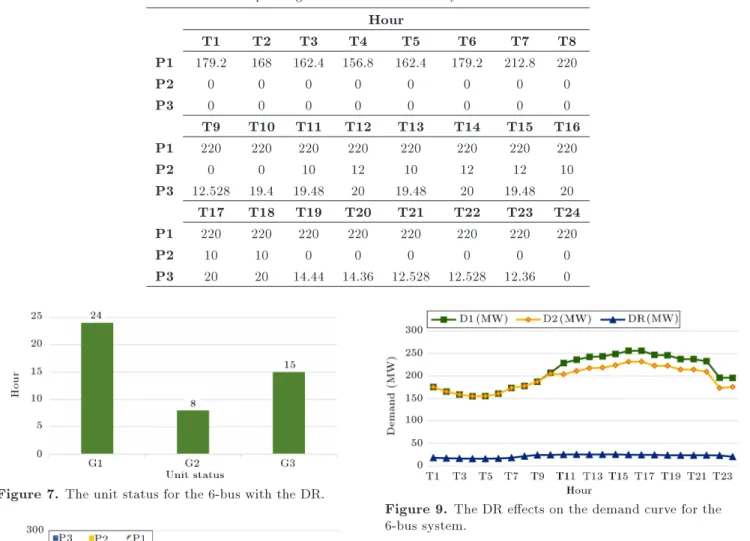
The power generation, the unit status, and the aggregated power generation of each generator are shown in Table 2 and Figures 7 and 8, respectively.
The reasons for a decrease in the total operation cost in this scenario are summarized as follows:
1. Generation unit 2 almost generates xed power far away from the marginal cost;
2. It is clear that the DR is the main reason to compensate the lack of power at the peak load hours. Therefore, the DR can reduce the total operation cost.
Figure 5. The load curtailment in the 6-bus system.
Figure 6. The total load curtailment in the 6-bus system. Table 1. The power generation for the 6-bus system in the base case.
Hour
T1 T2 T3 T4 T5 T6 T7 T8
P1 179.2 168 162.4 156.8 162.4 179.2 212.8 220
P2 0 0 0 0 0 0 0
P3 0 0 0 0 0 0 0 0
T9 T10 T11 T12 T13 T14 T15 T16
P1 220 220 220 220 220 220 220 220
P2 23.6 36 39.2 40 40.2 40 40 41.6
P3 10 10 11.3 12.63 12.85 12.79 12.56 12.23
T17 T18 T19 T20 T21 T22 T23 T24
P1 220 220 220 220 220 220 220 201.6
P2 45.8 45.8 40.4 37.6 25.6 25.4 23.6 0
Table 2. The power generation for the 6-bus system with the DR. Hour
T1 T2 T3 T4 T5 T6 T7 T8
P1 179.2 168 162.4 156.8 162.4 179.2 212.8 220
P2 0 0 0 0 0 0 0 0
P3 0 0 0 0 0 0 0 0
T9 T10 T11 T12 T13 T14 T15 T16
P1 220 220 220 220 220 220 220 220
P2 0 0 10 12 10 12 12 10
P3 12.528 19.4 19.48 20 19.48 20 19.48 20
T17 T18 T19 T20 T21 T22 T23 T24
P1 220 220 220 220 220 220 220 220
P2 10 10 0 0 0 0 0 0
P3 20 20 14.44 14.36 12.528 12.528 12.36 0
Figure 7. The unit status for the 6-bus with the DR.
Figure 8. The aggregated power for the 6-bus with the DR.
The demands in SCUC problem with the DR (in the base case) and in a combination of SCUC problem with the DR are dened by D1 and D2 in Table 3, respectively. D1 is equal to D2 in the hours between T1 to T9. However, D2 is less than D1 in the other hour. The eect of the DR on the actual system load is shown in Figure 9. The DR shave the peak load that reduces the total operation cost, the spinning reserve, the transmission congestion, and the emission.
6.2. Case study 2: 24-bus system
6.2.1. Scenario 1: The SCUC problem in the base case
This network has 33 generation units and 34 lines. The peak load of this network is 2821.5 MW. The SCUC
Figure 9. The DR eects on the demand curve for the 6-bus system.
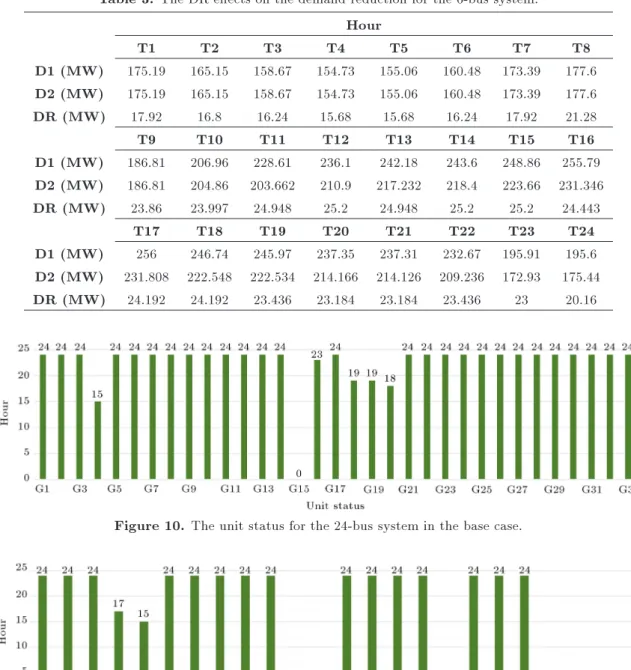
problem is solved without considering the DR. The operation cost and the processing time are obtained as $373869.23 and 18 min, respectively. The unit status is shown in Figure 10. Based on the gure, 32 units participate in power generation, unit 15 is o, and almost most of them produce power throughout the whole day. Figure 10 shows the hours that each unit generates power.
6.2.2. Scenario 2: A 24-bus system with the DR By incorporating the DR into the SCUC, the total operation cost and the processing time are obtained as $349897.73 and 24 min, respectively, saving the amount of $23971.5 in comparison to the amount in the base case. Figure 11 shows the status of each load participation in the load curtailment. Herein, the buses with zero status, unlike one status, have no role in the load curtailment program. The status of each unit is shown in Figure 12.
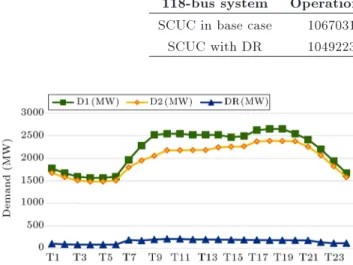
In Table 4, the demands before combination with SCUC (D1) and after combination (D2) are clearly shown. The DR shaves the demand peak curve, and generators decrease their production levels. The eect of this demand shaving is shown in Figure 13.
Table 3. The DR eects on the demand reduction for the 6-bus system. Hour
T1 T2 T3 T4 T5 T6 T7 T8
D1 (MW) 175.19 165.15 158.67 154.73 155.06 160.48 173.39 177.6 D2 (MW) 175.19 165.15 158.67 154.73 155.06 160.48 173.39 177.6 DR (MW) 17.92 16.8 16.24 15.68 15.68 16.24 17.92 21.28
T9 T10 T11 T12 T13 T14 T15 T16
D1 (MW) 186.81 206.96 228.61 236.1 242.18 243.6 248.86 255.79 D2 (MW) 186.81 204.86 203.662 210.9 217.232 218.4 223.66 231.346 DR (MW) 23.86 23.997 24.948 25.2 24.948 25.2 25.2 24.443
T17 T18 T19 T20 T21 T22 T23 T24
D1 (MW) 256 246.74 245.97 237.35 237.31 232.67 195.91 195.6 D2 (MW) 231.808 222.548 222.534 214.166 214.126 209.236 172.93 175.44 DR (MW) 24.192 24.192 23.436 23.184 23.184 23.436 23 20.16
Figure 10. The unit status for the 24-bus system in the base case.
Figure 11. The load curtailment status for the 24-bus system.
Table 4. The DR eects on the demand reduction for the 24-bus system. Hour
T1 T2 T3 T4 T5 T6 T7 T8
D1 (MW) 1775.84 1669.815 1590.3 1563.795 1563.795 1590.3 1961.37 2279.43 D2 (MW) 102.584 90.813 82.287 81.378 81.378 84.03 166.155 142.933 DR (MW) 1673.25 1579.002 1508.013 1482.417 1482.417 1506.27 1795.215 2136.497
T9 T10 T11 T12 T13 T14 T15 T16
D1 (MW) 2517.98 2544.48 2544.48 2517.975 2517.975 2517.975 2464.965 2491.47 D2 (MW) 166.797 169.385 169.385 166.797 166.797 166.797 161.82 165.147 DR (MW) 2351.18 2375.095 2375.095 2351.178 2351.178 2351.178 2303.145 2326.323
T17 T18 T19 T20 T21 T22 T23 T24
D1 (MW) 2624 2650.5 2650.5 2544.48 2411.955 2199.915 1934.865 1669.815 D2 (MW) 177.339 180.049 180.049 169.448 156.131 134.991 113.456 91.954 DR (MW) 2446.66 2470.451 2470.451 2375.032 2255.824 2064.924 1821.409 1577.861
Table 5. A complete comparison of all case studies.
6-bus system Operational cost Cost reduction Time
SCUC in base case 137491.924$ 0$ 3 min
SCUC with DR 124421.209$ 13070.715$ 5 min 24-bus system Operational cost Cost reduction Time
SCUC in base case 373869.23$ 0$ 18 min
SCUC with DR 349897.73$ 23971.5$ 24 min 118-bus system Operational cost Cost reduction Time SCUC in base case 1067031.191$ 0$ 67 min SCUC with DR 1049223.153$ 17808.038$ 79 min
Figure 13. The DR eects on the demand curve for the 24-bus system.
According to the results, the DR incorporation is low in the rst hours; hence, the demand curtailment is low. By achieving the peak load, the participation of DR increases; therefore, more demand curtailment occurs.
6.3. A 118-bus system
This IEEE test system has 54 generation units, 186 lines, and 9 tap-changers with the maximum peak load of 6000 MW in a day. The total operation cost and
the processing time after solving SCUC problem in the absence of the DR are obtained as $1,067,031.191 and 67 min, respectively. After incorporating the DR into the SCUC problem, the total operation cost and the processing time are obtained as $1,049,223.153 and 79 min, undergoing a reduction of $17808.038 in comparison to that in the base case.
According to a complete comparison of all case studies shown in Table 5, the eectiveness of this approach in reducing the costs is proven.
7. Conclusion
In this paper, a powerful and generalized method, called benders' decomposition, was used to model the DR in SCUC problem. This mixed integer problem was applied to dierent cases containing a large case. The application of the DR to SCUC would eectively increase the social welfare. In summary, the results showed that the DR had the following merits in SCUC problem:
Reduction in average system LMP;
Increase in social welfare;
Improved system reliability;
Improvement of the environmental factors. Nomenclature
b Index for buses i Index for unit t Index for buses
f Superscript for xed loads r Superscript for responsive loads NB Number of buses
NG Number of units
NT Number of periods (hour) DRi Ramp-down rate limit of unit i
URi Ramp-up rate limit of unit i
Fci(0) Production cost function for unit i
Iit Commitment state of unit i at time t
PL;t System losses at time t
Pit Power production of unit i at time t
Pi;max Lower real power generation of unit i
Pi;min Upper real power generation limit of
unit i
RS;t System spinning reserve at time t
RO;t System operating reserve at time t
RS;it Spinning reserve of unit i at time t
SUit Startup cost of unit i at time t
SDit Shutdown cost of unit i at time t
Tioff Minimum o time of unit i Ton
i Minimum on time of unit i
Xoff
it O time of unit i at time t
Xon
it On time of unit i at time t
i Permissible real power adjustment of
unit i EXmax
b Maximum load curtailment at bus b
Dbtf Fixed load at bus b at time t Dr
bt Responsive load at bus b at time t
Dbtr;max Submitted responsive load at bus b at time t
DXmin
bt Minimum load curtailment at bus b at
time t
DRb Down-rate limit of load at bus b
URb Up-rate limit of load at bus b
UTb Minimum on time of load at bus b at
time t
DTb Minimum o time of load at bus b at
time t
Xon
bt On time of load at bus b at time t
Xbtoff O time of load at bus b at time t CBbt Consumption benet at bus b at time t
Dbt Total load at bus b at time t
Vbt Curtailment state of load at bus b at
time t
Wt Power mismatch at time t
bt; bt Dual variable
^ Given variable References
1. Shahidehpour, M., Yamin, H., and Li, Z. \Market operations in electric power systems: Forecasting, scheduling, and risk management", Market Overview in Electric Power Systems, pp. 1-20 (2002).
2. Conejo, A.J., Castillo, E., Minguez, R., and Garcia-Bertrand, R., Decomposition Techniques in Mathemat-ical Programming: Engineering and Science Applica-tions, Springer Science & Business Media (2006). 3. Bakirtzis, A.G., Ziogos, N.P., Tellidou, A.C., and
Bakirtzis, G.A. \Electricity producer oering strate-gies in day-ahead energy market with step-wise oers", IEEE Transactions on Power Systems, 22(4), pp. 1804-1818 (2007).
4. Nikzad, M. and Mozafari, B. \Reliability assessment of incentive-and priced-based demand response programs in restructured power systems", International Journal of Electrical Power & Energy Systems, 56, pp. 83-96 (2014).
5. Zhang, D., Li, S., Sun, M., and O'Neill, Z. \An optimal and learning-based demand response and home energy management system", IEEE Transactions on Smart Grid, 7(4), pp. 1790-1801 (2016).
6. Nan, S., Zhou, M., and Li, G. \Optimal residen-tial community demand response scheduling in smart grid", Applied Energy, 210, pp. 1280-1289 (2017). 7. Larsen, E.M., Pinson, P., Leimgruber, F., and Judex,
F. \Demand response evaluation and forecasting -methods and results from the ecogrid eu experiment", Sustainable Energy, Grids and Networks, 10, pp. 75-83 (2017).
8. Bui, V.-H., Hussain, A., and Kim, H.-M. \A multiagent-based hierarchical energy management strategy for multi-microgrids considering adjustable power and demand response", IEEE Transactions on Smart Grid, 9, pp. 1323-1333 (2018).
9. Dehghanpour, K., Nehrir, H., Sheppard, J., and Kelly, N. \Agent-based modeling of retail electrical energy markets with demand response", IEEE Transactions on Smart Grid, 9, pp. 3465-3475 (2018).
10. Wang, F., Xu, H., Xu, T., Li, K., Shae-Khah, M., and Catal~ao, J.P. \The values of market-based demand response on improving power system reliability under extreme circumstances", Applied Energy, 193, pp. 220-231 (2017).
11. David, A. and Li, Y. \Eect of inter-temporal factors on the real time pricing of electricity", IEEE Transac-tions on Power Systems, 8(1), pp. 44-52 (1993). 12. Samimi, A., Nikzad, M., and Siano, P.
\Scenario-based stochastic framework for coupled active and reactive power market in smart distribution systems with demand response programs", Renewable Energy, 109, pp. 22-40 (2017).
13. Goel, L., Wu, Q., and Wang, P. \Nodal price volatility reduction and reliability enhancement of restructured power systems considering demand-price elasticity", Electric Power Systems Research, 78(10), pp. 1655-1663 (2008).
14. Zhang, D., Wang, Y., and Luh, P.B. \Optimization based bidding strategies in the deregulated market", in, Power Industry Computer Applications, 1999. PICA'99, Proceedings of the 21st 1999 IEEE Interna-tional Conference IEEE (1999).
15. Arroyo, J.M. and Conejo, A.J. \Multiperiod auction for a pool-based electricity market", IEEE Transac-tions on Power Systems, 17(4), pp. 1225-1231 (2002). 16. Contreras, J., Candiles, O., De La Fuente, J.I., and Gomez, T. \Auction design in day-ahead electric-ity markets", IEEE Transactions on Power Systems, 16(3), pp. 409-417 (2001).
17. Su, C. and Kirschen, D. \Direct participation of demand-side in a pool-based electricity mar-ket", POWER SYSTEM TECHNOLOGY-BEIJING-, 31(20), p. 7 (2007).
18. Kirschen, D.S., Strbac, G., Cumperayot, P., and de Paiva Mendes, D. \Factoring the elasticity of demand in electricity prices", IEEE Transactions on Power Systems, 15(2), pp. 612-617 (2000).
19. Nguyen, D.T., Negnevitsky, M., and De Groot, M. \Pool-based demand response exchange-concept and modeling", IEEE Transactions on Power Systems, 26(3), pp. 1677-1685 (2011).
20. Khodaei, A., Shahidehpour, M., and Bahramirad, S. \Scuc with hourly demand response considering in-tertemporal load characteristics", IEEE Transactions on Smart Grid, 2(3), pp. 564-571 (2011).
21. Fu, Y., Shahidehpour, M., and Li, Z. \Security-constrained unit commitment with Ac constraints", IEEE Transactions on Power Systems, 20(3), pp. 1538-1550 (2005).
22. Wu, H., Guan, X., Zhai, Q., and Ye, H. \A system-atic method for constructing feasible solution to scuc problem with analytical feasibility conditions", IEEE Transactions on Power Systems, 27(1), pp. 526-534 (2012).
23. Bussieck, M.R. and Vigerske, S. \MINLP solver soft-ware", Wiley encyclopedia of operations research and management science (2010).
Biographies
Ebrahim Zarei received his MSc degree from the Electrical Engineering Department of Shahid Bahonar University of Kerman/Iran. His research interests in-clude operation, scheduling power plants, smart grids, renewable energy modeling, analysis and control. Mohammad Hasan Hemmatpour received his BS, MSc, and PhD degrees in Electrical Engineering from the Shahid Bahonar University of Kerman, Iran as an honor student in 2009, 2012, and 2016, respectively. Currently, he is an Assistant Professor at the Electrical Engineering Department of Jahrom University/Iran. His research interests include operation, controls and analysis of microgrids, optimization techniques, and renewable energy modeling.
Mohsen Mohammadian received her BS degree in Electrical Engineering from Sharif University, and his MSc and PhD degrees in Electrical Engineering from K.N. Toosi University, Tehran. He is as an Assistant Professor from the Electrical Engineering Department of Shahid Bahonar University of Kerman, Iran. His current research interests include non-linear control, intelligent control, and control of complex systems, such as hybrid electric vehicles and power systems.