Acknowledgement
First, I would like to give special thanks to my supervisor Dr. Yun Li, Department of
Biostatistics, University of North Carolina in Chapel Hill, for provide me with an opportunity and exceptional direction to conduct research as an undergraduate student. With this opportunity, I have been exposed to the research works of genetic statisticians and research life of PhD
candidates. With her guidance, I understand the mechanisms and theories behind genotype imputation and completed genotype imputation on a sample of Asian descendants for data analysis.
I am thankful to Dr. Yuchen Yang and Huijun for advising me through the codes, Maddie for providing me explanations, and Jonathan Rosen for preparing me with research. I would also like to thank all members of my Dr. Yun Li's lab for the support they have provided me.
Abstract
As a result of increasing interests in discovering single nucleotide polymorphisms (SNPs) associated complex diseases and high cost of existing sequencing technology, genotype
imputation is developed as a statistical method to overcome the limitations of current sequencing technology and to increase the power of the association method of Genome-Wide Association Studies (GWAS). In this paper, genotype imputation is conducted on Tianjin sample with two reference panels; the 1000 Genomes reference panel and the TOPMed reference panel. First, pre-imputation quality control is applied to remove individuals or genetic markers that may induce high error rates when conducting imputation. Principal component analysis was conducted to show the East Asian ancestry of the sample. Using Minimac3, imputation was performed on a sample of 437 individuals with 499,148 genetic variants after haplotype inference with Eagle software from Illumina 660W. Approximately 47 million and 88 million genetic variants were imputed using 1000G and TOPMed reference panels respectively. The estimated squared Pearson's correlation (R2) was used to determine which of the imputed SNPs passed the post-imputation quality control. Approximately 9.5 million imputed SNPs from the 1000G reference panel and 11 million imputed SNPs from the TOPMed reference panel exceeded the R2
Introduction
The National Human Genome Research Institute (NHGRI) Catalog of Published
Genome-Wide Association Studies (GWAS) is a publicly available catalog, which encompasses 3,420 publications of 62,652 unique Single Nucleotide Polymorphisms (SNPs) that are
associated with complex diseases or other specific traits (Welter et al. 2014; Burdett et al. 2018). Many of the discoveries were conducted with genotype imputation, a crucial statistical technique that uses haplotype patterns from genotyped reference panels to accurately predict genetic markers of a study sample after sequencing a small amount of genotypes on a commercial array (Li et al. 2009).
One may wonder the intention for using this type of “incomplete” information instead of sequencing the whole genome of every individual in the sample to test for association (Li et al. 2009). The cost and time required to conduct whole genome sequencing of a sample with thousand(s) of individuals is currently unfeasible. The first human genome sequence was conducted with Sanger DNA sequencing, developed in 1977 and costed 0.5-1 billion dollars (Reuter et al. 2015; Sanger et al. 1977). In the last 40 years, much advancement has been made with ‘next generation’ DNA sequencing (NGS) - supplanted Sanger sequencing with reduction in cost and time required to sequence DNA and RNA (Shendure et al. 2017; Spiliopoulou et al. 2017). Although sequencing technologies have improved speed, cost, and quality over the last several decades, the error rate remains between 0.5%-1.0% errors per raw base, which is considerably high (Li et al. 2011). However, such limitations of DNA sequencing can be resolved with genotype imputation.
characterized reference panel (Howie et al. 2009; Howie et al, 2011; Howie et al. 2012). This technique can also be used to increase power of GWAS analyses, allowing researchers to conduct meta-analysis of GWAS and analyze the results from multiple studies that depend on different genotyping platforms (Browning et al. 2009; Howie et al. 2011; Li et al. 2010; Welter et al. 2014).
Genotype imputation has led to the discoveries of thousands of SNP-trait associations, which have substantially impacted human health. Researchers and doctors will have a deeper understanding of genetically-associated diseases, thus enabling them to develop better methods to detect, treat, and prevent diseases (Genome-Wide Association Studies 2015). Genetics researchers have claimed that genotype imputation is a necessary tool used in GWAS to accurately impute the unobserved genotypes, and the research goal is to implement genotype imputation on a sample of 437 Tianjin women with 499,257 variants and evaluate the results of the genotype imputation using 1) estimated R-square hat and 2) 5% masking process of the genotyped genetic variants.
Materials and Method
A sample of 445 participants from Tianjin, China is genotyped using Illumina 660 SNP array. A total of 560,525 genetic markers were genotyped and may be used to conduct genotype imputation in order to assess the SNPs-lung cancer association. 1000 Genomes reference panel and TOPMed reference panel were used to complete the imputation process.
Pre-imputation quality control is conducted on both sample and marker level to remove individuals or markers that may induce high error rates when performing imputation. It is assumed that the removal of a small sample of genotyped data will not significantly affect the overall power of the study. However, it should be noted that the removal of any SNP could lead to an overlooked SNPs-trait association even though the genotype imputation can recover the removed SNPs.
First, sample-level quality control was performed based on the following three criteria: 1) call rate, 2) gender checking, and 3) relatedness. With regards to call rate, individuals with more than 10% missing genotypes were removed. Then the individuals with discordant sex
information using the X chromosome from the genotype data were identified and removed from further analysis. Lastly, individuals in a sample are expected to be unrelated from each other to ensure no genotypes are over-represented and to keep a fair reflection of the allele frequency of the sample. In this case, assessment is conducted on the degree of shared alleles between pairs of individuals. The maximum relatedness between any pair of individuals is the third degree
relative; thus, one individual is removed from each pair when pairs are third-degree relative or less.
error, thus markers with a p-value threshold < 10-6 are removed. Lastly, SNPs with minor allele frequency (MAF) <0.5% are removed. Although the goal of quality control is to produce more accurate imputed genotypes, genotyping errors can still persist after pre-imputation quality control. Both sample-level and marker level pre-imputation quality control was conducted using plink program v.190 (Chang et al. 2015).
M.2 Principal Component Analysis (PCA)
After the removal of individuals and markers that may have particularly high error rates, a joint PCA, sample combined with the 1000 Genomes (1000G) reference panel, was conducted to identify the ancestry of the sample and discern outliers using the smartpca program of the EIGENSOFT software package v. 6.1.4 (Patterson et al. 2006). PCA is a mathematical method that reduces large sets of potentially correlated variables to a number of uncorrelated variables, which are called principal components (Reich, David, et al). The first principle component accounts for the greatest variability in the data, while the succeeding principle components account for the remaining variability (Reich, David, et al).
chromosomes merged into one dataset. SNPs with missing call rate over 10% were filtered from the merged dataset. SMARTpca is used to generate the principle components for each individual, and the first two principal components are plotted to display the ancestry of the sample.
M.3 Strand-Flip
SNPs were genotyped with microarray on either the forward or reverse strand. Strand-flip was conducted to ensure the SNPs from the study sample and the reference panels are coded to the same allele to improve imputation accuracy. Non-ambiguous SNPs, which are SNPs that are not A/T or C/G, are easier to detect. When more than two individuals in the sample study have genotyped on a different strand compared to the reference panel, plink v.1.90 is used to flip the SNPs. The frequencies of the minor alleles for each data are computed to compare to that of the alleles in the reference panels in order to identify the variants that need to be flipped. For ambiguous SNP with MAF >0.55 in sample study but <0.45 in reference, they would be flipped using plink v.1.90. However, if an ambiguous SNP with MAF of 0.45 to 0.55, then the SNP is not flipped due to the uncertainty.
M.4 Pre-phasing and Imputation
This study uses Eagle v.2.3.5 (Loh et al. 2016) for pre-phasing with 1000G as the reference panel. This step is included to discern markers that are located on the same chromosomes. Then Minimac3 v.2.0.1 (Das et al. 2016) is used to perform imputation.
M.5 Post Imputation Quality Control
comparing the variance of the imputed allele counts to the theoretical expectation of the variance of allele counts using Hardy-Weinberg equilibrium. For genetic variants that are poorly imputed, the variability will be much less than that of the theoretical expectation, thus leading to a low R2 value. An R2 threshold of 0.30 will be used and all variants with R2 value above 0.30 are then used to calculate the average R2. If the average is above 0.80, then the threshold used suggests that the majority of the bad imputed SNPs have been removed from the overall imputed sample. However, when the average R2 value is below 0.80, then the original threshold of 0.30 will be raised by 0.10 each time until the average R2 value is above 0.80. It is expected that 70% of the badly imputed SNPs will be removed with this method of evaluation.
M.6 Post Imputation Quality Assessment
Since the R2 value is estimated without having the true genotypes, then it is uncertain how valid the imputations were on this study sample. To validate the quality of the imputation on this Tianjin sample study, R2 values between imputed genotypes and true genotypes are
calculated by randomly removing 5% of the directly genotyped SNPs from the dataset. Then the remaining 95% of the directly genotyped genetic variants are again used to conduct imputation with Minimac3. To ensure at least some genetic variants with low minor allele frequency (MAF) would be included in the evaluation process, masking 5% of the directly genotyped variants was conducted 10 times and evaluated altogether. With this method, the imputation quality is
evaluated by calculating the true squared Pearson's correlation of the 5% removed genotypes. Ten samples of imputed genetic variants of three chromosomes (1, 11, and 21) of distinctively different sizes were selected to assess the imputation quality of this sample.
R.1 Pre-imputation Quality Control Results
For sample-level quality control, the three standards are call rate, gender-checking, and relatedness of the sample. All 455 individuals have less than 10% missing rate. In this study, only female participants are of interest; therefore, two male participants and one ambiguous sex participant based on (table 1). Sexuality is inferred with F estimates, which is an indicator of sex call. Female participants should have a estimate of < 0.2 and male participants have a F-estimate of > 0.8.
Table 1: Individuals with Ambiguous Sex Individual
ID
Pedigree Sex SNP Sex Predicted
Sex
Status F estimate
TGS095013 Female 0 Unknown Problem 0.4199
TGS024524 Female 1 Male Problem 0.9997
TGS072771 Female 1 Male Problem 1.000
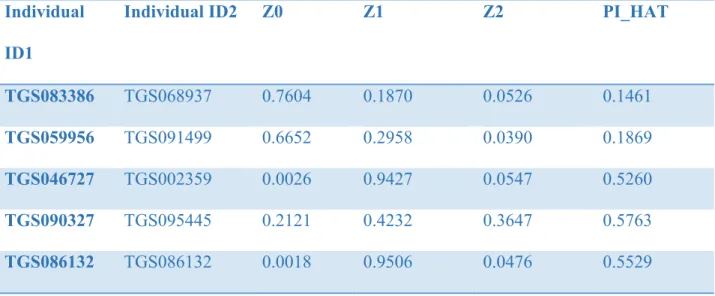
Lastly, sample relatedness checking using pairwise IBD (identity by descent) estimate was used to determine individuals who appear to be more related than expected in a random sample. The probability of sharing 0, 1, or 2 alleles IBD for any two individuals is estimated to calculate PI-HAT. A threshold of PI-HAT ≤ 0.125, equate to a 3rd degree or less relatedness. Five pairs of individuals were too closely related, thus the second member of each pair is removed from further analysis (table2). After conducting sample level quality control, 8 participants were removed from the sample, and 437 participants were left in the sample for marker level quality control (table 3).
Individual
ID1
Individual ID2 Z0 Z1 Z2 PI_HAT
TGS083386 TGS068937 0.7604 0.1870 0.0526 0.1461
TGS059956 TGS091499 0.6652 0.2958 0.0390 0.1869
TGS046727 TGS002359 0.0026 0.9427 0.0547 0.5260
TGS090327 TGS095445 0.2121 0.4232 0.3647 0.5763
TGS086132 TGS086132 0.0018 0.9506 0.0476 0.5529
Table 3: Results from Sample Level Quality Control
Criteria # Participants Percent
Call rate <90% 0 0.00%
Gender Check 3 0.67%
Relatedness 5 1.12%
In regards to marker level quality control, SNPs with a call rate of less than 95%, or an extreme departure from HWE (p<1X10⁻⁶), or a minor allele frequency of less than 0.005 were excluded from the sample. A total of 1,009 SNPs were found to have a call rate of less than 95%, 283 SNPs were qualified as having an extreme deviation from the HWE, and 60,085 SNPs were excluded due to having a MAF <0.5%. A summary of the number of and the percentage of SNPs removed are shown in table 4. As a result, a total of 61,377 variants were removed from sample, and 499,148 variants passed the quality control test.
Criteria SNPs Percent
Call rate < 95% 1009 0.18
Deviation from HWE 283 0.05
MAF < 0.005 60085 10.72
As a result of quality control on both sample and marker level, the sample is left with 437 Tianjin female individuals with 499,148 genetic variants.
R.2 Principle Component Analysis (PCA)
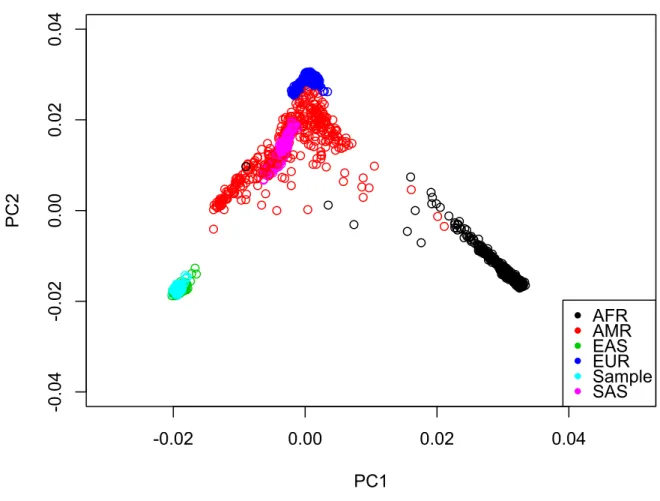
Figure 1: Joint PCA of Tianjin Individual Sample with 1000G Phase 3 Reference Panel
AFR: African; AMR: American; EAS: East Asian; EUR: European; SAS: South Asian
All the individuals of the Tianjin sample are clustering together with the East Asian cohort of the 1000G-reference panel. Thus the Tianjin sample has individuals of only East Asian descent and it can be noted that there are no outliers in this sample.
R.3 Strand flipping results
-0.02 0.00 0.02 0.04
-0
.0
4
-0
.0
2
0.00
0.02
0.04
PC1
PC
2
AFR AMR EAS
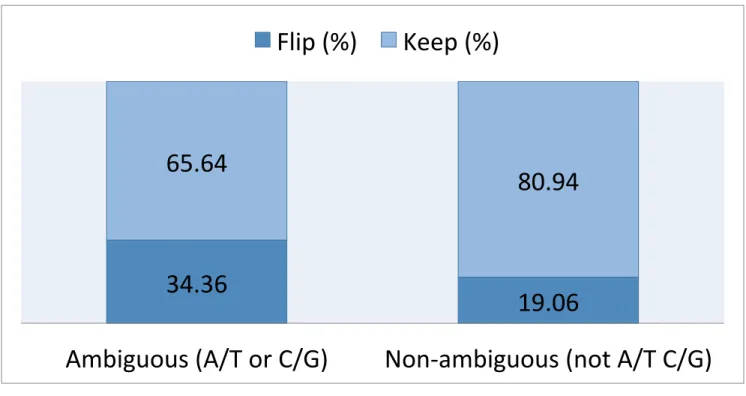
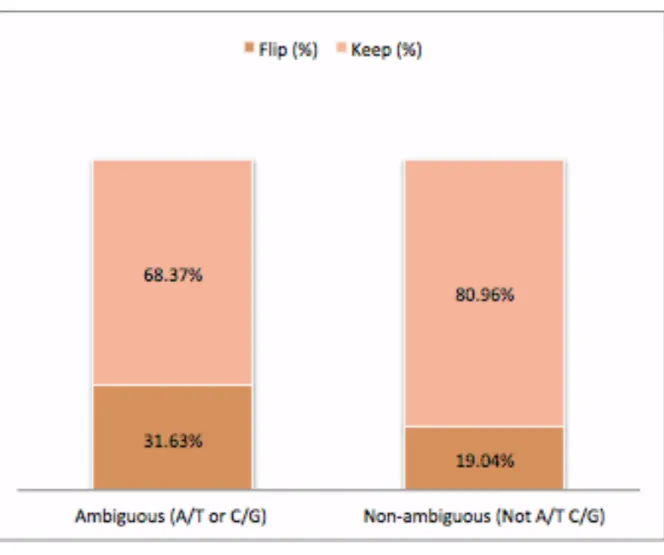
By calculating the frequencies of the MAF for each SNP, 503 ambiguous and 94,849 non-ambiguous SNPs were identified that needed to be flipped to ensure alleles from the sample and the 1000G reference panel are labeled consistently. For TOPMed reference panel, 453 ambiguous and 92,834 non-ambiguous SNPs were flipped. The proportions of SNPs flipped and kept for 1000G and TOPMed reference panel are shown in figure 2 and 3 respectively.
Figure 2: Percept of SNPs Flipped or Kept
34.36
19.06
65.64
80.94
Ambiguous (A/T or C/G)
Non-ambiguous (not A/T C/G)
Figure 3: Percent of SNPs Flipped or Kept for TOPMed Reference Panel
R.4 Pre-phasing Imputation Results
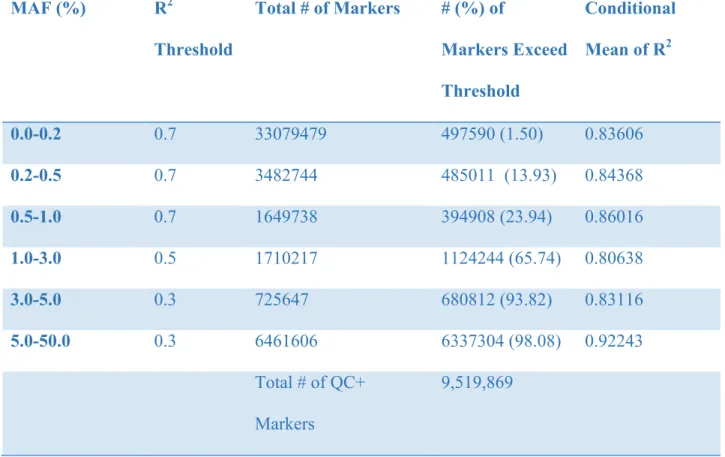
Based on the imputation results, approximately 47 million SNPs were imputed using Minimac3. Rare genetics variants (SNPs with MAF of 0.0-1.0%) must surpass an R2 threshold of 0.7 for their conditional mean of R2 value to be above 0.80. Even though majority of the imputed SNPs are from genetic variants with MAF of 0.0-0.2%,, only approximately 1.50% of the
imputed SNPs passed the post-imputation quality control. Approximately 13.93% of the imputed SNPs with MAF of 0.2-0.5 and 23.94% of the imputed SNPs with MAF of 0.5-1.0% are
are well imputed using a R2 threshold of 0.3, which is considerably great. As the MAF increases, the percentage of SNPs that exceed the R2 threshold also increases. In total, 9.5 million imputed markers passed the post imputation quality control with 1000G reference panel.
Table 5: Summary Statistics of Imputation Quality of Tianjin Sample for 1000G Reference Sample
MAF (%) R2
Threshold
Total # of Markers # (%) of
Markers Exceed
Threshold
Conditional
Mean of R2
0.0-0.2 0.7 33079479 497590 (1.50) 0.83606
0.2-0.5 0.7 3482744 485011 (13.93) 0.84368
0.5-1.0 0.7 1649738 394908 (23.94) 0.86016
1.0-3.0 0.5 1710217 1124244 (65.74) 0.80638
3.0-5.0 0.3 725647 680812 (93.82) 0.83116
5.0-50.0 0.3 6461606 6337304 (98.08) 0.92243
Total # of QC+
Markers
9,519,869
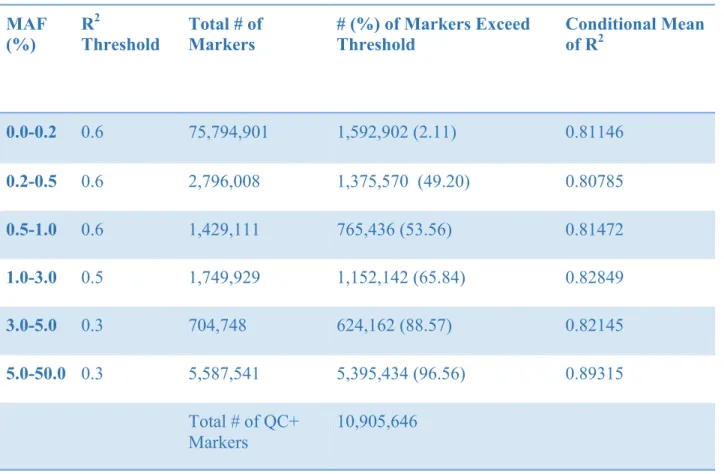
passed the post-imputation quality control. Similar pattern is observed using TOPMed reference panel, in which as the MAF increases, higher percentage of the imputed SNPs are regarded as “well-imputed.” Overall, almost 11 million imputed markers passed the post imputation quality control with TOPMed reference panel.
Table 6: Summary Statistics of Imputation Quality of Tianjin Sample for TOPMED reference Panel
MAF (%)
R2
Threshold
Total # of Markers
# (%) of Markers Exceed Threshold
Conditional Mean of R2
0.0-0.2 0.6 75,794,901 1,592,902 (2.11) 0.81146
0.2-0.5 0.6 2,796,008 1,375,570 (49.20) 0.80785
0.5-1.0 0.6 1,429,111 765,436 (53.56) 0.81472
1.0-3.0 0.5 1,749,929 1,152,142 (65.84) 0.82849
3.0-5.0 0.3 704,748 624,162 (88.57) 0.82145
5.0-50.0 0.3 5,587,541 5,395,434 (96.56) 0.89315
Total # of QC+
Markers
10,905,646
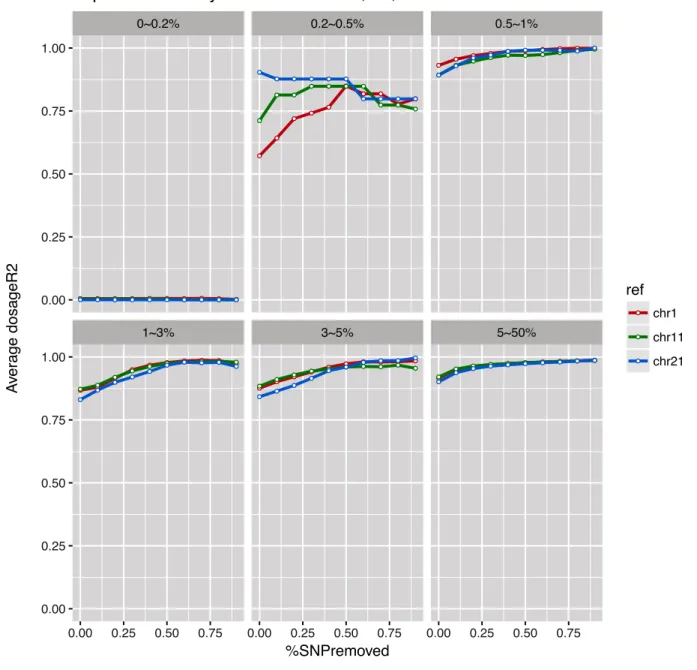
R.5 Evaluation of Imputation with 5% masked
To see how well Minimac3 recovers the 5% masked SNPs from the sample, R was used to create qqplots using two variables -the average dosage R2 and the percentage of badly imputed SNPs removed.
With 1000G reference panel, figure 4, it can be observed that genetic variants with MAF of <0.2% have an average dosage R2 less than 0.10 despite removing 90% of all the bad SNPs. Similarly, most SNPs with MAF of 0.2-0.5% did not have the average dosage R2 above 0.80 after removing a considerable amount of badly imputed SNPs. However, for SNPs with MAF of > 0.5%, almost all imputed SNPs from the three chromosomes have an average dosage R-square of greater than 0.80 without the removal of any SNPs, indicating that approximately 100% of the
● ● ● ● ● ● ● ● ● ● ● ● ● ● ● ● ● ● ● ● ● ● ● ● ● ● ● ● ● ● ● ● ● ● ● ● ● ● ● ● ● ● ● ● ● ● ● ● ● ● ● ● ● ● ● ● ● ● ● ● ● ● ● ● ● ● ● ● ● ● ● ● ● ● ● ● ● ● ● ● ● ● ● ● ● ● ● ● ● ● ● ● ● ● ● ● ● ● ● ● ● ● ● ● ● ● ● ● ● ● ● ● ● ● ● ● ● ● ● ● ● ● ● ● ● ● ● ● ● ● ● ● ● ● ● ● ● ● ● ● ● ● ● ● ● ● ● ● ● ● ● ● ● ● ● ● ● ● ● ● ● ● ● ● ● ● ● ● ● ● ● ● ● ● ● ● ● ● ● ●
1~3% 3~5% 5~50%
0~0.2% 0.2~0.5% 0.5~1%
Figure 5:True Average Dosage R2 for chromosomes 1, 11, 21 with TOPMED Reference Panel
With TOPMed reference panel, a similar pattern is observed. The average dosage R2 is very low for genetic variants with MAF of <0.2%. For SNPs with MAF of 0.2-0.5%,
chromosomes showed an unusual pattern of decreasing in R2 value after the removal of 50% of the poorly imputed SNPs, indicating there was some noise in the computation. SNPs with MAF of > 0.5% showed a strong recovery since all the imputed SNPs from the three chromosomes have an average dosage R2 of greater than 0.80 without the removal of any SNPs, indicating that
● ● ● ● ● ● ● ● ● ● ● ● ● ● ● ● ● ● ● ● ● ● ● ● ● ● ● ● ● ● ● ● ● ● ● ● ● ● ● ● ● ● ● ● ● ● ● ● ● ● ● ● ● ● ● ● ● ● ● ● ● ● ● ● ● ● ● ● ● ● ● ● ● ● ● ● ● ● ● ● ● ● ● ● ● ● ● ● ● ● ● ● ● ● ● ● ● ● ● ● ● ● ● ● ● ● ● ● ● ● ● ● ● ● ● ● ● ● ● ● ● ● ● ● ● ● ● ● ● ● ● ● ● ● ● ● ● ● ● ● ● ● ● ● ● ● ● ● ● ● ● ● ● ● ● ● ● ● ● ● ● ● ● ● ● ● ● ● ● ● ● ● ● ● ● ● ● ● ● ●
1~3% 3~5% 5~50%
0~0.2% 0.2~0.5% 0.5~1%
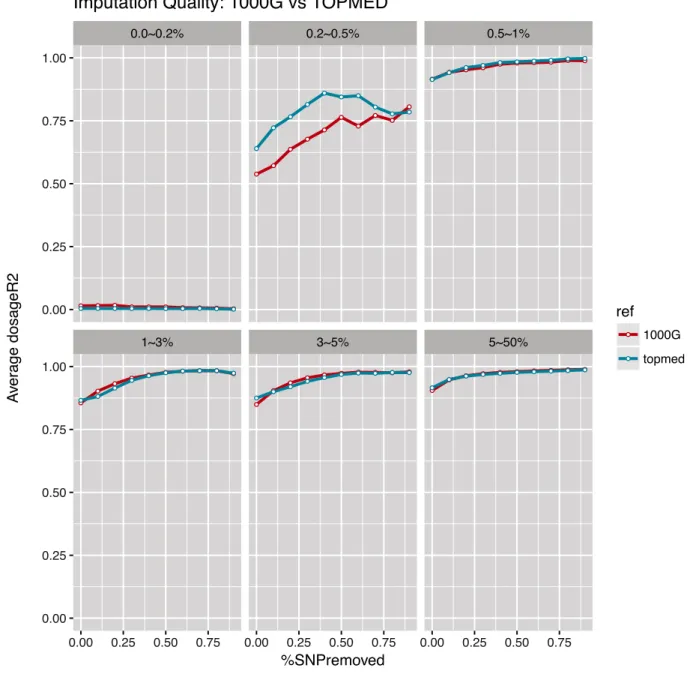
Figure 6:Comparing 1000G Reference Panel with TOPMED Reference Panel using 5% Masking Process
Figure 6 is combining the masking results of the three chromosomes, 1, 11, and 21 using two different reference panels. There is not a considerable difference in using either panels in different MAF categories, although TOPMed performed slightly better in the MAF category of 0.2-0.5%. Overall, the difference between the two reference panels is miniscule and both are useful for conducting imputation.
● ● ● ● ● ● ● ● ● ● ● ● ● ● ● ● ● ● ● ● ● ● ● ● ● ● ● ● ● ● ● ● ● ● ● ● ● ● ● ● ● ● ● ● ● ● ● ● ● ● ● ● ● ● ● ● ● ● ● ● ● ● ● ● ● ● ● ● ● ● ● ● ● ● ● ● ● ● ● ● ● ● ● ● ● ● ● ● ● ● ● ● ● ● ● ● ● ● ● ● ● ● ● ● ● ● ● ● ● ● ● ● ● ● ● ● ● ● ● ●
1~3% 3~5% 5~50%
0.0~0.2% 0.2~0.5% 0.5~1%
Discussion
With genotype imputation, approximately 47 million and 88 million genetic variants were imputed with 1000G and TOPMed reference panel, respectively. However, only approximately 9.5 million from 1000G and 11 million from TOPMed of the imputed genetic variants qualify as “well-imputed” and can be used in further analysis. It should be noted that even though the majority of the imputed SNPs were SNPs with MAF<0.2% and only approximately 2% of the imputed SNPs in that category passed the post imputation quality control, the percentage of “well-imputed” SNPs increases with increasing MAF. Thus, imputation is more difficult with rare variants, which is also verified with the 5% masking process. All genetic variants in the category of 0.0-0.2% did not recover using either of the reference panels. While approximately 50% of the genetic variants were recovered in the 0.2-0.5% category, almost all genetic variants with MAF >0.5% were recovered. Thus, even though genotype imputation may not have reached high accuracy for rare genetic variants, imputation is still highly accurate for variants greater than 1%. Despite the large number of imputed SNPs that did not pass quality control, it is still valid to conclude that genotype imputation is a highly accurate statistical tool since it was able to recover most of the masked SNPs using Minimac3. Thus the imputation accuracy for this sample study is still high.
One limitation of this study is the study sample size. With only 499,148 genetic variants available to conduct imputation, it was limiting the accuracy of rare SNPs; therefore, limiting the number of imputed genetic variants that could be used to assess association with lung cancer. Additionally, even though TOPMed reference panel imputed more genetic variants that can be used for further analysis, it is still difficult to assess whether TOPMed reference panel
outperforms 1000G reference panel. With a larger sample size, the comparison between the two reference panels can be done more vividly.
References
Browning, B. L., & Browning, S. R. (2009). A Unified Approach to Genotype Imputation and Haplotype-Phase Inference for Large Data Sets of Trios and Unrelated Individuals. American Journal of Human Genetics, 84(2), 210–223. http://doi.org/10.1016/j.ajhg.2009.01.005 Burdett, T., Hastings, E., Welter, D., &N. (2018, June 25). GWAS Catalog. Retrieved July 9, 2018, from http://ebi.ac.uk/gwas/
Genome-Wide Association Studies Fact Sheet (2015, August 27). Retrieved July 9, 2018, from https://www.genome.gov/20019523/genomewide-association-studies-fact-sheet/
Howie, B. N., Donnelly, P., & Marchini, J. (2009). A Flexible and Accurate Genotype Imputation Method for the Next Generation of Genome-Wide Association Studies. PLoS Genetics, 5(6), e1000529. http://doi.org/10.1371/journal.pgen.1000529
Howie, B., Marchini, J., & Stephens, M. (2011). Genotype Imputation with Thousands of Genomes. G3: Genes|Genomes|Genetics, 1(6), 457–470. http://doi.org/10.1534/g3.111.001198 Howie, B., Fuchsberger, C., Stephens, M., Marchini, J., & Abecasis, G. R. (2012). Fast and accurate genotype imputation in genome-wide association studies through pre-phasing. Nature Genetics, 44(8), 955–959. http://doi.org/10.1038/ng.2354
Li, Y., Sidore, C., Kang, H. M., Boehnke, M., & Abecasis, G. R. (2011). Low-coverage sequencing: Implications for design of complex trait association studies. Genome Research, 21(6), 940–951. http://doi.org/10.1101/gr.117259.110
Li, Y., Willer, C., Sanna, S., & Abecasis, G. (2009). Genotype Imputation. Annual Review of Genomics and Human Genetics, 10, 387–406.
http://doi.org/10.1146/annurev.genom.9.081307.164242
Reich, David, et al. “Principal Component Analysis of Genetic Data.” Nature News, Nature Publishing Group, 1 May 2008, www.nature.com/articles/ng0508-491.
Reuter, J. A., Spacek, D., & Snyder, M. P. (2015). High-Throughput Sequencing Technologies. Molecular Cell, 58(4), 586–597. http://doi.org/10.1016/j.molcel.2015.05.004
Sanger, F., Nicklen, S., & Coulson, A. R. (1977). DNA sequencing with chain-terminating inhibitors. Proceedings of the National Academy of Sciences of the United States of America, 74(12), 5463–5467.
Spiliopoulou, A., Colombo, M., Orchard, P., Agakov, F., & McKeigue, P. (2017). GeneImp: Fast Imputation to Large Reference Panels Using Genotype Likelihoods from Ultralow Coverage Sequencing. Genetics, 206(1), 91–104. http://doi.org/10.1534/genetics.117.200063
Welter, D., MacArthur, J., Morales, J., Burdett, T., Hall, P., Junkins, H., … Parkinson, H. (2014). The NHGRI GWAS Catalog, a curated resource of SNP-trait associations. Nucleic Acids
Research, 42(Database issue), D1001–D1006. http://doi.org/10.1093/nar/gkt1229