i
FLOODING/PIPE SURCHARGING AT UNIVERSITY OF NORTH CAROLINA AT SCIENCE COMPLEX
Reena Suhag
A technical report submitted in partial fulfillment of the requirements for the degree of Master of Science in Environmental Engineering in the Department of Environmental Sciences and Engineering of the Gillings School of Global Public Health at the University of North Carolina at
Chapel Hill
Chapel Hill 2016
ii © 2016 Reena Suhag
ALL RIGHTS RESERVED
iii
ABSTRACT
Reena Suhag: Flooding/Pipe Surcharging at University of North Carolina at Science Complex (Under the direction of Pete Kolsky)
iv
ACKNOWLEDGEMENTS
I would first like to express my sincere gratitude to my advisor Dr. Pete Kolsky for providing me with the opportunity to work with him and his continuous support and guidance. Thank you for your motivation, enthusiasm, patience and encouragement during my graduate studies at UNC, Chapel Hill. The door to Dr. Kolsky’s office was always open whenever I ran into trouble or had a question or a doubt. I could not have imagined having a better advisor and mentor.
Besides my advisor, I would like to thank my other committee members: UNC ESD Stormwater Engineer, Sally Hoyt, and Dr. Glenn Walters for serving on my committee, their encouragement, and insightful comments. Sally, I am immensely thankful to you for your constant support, assistance and always making time for the meetings throughout the entire process. Thank you for providing me with all the information for the project and EPA SWMM models for the UNC campus stormwater system.
Next, I would like to thank Daniel Wiebke, also from UNC ESD, for his time, invaluable suggestions, inputs, and guidance regarding SWMM.
v
TABLE OF CONTENTS
LIST OF FIGURES VI
LIST OF TABLES IX
LIST OF ABBREVIATIONS X
1. INTRODUCTION 1
2. PROBLEM IDENTIFICATION 3
2.1 Introduction 3
2.2 Flooding Problem: Causes 3
2.3 Significance of the Problem 4
2.4 Site Background 7
2.5 SWMM Analysis 9
3. SOLUTION DEVELOPMENT & ANALYSIS 15
3.1 Introduction 15
3.2 Design Criteria 15
3.3 Solutions and Options 16
3.4 Solution Development 17
3.5 Comparison of Solutions 41
4.0 IMPLEMENTATION PLAN & COST ANALYSIS 47
4.1 Introduction 47
4.2 Implementation Plan 47
4.3 Cost & Cost-Benefit Analysis 55
5.0 CONCLUSIONS 61
APPENDIX 63
Section 1 SWMM Model Data Input and Status Report 63
Section 2 Cost Estimation for different options 70
vi
LIST OF FIGURES
Figure 1: Flooding at Murray/Kenan Loading Dock 5
Figure 2: Flooding outside Kenan Lab 5
Figure 3: After flood at Murray/Kenan Loading Dock 5
Figure 4: After flood at the Loading Dock 5
Figure 5:Compactors after Flood at Loading Dock 6
Figure 6: After Flood at Murray Loading Docks 6
Figure 7: Transformers-Flooding outside Kenan Lab 7
Figure 8: After Flood at Murray Parking Lot 7
Figure 9: Morehead and Kenan Labs as located on UNC campus map (“UNC Campus”) 7 Figure 10: Map showing delineation of Sub-catchments at Science Complex site. 8 Figure 11: Map of type of Land Cover at Morehead & Kenan Labs (Science Complex) 9 Figure 12: Modified model showing different sub-catchments used for the analysis 12 Figure 13: Modified SWMM model showing all inlet nodes, conduits and conduit
Size at the Science Complex site and surrounding areas 13
Figure 14:Water Elevation Profile for the site for SCS 2 year, 24 hour storm event 14 Figure 15: Water Elevation Profile for the site for SCS 100 year, 24 hour storm event 14 Figure 16: UNC Storm water Performance Criteria, Design Standards and Procedures 16 Figure 17: Water Elevation Profile for the site for SCS 100 year, 24 hour storm showing HGL and nodes for flow change, flooding and meeting with other tributaries from other
Sub-catchments 18
Figure 18: FedEx Centre Tributary covering Sub-catchments FedEx 1, 2 &
Science Complex 4,11,12,14 19
Figure 19: Northern Tributary covering Sub-catchments Science Complex 5,
6, 7, 8, 9 & 10 19
Figure 20: Water Elevation Profile on increasing the size of conduits downstream for
vii
Figure 21: Water Elevation profile after the proposed change in the size of the existing
Pipes for SCS 100 year, 24 hour storm 22
Figure 22: Total inflows to the system and existing capacity of the system for SCS
100 year, 24 hour storm 23
Figure 23: Location of New Proposed Pipes (case A) 24
Figure 24: Alternate route for the New Proposed Pipes (Case A) 24 Figure 25: Water Elevation for existing pipes after adding new proposed pipes for
SCS 100 year, 24 hour storm (Case A) 25
Figure 26: Water Elevation Profile for the new proposed pipes for SCS 100 year,
24 hour storm (Case A) 26
Figure 27: Schematic showing peak flows (100yr, 24hr storm) for the system after
Addition of new pipes (Case A) 26
Figure 28: Water Elevation Profile for FedEx Centre Tributary (Upstream) for
SCS 10 year, 24 hour storm event (Case A) 27
Figure 29: Location and size of New Proposed Pipes (Case B) 27
Figure 30: Schematic showing peak flows for SCS 100yr, 24hr storm for the system after
Addition of new pipes (Case B) 29
Figure 31: Water Elevation for the existing pipe after adding new proposed pipes for
SCS 100 year, 24 hour storm (Case B) 29
Figure 32: Water Elevation Profile for the new proposed pipes for SCS 100 year,
24 hour storm (Case B) 30
Figure 33: Water Elevation Profile for FedEx Centre Tributary (Upstream) for SCS
10 year, 24 hour storm event (Case B) 30
Figure 34: Location of New Proposed Storage Unit (SU1) 32
Figure 35: Shape of new storage unit (SU1) at node 311-B-203 33 Figure 36: Schematic showing flow through the orifice, discharge outlet for the
Storage unit (SU1) 33
Figure 37: Schematic showing flow through inlets for the storage unit (SU1) 33 Figure 38: Schematic showing flow through inlets and outlets for the storage unit (SU1) 34 Figure 39: Volume change in the storage unit (SU1) change with time during 100 year,
viii
Figure 40: Schematic showing peak flows for SCS 100yr, 24hr storm for the system after
Addition of storage unit (SU1) 35
Figure 41: Water Elevation for the system for SCS 100 year, 24 hour storm after adding new
proposed storage unit (SU1) 35
Figure 42: Water Elevation for the system for SCS 10 year, 24 hour storm after adding new
proposed storage unit (SU1) 36
Figure 43: Water Elevation Profile for FedEx Centre tributary (upstream area) for
SCS 10yr, 24hr storm event after adding storage unit (SU1) 36
Figure 44: Location of New Proposed Storage Unit (SU2) and Pipes 37 Figure 45: Discharge rate through the orifice, outlet for the storage unit (SU2), for
SCS 100yr, 24hr storm 38
Figure 46: Schematic showing peak flows for SCS 100yr, 24hr storm for the system after
addition of storage unit (SU2) and new pipes 38
Figure 47: Schematic showing peak flows for SCS 10yr, 24hr storm for the system after addition
of storage unit (SU2) and new pipes 39
Figure 48: Water Elevation for the system after adding new storage unit (SU2) and pipes for
SCS 100 year, 24 hour storm 39
Figure 49: Water Elevation for the FedEx tributary (upstream area) after adding new
Storage unit (SU2) and pipes for SCS 10 year, 24 hour storm event 40 Figure 50: Areas surrounding FedEx Centre and existing drainage route for the
Upstream water 41
Figure 51: UNC internal approval process for a project (FSD) 48 Figure 52: UNC external approval by BOG and NCGA process for a project (FSD) 50 Figure 53:UNC map showing different utilities in the Science Complex Area 54 Figure 54:Sensitivity analysis for discount rate 2-5% for the present value of benefits vs number
ix
LIST OF TABLES
Table 1: Conduits with the proposed increase in size 21
Table 2: Conduits with the proposed increase in size 25
Table 3: New proposed conduits with the proposed size and length 28 Table 4: Criteria for comparison of solution options at the Science Complex site 44 Table 5: Implementation cost for different solution options developed 45 Table 6: Cost sheet for the implementation of the recommended solution at the
Science Complex site 56
Table 7: Water Elevation Levels (in feet) at important nodes for different storm events 58 Table 8: Water Elevation Levels/HGL (in feet) at important nodes for different
Storm events after the implementation of the proposed solution 58 Table 9: Cost sheet for the implementation for resizing strategic pipes at the
Science Complex site 70
Table 10: Cost sheet for the implementation for resizing all pipes at the
Science Complex site 71
Table 11: Cost sheet for the implementation for addition of new parallel pipes at the
Science Complex site 72
Table 12: Cost sheet for the implementation for addition of storage unit (SU1) at the
Science Complex site 73
Table 13: Cost sheet for the implementation for addition of storage unit (SU2) and new
x
LIST OF ABBREVIATIONS
BOG Board of Governors of the University of North Carolina CAROLINA UNC at Chapel Hill
FP Facilities Planning
FWG Facilities Working Group
FPC Facilities Planning Committee
SCO State Construction Office
OP Office of the President
NCGA North Carolina General Assembly
OSBM State Budget Office
LF Linear Foot
CF Cubic Yard
SY Square Yard
NOAA National Oceanic and Atmospheric Administration
OWASA Orange Water and Sewer Authority
SWMM Storm Water Management Model
HGL Hydraulic Grade Line
CFS Cubic Feet per Second
EPA Environmental Protection Agency
SCS Soil Conservation Service
ESD Energy Services Department
1
1.0 INTRODUCTION
The UNC Science Complex located at 201-A South Columbia Street, Chapel Hill, is prone to flooding during heavy storm events. It experienced severe flooding during the June 30th, 2013 storm which resulted in 4-5 feet of floodwaters around loading dock between Kenan and Morehead Labs and its immediate surroundings. This also led to clogged drain inlets, and compactors floating off their guide rails, creating potentially hazardous conditions. Flooding at the site resulted in over $125,000 worth of damage. This report represents the synthesis of three technical briefs that sought to: (1) identify the nature and probable cause of the flooding at the site; (2) develop and compare a set of different technical solutions for the problem and select the best solution; and (3) create a plan and conduct cost analysis for implementation of recommended solution.
Section 2 of this report identifies and describes the problem of flooding at the Science Complex and also attempts to find the probable causes. It describes the nature, risks and costs associated with the flooding and surcharge problem, as well as some of the relevant site characteristics and factors which may contribute to flooding such as undersized pipes, an improper drainage system and poor landscaping. The process involved identifying site characteristics, and SWMM modeling to analyze the drainage system at the site.
2
3
2.0 PROBLEM IDENTIFICATION
2.1 Introduction
The problem of flooding and pipe surcharge at the UNC Science Complex located at 201-A South Columbia Street, Chapel Hill, is described in this section. The Kenan and Morehead Labs, Venable Hall, the loading docks between Murray/Kenan and its immediate surroundings are the sites being considered here. The site experienced severe flooding during the June 30th, 2013 storm resulting in 4-5 feet of floodwaters at the site. This led to clogged drain inlets from the mulch transported and deposited by the floodwaters. The flooding also led to incidents such as compactors floating off their guide rails, creating potentially hazardous conditions. This section describes: the nature, risks and costs associated with the flooding and pipe surcharging problem; as well as some of the relevant site characteristics and factors which may contribute to flooding. The section also presents some of the probable underlying problems such as undersized pipes, an improper drainage system and landscaping that exacerbate the flooding. Solutions and improvements to these problems are assessed in later sections, bearing in mind their cost, effectiveness, environmental impact, and disruption of student and community life during implementation.
2.2 Flooding Problem: Causes
4
susceptible to disruption in normal flow from a variety of different factors. Some of these factors are listed below:
1) Local topography – the local topography may limit drainage and create natural ponds during storms.
2) Drainage inlets may be inadequately sized, or obstructed by debris (litter or mulch). The number of inlets may also be inadequate.
3) Pipes could limit the drainage depending on their size, slope and condition.
The above factors are some of the possible causes of flooding at the Science Complex. These will require investigation to determine which are the most likely cause is so that engineered solutions can be developed to prevent this from occurring.
2.3 Significance of the Problem
2.3.1 Impacts of Flooding at the Science Complex Site
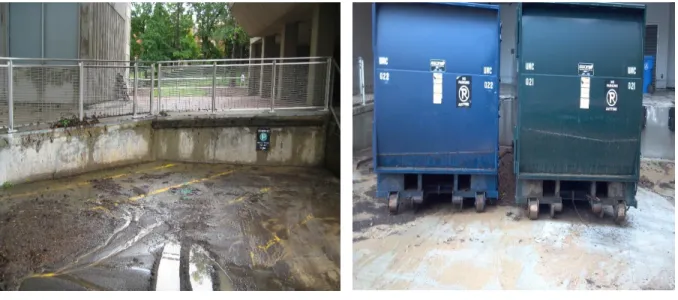
5
Figure 1: Flooding at Murray/Kenan Loading Docks Figure 2: Flooding outside Kenan Lab (Hoyt
(Folder from Hoyt named “from UNC Facilities Services”) (Folder from Hoyt named “from UNC Facilities Services”)
Figure 3: After Flood at Murray/Kenan Loading Docks Figure 4: After Flood at the Loading Docks (Hoyt) (Folder from Hoyt named “from Sally”) (Folder from Hoyt named “from UNC OWRR”)
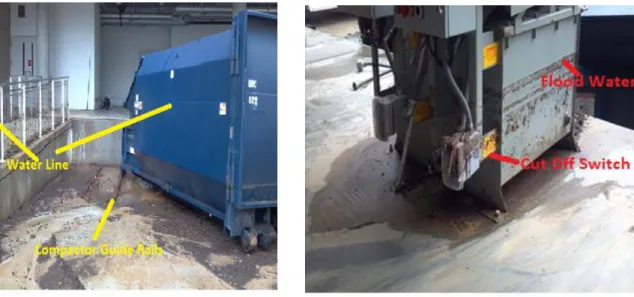
6 2.3.2 Monetary and Health Risks
The event resulted in damages of about $125,000 which includes all affected sites i.e. Kenan Labs ($21,000), Murray Hall ($52,000) and Venable Hall ($52,500) (3). Figures 5 and 6, show that the Compactors slid out of their guide rails and floated away from the loading dock. This could have potentially overturned or even crashed into the railings destroying property and posing other multiple hazards if the trash spilled into the flood waters.
Figure 5: Compactors after Flood at Loading Dock Figure 6: After Flood at Murray Loading Docks (Folder from Hoyt named “from UNC OWRR”) (Folder from Hoyt named “from UNC OWRR”)
7
Figure 7: Transformers-Flooding outside Kenan Lab Figure 8: After Flood at Murray Parking Lot (Folder from Hoyt named “from Sally”) (Folder from Hoyt named “from UNC OWRR”)
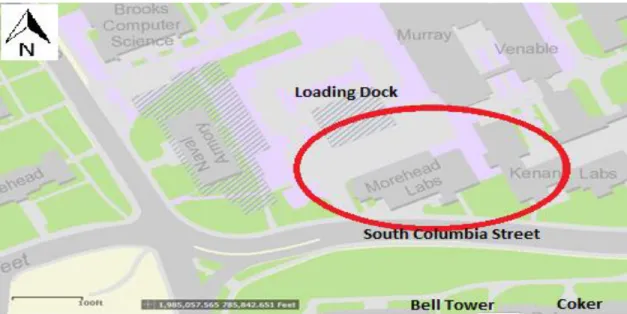
2.4 Site Background
2.4.1 Site Characteristics
The Science Complex site is located on UNC’s central campus on South Columbia Street just north of the Bell Tower and across from the Coker and Genome Science Building as seen in Figure 9.
8
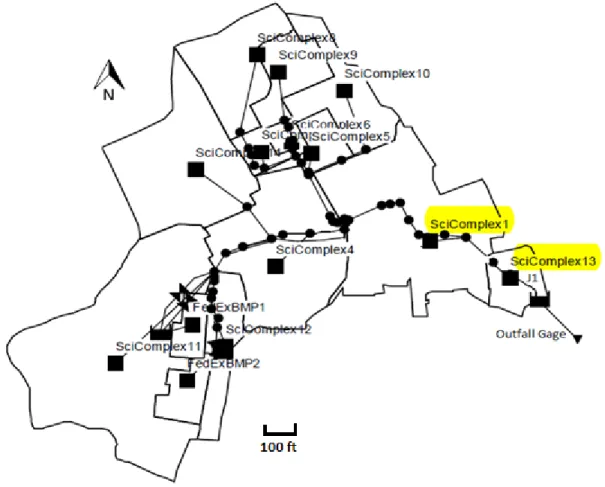
For the present study, drainage of the site was analyzed using the 2013 SWMM model, which was developed to assess storm water management at UNC. The model divides the Science Complex site into several sub-catchments for the analysis as shown in Figure 10. Sub-catchment named Science Complex 1 is the prime concern for the present study. It consists of
Morehead Labs Kenan labs Venable Hall
The loading dock between Murray Hall and Kenan Labs.
Figure 10: Map showing delineation of Sub-catchments at Science Complex site (7).
9
and impervious area, grassy areas as urban and pervious surfaces and the natural area is considered sandy loam soil with a 2% to 6% slope. The Science Complex site mainly consist of the brick paved surface which is impervious as shown in Figure 11. The 2013 SMWW model developed for UNC estimated about 77.7% of the site surface is impervious. But it should be noted that over the years more area may be paved which may result in increase in the percentage of the impervious area at the site.
Figure 11: Map of the type of Land Cover at Morehead and Kenan Labs (Science Complex) (7).
2.5 SWMM Analysis
Analysis was done based on consultation with employees of the UNC Energy Services and Facilities Planning Departments and modifying the SWMM hydraulic model provided by them.
2.5.1 SWMM: Introduction
10
Green-Ampt infiltration method (12). The Dynamic wave routing procedure estimates varying flows and water levels over time during a specified design storm, accounting for the effects of backwater and pressurized systems. In doing so, the model estimates peak flows of a defined return period storm event throughout the drainage network, and predicts the hydraulic and energy grade lines throughout the network associated with such peak flows (12).
Each sub-catchment surface is treated as a nonlinear reservoir in SWMM. Inflow comes from precipitation and any designated upstream sub-catchments. There are several outflows, including infiltration, evaporation, and surface runoff. The capacity of this "reservoir" is the maximum depression storage, which is the maximum surface storage provided by ponding, surface wetting, and interception. Surface runoff occurs only when the depth of water in the "reservoir" exceeds the maximum depression storage in which case the outflow is given by Manning's equation. Then, once available depression storage has been filled, overland flow is calculated by simultaneously solving the continuity equation and Manning equations, using sub-catchment shape, slope, and roughness as input parameters. Depth of water over the sub-catchment is continuously updated with time by solving numerically a water balance equation over the sub-catchment (11).
11
drainage system. Dynamic wave routing can account for channel storage, backwater, entrance/exit losses, flow reversal, and pressurized flow. SWMM uses the Manning equation to express the relationship between flow rate (Q), cross-sectional area (A), hydraulic radius (R), and slope (S) in all conduits (12). For standard U.S. units,
𝑄 =1.49
𝑛 𝐴𝑅
2 3⁄ 𝑆1 2⁄
where Q is discharge in cfs, R is hydraulic radius in ft., A is cross-section of flow in sq. ft., and n is the Manning roughness coefficient. The slope S is interpreted as the friction slope (i.e., head loss per unit length e.g. ft/ft). For pipes with Circular Force Main cross-sections the Hazen-Williams is used in place of the Manning equation for fully pressurized flow. For U.S. units the Hazen-Williams formula is:
𝑄 = 1.318 𝐶𝐴𝑅0.63𝑆0.54
with Q, A, R and S as above, and where C is the Hazen-Williams C-factor which varies inversely with surface roughness and is supplied as one of the cross-section’s parameters (12).
2.5.2 SWMM Modeling
12
sufficient to meet a 100-year return period storm event is required by the UNC storm water design standards.
The current model was modified such that it covers only the areas and sub catchments which affect the study area through node J1 which is an open channel down the South Road and which serves as the boundary condition for the present study. The method and input data used in the model can be found in the Appendix of this report under Section 1. The model divides the Science Complex site into several sub-catchments for the analysis as shown in Figure 12.
Figure 12: Modified model showing different sub catchments used for the analysis.
13 Morehead Labs
Kenan labs
The loading dock between Murray Hall and Kenan Labs. Node J1 (Open channel down the south road)
Figure 13: Modified SWMM model showing all inlet nodes, conduits and conduit size at the Science Complex site and surrounding areas.
14
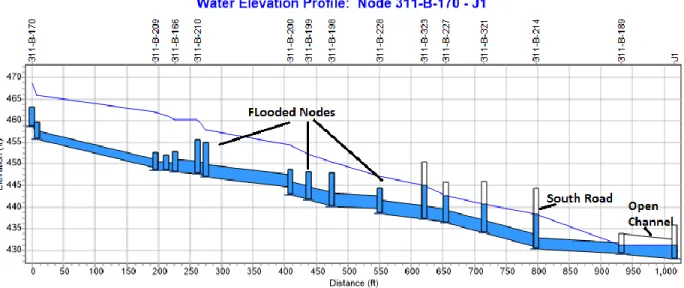
The model assumes that the 100 year 24 hour rainfall of 8.0 inch occurs according to the profile of 24hr-Type-II distribution developed by the Soil Conservation Service. It was also noted that all existing nodes and pipes at the site are flooding or surcharging even for a 2-year storm event of only 3.6 inch precipitation, which can be seen from Figure 15.
Figure 14: Water Elevation Profile for the site for SCS 100 year, 24 hour storm event (8 inch
precipitation) showing HGL and flooded nodes.
15
3.0 SOLUTION DEVELOPMENT & ANALYSIS
3.1 Introduction
This section analyzes the flooding situation at the Science Complex, develops solutions and presents the options that can alleviate the problem. The solutions have been developed based on discussions with UNC Facilities employees and using SWMM 5.1 for hydraulic modeling. The models assess the capacity of the current drainage system and simulates flooding during storm events with different return periods. The options presented below describe potential solutions in detail and compare them using five different criteria. From these comparisons the best solutions were determined and are explained in detail. The implementation of the recommended solution will be covered in the next section.
3.2 Design Criteria
Based on UNC Stormwater Performance Criteria, Design Standards and Procedures, Figure 16 below depicts the UNC’s guidelines regarding the Design Storm for different sites on the UNC campus. It also requires any site without an emergency overland flow route to be
designed for the 100 year, 24 hour storm event, where emergency route is defined as the path for
water to flow over the surface if pipe capacity is exceeded which should not be impeded by a
building, embankment, or hill. Further, any site meeting more than one condition shall use the
largest of the required storm events. Having taken these guidelines into consideration, the 100
16
Figure 16: UNC Stormwater Performance Criteria, Design Standards and Procedures (Source)
3.3 Options and Solutions
Different technical options analyzed and compared in this report include: a) Increasing pipe sizes of the strategic links,
b) Increasing pipe sizes of all the existing links, c) Adding new pipes and links,
d) Adding an appropriate storage unit to the system,
e) Adding both storage unit and new pipes to the system, and f) Maintaining status quo i.e., the option of doing nothing.
17
adding new pipes to the system can also help route upstream water from the FedEx Centre away from the site of flooding.
Addition of a storm water storage unit helps in collecting the water from the surrounding areas and storing it in order to release at a controlled rate to reduce the peak water flows during storms. The storage unit can be also be added in combination with additional pipe capacity. The final option is maintaining status quo wherein no changes are made to the site and the consequences of the flooding are endured.
Other factors that can be taken into consideration are rerouting of water coming from upstream FedEx Centre sub-catchment into other areas.
3.4 Solution Development
18
Figure 17: Water Elevation Profile for the site for SCS 100 year, 24 hour storm event showing HGL and nodes for flow change, flooding and meeting with other tributaries from other sub-catchments.
It can be seen that all the nodes along the profile upstream of the Kenan Lab i.e. node 311-B-323 are flooded and the network is not adequately sized to meet the identified design criteria of 100-year 24hr storm event. Profile analysis reveals several nodes in the discharge system where significant rises in the water elevation profile occur which can be seen in Figure 17.
19
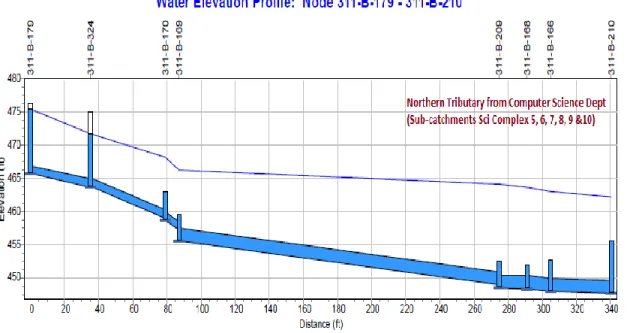
Figure 18: Showing water profile for the FedEx Centre Tributary covering Sub-catchments FedEx 1, 2 & Science Complex 4,11,12,14 for SCS 100 year, 24 hour storm event.
Figure 19: Showing water profile for the Northern Tributary covering Sub-catchments Science Complex 5, 6, 7, 8, 9 & 10 for SCS 100 year, 24 hour storm event.
20
capacity of the system) to the sub-catchments Science Complex 1 which aggravate the problem of flooding. To address the bottlenecks in the system these issues and strategic locations needs to be targeted.
3.4.1 Solution Option: Increasing Pipe Size of Strategic Links
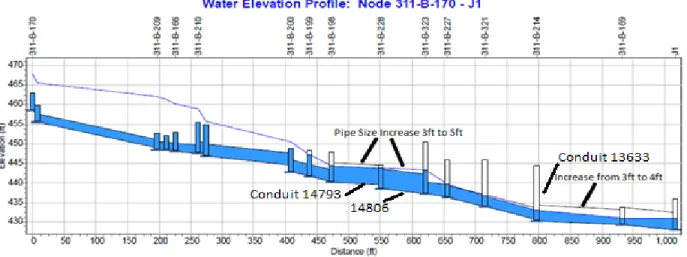
In this option three conduits were increased in size: conduits 14793, 14806 and 13633, as shown in Figure 20 below. As seen in Figure 17, the nodes above 311-B-323 are flooded and there is a significant rise in water profile in conduits 14793 and 14806 just upstream of it. So, first, an alternative of increasing the size in these pipes from 3-ft to 5-ft lowers the water elevation profile upstream but increases downstream especially at node 311-B-214 which can be seen from Figure 20. For this option pipes were designed to match inverts instead of matching soffits. Matching soffits would lead to a situation where the invert elevation at node 311-B-323 would lie below the invert elevation at node 311-B-227 creating a situation of water flowing “uphill” between these conduits, creating a sediment trap, thus reducing hydraulic capacity.
21
3.4.2 Solution Option B: Increasing Pipe Size of all the Existing Links
On increasing the pipe size of conduit 13633 which is down south road, reduces the HGL and flooding areas upstream till point of confluence as was seen in Figure 20. To solve the flooding at the point of confluence and upstream, pipes in the whole system needs to be resized. Table 1 list the proposed increase in the size of the pipes. Figure 21 shows the water elevation profile for the increased pipe sizes in the system. Pipes were designed to match soffits to avoid surcharging by backwater effect or when the downstream pipes are running full except at node 311-B-323. Inverts were matched at node 311-B-323 to avoid creation of a silt trap in the conduit upstream.
Table 1: Conduits with the proposed increase in size.
Conduit Entry Node Exit Node Existing Size(in) SizzeSize(ft)
Ft
New Size(in) Length(ft)
11398 311-B-169 311-B-209 24 42 188
11397 311-B-209 311-B-168 24 42 16
12497 311-B-168 311-B-166 24 42 14
12731 311-B-166 311-B-210 24 42 36
11573 311-B-210 311-B-201 36 54 13
12447 311-B-201 311-B-200 36 54 134
11985 311-B-200 311-B-199 36 48 29
11275 311-B-199 311-B-198 36 48 36
14806 311-B-198 311-B-228 36 60 77
14793 311-B-228 311-B-323 36 60 71
14780 311-B-323 311-B-327 36 48 34
C54 311-B-327 311-B-321 36 48 61
C55 311-B-321 311-B-214 36 48 81
22 .
Figure 21: Water Elevation profile for SCS 100 year, 24 hour storm after the proposed change in the size of all the existing pipes.
3.4.3 Solution Option: Adding New Pipes/Links to the System
23
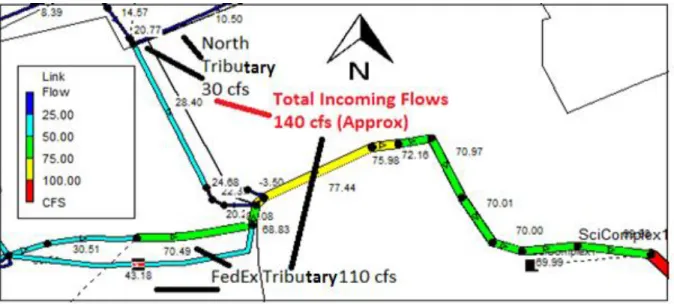
Figure 22: Total inflows to the system and existing capacity of the system for SCS 100 year, 24 hour storm event.
It can be seen from the figure above that the existing capacity of the system is half the incoming peak flows to the system. Note that the link “flows” shown in Figure 22 are estimated capacities under uniform flow, and do not represent simulation results.
3.4.3 Case A: New Proposed Pipes
24 Figure 23: Location and size of New Proposed Pipes
Figure 24: Alternate route for the New Proposed Pipes.
25
tributary outlet at node 311-B-209 to the longer pipe (3.5 ft diameter) connecting FedEx Centre tributary outlet at node 311-B-203 and discharge the water directly into the South Road open channel at node 311-B-189. Table 2 lists the characteristics of the new proposed pipes.
Table 2: Conduits with the proposed increase in size.
Conduit Entry Node Exit Node Length (ft) Diameter (ft)
Size (feet)
New Pipe 1 311-B-209 311-B-203 84.0 3.5
New Pipe 2 311-B
-203
311-B-189 565.0 3.5
Figure 25 and 26 shows water elevation profiles for the system. Pipes were designed to match soffit to avoid surcharging by backwater effect or when the downstream pipes are running full. Water elevation profiles for the existing pipe system and new proposed system shows improved flooding and surcharging situation both upstream and downstream in the system.
26
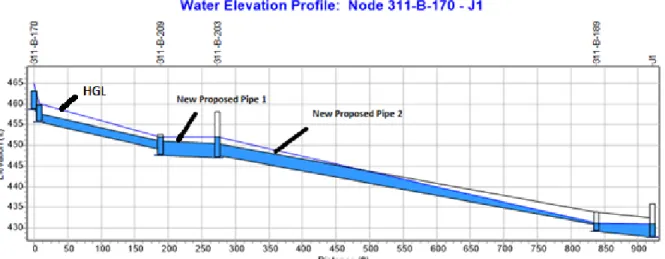
Figure 26: Water Elevation Profile for SCS 100 year, 24 hour storm for the new proposed pipes (Case A).
Figure 27 shows the peak incoming flows and improved capacity of the system for peak flows through the existing and new pipes in the system. Figures 28 shows that addition of new pipes helps improve the flooding situation in the upstream areas as well. The model predicts that this configuration can pass the 10 year storm without flooding for the upstream areas which is the desired design criterion for these areas.
27
Figure 28: Water Elevation Profile for FedEx Centre Tributary (Upstream) for SCS 10 year, 24 hour storm event after addition of new proposed pipes (Case A).
3.4.3 Case B: New Proposed Pipes
Figure 29 shows the alternate way the new pipes can be added to the system.
28
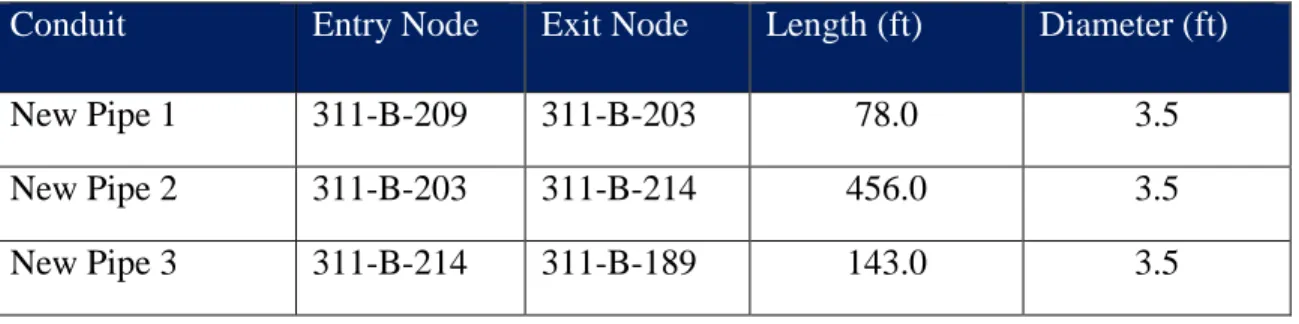
Instead of directly collecting and discharging water from the FedEx tributary into the open channel as in the previous option, here the new pipe is discharged into the outlet of Sub-catchment Science Complex 1 at node 311-B-214; a parallel pipe is added at node 311-B-214 which increases the capacity of the already existing pipes also as this new parallel pipe collects water from both new pipes and existing system. First new pipe (3.5 ft diameter) connects the Northern tributary outlet at node 311-B-209 to the inlet of longer pipe (3.5 ft diameter) at node 311-B-203. The longer proposed pipe discharges the water collected from the FedEx tributary at the outlet node for sub-catchment Science Complex 1, i.e. 311-B-214, and then another new parallel pipe (3.5 ft diameter) along the link 13633 is added down the South Road with outlet at node 311-B-189 as shown in Figure 29.
Table 3: New proposed conduits with the proposed size and length.
Conduit Entry Node Exit Node Length (ft) Diameter (ft)
Size (feet)
New Pipe 1 311-B-209 311-B-203 78.0 3.5
New Pipe 2 311-B-203 311-B-214 456.0 3.5
New Pipe 3 311-B-214 311-B-189 143.0 3.5
29
Figure 30: Schematic showing peak flows for SCS 100 year, 24 hour storm for the system after addition of new pipes (Case B).
30
Figure 32: Water Elevation Profile for SCS 100 year, 24 hour storm event for the new proposed pipes (Case B).
Figure 33 shows HGL line for upstream area, FedEx Centre tributary. The area has performance expectation for 10 year, 24hr storm event.
31
3.4.4 Solution Option: Adding Storage Unit to the System
Another alternative is to add a storage unit to the system. Addition of storage helps in collecting the water from the flooding areas and storing it in order to release at a controlled rate to reduce the peak flows during storms.
Storage Unit Size: Peak flow coming to the system is around 140 cubic feet per second and the system is sized with discharging capacity half of the incoming flows. Addition of storage unit helps to reduce the peak outflows to approximately 70 cubic feet per second.
Storage Unit Location: A strategic location for the storage unit will be the node 311-B-203 where FedEx Centre tributary joins the system. The site will also create less traffic disruption while under construction.
3.4.4 Case A: Adding New Storage Unit
32
Figure 34: Location of New Proposed Storage Unit (SU1)
The storage unit is shaped as shown in Figure 35. The storage unit is designed with maximum capacity of 105,000 cubic feet. SWMM models the orifice using the classical orifice equation to compute flow when the orifice is fully submerged.
𝑄 = 𝐶𝐴√2𝑔ℎ
A modified weir equation is used when the orifice is not flowing full, but crest is submerged by fraction f.
𝑄 = 𝐶𝐴√2𝑔𝐷𝑓1.5
33
Figure 35: Shape of new storage unit (SU1) at node 311-B-203
Figure 36: Schematic showing flow through the orifice, discharge outlet for the storage unit (SU1), for SCS 100 year, 24 hour design storm.
34
Figure 38: Schematic showing flow through two inlets and outlet (orifice) to the storage unit (SU1) for SCS 100 year, 24 hour design storm.
Figure 37 shows the flows through the inlets to the storage unit. Figure 38 shows the flows through the inlets and outlet to the storage unit SU1. Addition of the storage unit to the system solves the problem of flooding downstream areas as the huge amount of storm water coming from the FedEx tributary is stored and later released at a controlled rate. Figure 39 shows how the volume of the storage unit changes with time. Peak flows through the system can be seen in Figure 40.
35
Figure 40: Schematic showing peak flows for SCS 100 year, 24 hour storm for the system after addition of storage unit (SU1).
Figure 41 shows the water elevation profile for the system during the peak of the 100 year, 24hr design storm. It can be seen that flooding situation is improved in the area but pipes are still surcharged. Figure 42 shows further improved situation for the system when the option was run for the system for 10 year, 24hr storm event. Figure 43 showing the water elevation profile for the upstream area of FedEx tributary for 24hr, 10 year storm event.
36
Figure 42: Water Elevation for the system for SCS 10 year, 24 hour design storm after addition of the new proposed storage unit (SU1).
37 3.4.4 Case B: Adding New Storage Unit and Pipes
Another alternative that was evaluated was addition of a storage unit and new pipes in the system. The location of the storage unit and new proposed pipes is shown in Figure 44.
Figure 44: Location of the New Proposed Storage Unit (SU2) and Pipes
38
Figure 44 connecting nodes 311-B-214 and 311-B-189. Peak flows through the system can be seen in Figure 46.
Figure 45: Discharge rate through the orifice, outlet for the storage unit (SU2), for SCS 100 year, 24 hour design storm.
Figure 46: Schematic showing peak flows for SCS 100 year, 24 hour storm for the system after addition of storage unit (SU2) and new pipes.
39
upstream areas. The upstream area covered by the FedEx tributary satisfies the required UNC design criterion of no flooding for the 10yr, 24hr storm event.
Figure 47: Water Elevation for the system for SCS 100 year, 24 hour design storm after adding new storage unit (SU2) and new pipes.
40
Figure 49: Water Elevation for the FedEx tributary (upstream area) after adding new storage unit (SU2) and pipes for SCS 10 year, 24 hour storm event.
41
Figure 50: Areas surrounding FedEx Centre and existing drainage route for the upstream water (6).
3.5 Comparison of Solutions
3.5.1 Comparison Criteria
The solution options developed above were compared according to five major criteria. These criteria include:
I. Effectiveness of protection against flooding at the site
42
II. Effectiveness of preventing flooding in upstream area
The second criterion is a measure of the impact of the solution on the upstream flooding. An option which is most effective at preventing the flooding in the upstream areas is ranked high, an option which only prevents some flooding in the upstream areas is ranked medium, and an option which has little impact on upstream areas is ranked low.
III. Low capital cost and ease of implementation,
High ranking for this criterion means the project is a low cost project and can be implemented by UNC Energy Services Department (ESD) staff, options which falls under a University bidding process are ranked medium and if the project cost exceed $500,000 it is considered a University capital project and is ranked low for this criterion.
IV. Ease of operation and maintenance,
The amount of maintenance, training and operational procedures required for the solution is described by the ease of operation and maintenance criterion. The option which requires little maintenance and no training or additional operational work is ranked high, whereas the option which requires some maintenance and some training or additional operational work is ranked medium and the option which requires most maintenance and training or additional operational work is ranked low.
V. Disruption during construction and maintenance.
43 3.5.2 Comparison of the Solutions
Each solution was rated high, medium or low according to the criteria described above as can be seen in Table 4. The options have also been listed in the table such that they are ranked from best overall performance to worst.
All the options except re-sizing of strategic pipes are considered of high effectiveness because they all improve both the flooding and pipe surcharging in the system. Addition of pipes improves the situation by removing water away from the site as quickly as possible whereas storage units collect the incoming water and releases it later at controlled rate. The option of re-sizing strategic pipes improves flooding at some nodes and is therefore considered of only medium effectiveness.
44
Table 4: Criteria for comparison of solution options at the Science Complex site
Solution Options
Effectivenes s (at the site)
Effectiveness (upstream areas) Low Capital Cost & implementation ease Ease of operation & maintenance Minimal Disruption Addition of New Parallel Pipes
High High Low High Low
Combination of Storage Unit & Pipes
High Medium Low High Low
Storage Unit Addition
High Low Low High Medium
Resizing of all Pipes
High Medium Low High Low
Resizing of Strategic Pipes
Medium Medium Medium High Low
Do Nothing Low Low High High High
45
Table 5: Implementation cost for different solution options developed. Solution Options Project Cost ($)
Addition of New Parallel Pipes $ 510, 000
Combination of Storage Unit & Pipes
$ 2,700,000
Storage Unit Addition $ 3,600,000
Resizing of all Pipes $ 650,000 Resizing of Strategic Pipes $ 290,000
Do Nothing None
The ease of operation and maintenance is high for all options because after adding a few new inlets or storage unit it will only require regular cleaning out. Finally the minimal disruption criterion is considered low for options that will disrupt local vehicle traffic down the South Road during construction except the option of the addition of storage units only, as this option will involve construction on the site near the Kenan parking lot and will not disrupt traffic that much.
46
damage from the recurring flooding. This option is considered low cost as no money is being spent at the site for this option implementation.
47
4.0 IMPLEMENTATION PLAN & COST ANALYSIS
4.1 Introduction
This section identifies an implementation plan for the recommended solution and how the task of adding new parallel pipes to the site can be most effectively executed. The implementation plan includes information regarding administrative procedure and approval process, scheduling, construction, resource requirements, long-term operation and maintenance, disruptions, and cost-benefit analysis. A detailed sheet for the cost of project implementation is included in the report. Total construction cost of the project is estimated to be about $391,000, whereas overall capital cost including additional design and construction management is estimated to be about $510,000. The project will fall under the category of a “capital project” and will need both internal and external approval from UNC Board of Governors and NCGA. The project will require a formal bidding process. Finally, taking into account all the available cost information, and a damage estimate for the 10 year storm, a very approximate cost benefit analysis is presented for the project.
4.2 Implementation Plan
4.2.1 Administrative Procedure and Approval
This is not a small project which can be managed in-house by the Energy Services Department.
Funding plans for all new University Capital Improvement Projects (which are defined as the projects with estimated total costs in excess of $300,000) must be reviewed by the UNC
48
49
Figure 51 shows the internal approval process for the project where different abbreviations used are: FP (Facilities Planning), FWG (Facilities Working Group), FPC
(Facilities Planning Committee), BOG (Board of Governors), CAROLINA (UNC at Chapel Hill) and SCO (State Construction Office).
UNC Facilities Service Department provides design, construction and project management services to assist university customers with accomplishing informal construction, renovations, repairs and maintenance projects. The project will first be reviewed by the Facilities Services Department, assisted by other university departments such as ESD and the Public Safety Department. ESD will review the storm water design aspects of the project and other areas in their remit, such as space conflicts with other utilities including gas, water, sewer and electricity. The Public Safety Department will review temporary disruption to UNC pedestrian and vehicular traffic and their mitigation, such as the need for detour signs to reroute pedestrian and vehicular traffic during implementation.
50
51
This requires formal advertisement either in a local newspaper or by electronic means and a selection committee will review detailed proposals submitted by qualified firms, whose responses would be assessed based on their technical nature and bid price. After evaluating all the options, the bid will be awarded based on board of governor’s approval. The firm that wins the bid will be responsible for, other than the additional design work, the production of construction documents and the carrying out of construction management.
Different abbreviations used in Figure 52 are: FP (Facilities Planning), FWG (Facilities Working Group), FPC (Facilities Planning Committee), BOG (Board of Governors), CAROLINA (UNC at Chapel Hill), OP (Office of the President), NCGA (North Carolina General Assembly), OSBM (State Budget Office) SCO (State Construction Office), S/L (Self Liquidating), SPO (State Property Office) and VC (Vice Chancellor).
4.2.2 Scheduling
52 4.2.3 Public Disruption
For this project both vehicular and pedestrian traffic will be disrupted along South Road. Access to the Murray/Venable loading dock will also be limited, during project implementation. Pedestrian and vehicular detour plans will need to be implemented by the contractor, consisting mainly of detour signs and possibly orange safety fencing. It will be the responsibility of the UNC Department of Public Safety (DPS) to notify all parties affected by the placement of the staging area. Public disruption would be reduced if the project will be implemented over the summer break, when South Road and the parking lot at the site will experience minimal traffic.
4.2.4 Resource Requirements
53 4.2.5 Operation & Maintenance
The routine long term operation and maintenance for this project can be conducted by the university maintenance zone crews by checking whether the junction inlets are working properly, especially after large storm events. Long-term operation and maintenance costs associated with the project are not considered in this technical report as the project will not need any significant increase in maintenance work above that for which the staff is already responsible.
4.2.6 Implementation Concerns
54
55 4.3 Cost and Cost-Benefit Analysis
4.3.1 Implementation Cost
Total cost for the project will include only capital costs. As noted above, long-term operation and maintenance costs are not considered significant. Total capital costs for design and construction are shown in Table 6 below. Unit abbreviations used in the table are: Each (EA), Linear Foot (LF), Cubic Yard (CY), and Square Yard (SY). Total construction cost is estimated to be about $391,000, whereas overall capital cost including additional design and construction management is estimated to be about $510,000.
The construction costs include the earthwork, sediment and erosion control, materials, site management, and design work required for implementing the project. The required earthwork includes excavation for the new pipes to be added to the system, and backfill which includes filling up the already removed dirt and stones once the new pipes are added. Sediment and erosion control includes inlet protection for downstream areas and a silt fence to encompass areas such as stockpiles of excavated material, to prevent sediment from running off the construction site. The materials include new 42” RCP pipes and asphalt for repair work of the road after the pipe implementation. The unit costs of the materials include the labor costs, material cost and installation cost.
56
Table 6: Cost sheet for the implementation of the recommended solution at the Science Complex site
Science Complex New Parallel Pipes
South Road
Item Quantity Unit Unit cost ($) Total cost ($)
Earthwork
Excavation 1,985 CY 20.00 39,700 Unsuitable/Rock Excavation 135 CY 50.00 6,750 Backfill 1,850 CY 16.00 29,600
Erosion and sediment control
Construction entrance, stabilized 1 Ea. 1,500.00 1,500 Inlet protection 3 Ea. 100.00 300 Pump Around (storm) 10 Day 1,400.00 14,000
Silt Fence 340 LF 2.50 850
Materials and installation
Pipe
42" RCP (Class III) 675 LF 250.00 168,750
Roadway
Asphalt 50 Tons 135.00 6,750
Walls
Temporary Fence 340 LF 4.00 1,360
Site Management
Traffic control 1 LS 10,000.00 10,000 Utility Coordination 1 LS 10,000.00 10,000
Survey 2 Day 1,100.00 2,200
Dump Fees 135 CY 37.00 4,995
Subtotal $296,755
Mobilization and demobilization (10% of subtotal, $10,000 min) 29,676 Contingency (20% of project) 65,286
CONSTRUCTION
COST = $391,717
DESIGN (20% OF Construction Cost, $10,000 min.) = $78,350 CONSTRUCTION ADMIN/UNC PM FEE (10% OF Construction Cost, $10,000 min.) = $39,180
57 4.3.2 Cost Benefit Analysis
Finally the capital costs for the project implementation will be compared to the estimated cost of damage due to flooding at the site if the recommended solution is not implemented. It was noted that flooding at the Science Complex site during a storm in June, 2013 resulted in 4-5 feet of floodwater at the loading docks between Kenan and Murray which led to clogged drain inlets and incidents such as compactors floating off their guide rails, creating potentially hazardous conditions. The event resulted in damages of about $125, 000 which includes all affected sites i.e. Kenan Labs ($21,000), Murray Hall ($52,000) and Venable Hall ($52,500).
According to ESD storm water engineer Sally Hoyt, the June, 2013 storm event was estimated to have a return period of 10 years. Taking into account all these factors it is expected that flooding damage with estimated cost of $125,000 could recur every 10 years. The site is also prone to more frequent flooding (every two years!) and also rarer, more severe, flooding over the life of the project. But cost data for damage events from both less and more frequent storms than the 10 year storm are not available, and so will not be considered.
58
level between the lowest and highest storm event for the respective 311-B-198 and 311-B-228 node.
Table 7: Water Elevation Levels (in feet) at important nodes for different storm events.
Storm Event Node 311-B-198 Node 311-B-228
Node Ground El. (ft) (ft)
448.0 444.4
HGL Flood Level (ft) HGL Flood Level (ft)
SCS 2 Year, 24 hour 447.5 0.0 445 0.6
SCS 10 Year, 24 hour
448.5
-203
0.5 446 1.6
SCS 25 Year, 24 hour
449 1.0 446.5 2.1
SCS 50 Year, 24 hour
450 2.0 447.5 3.1
SCS 100 Year, 24 hour
451 3.0 448 3.6
Table 8: Water Elevation Levels/ HGL (in feet) at important nodes for different storm events after
implementation of the proposed solution.
Storm Event Node 311-B-198 Node 311-B-228
SCS 2 Year, 24 hour 440.7 439.0
SCS 10 Year, 24 hour 441.0
-203
439.2
SCS 25 Year, 24 hour 441.3 439.5
SCS 50 Year, 24 hour 441.8 440.0
59
The value of damages that accrue in the future is not directly comparable to capital costs paid in the present because money loses value over time, or in other words the value is discounted. In order to determine if the benefits of the recommended solution (which is the cost of flood damage at the site which would otherwise occur) would outweigh the costs of implementation. The Present Value of future benefits (money saved that otherwise goes into flood damages) was calculated using the following equation:
𝑃𝑉 =
𝐹𝑉(1+𝑑)𝑛
Where, PV is the Present Value, FV is Future Value, d stands for Discount Rate (in %) and n is the number of years from present. The life time of the new pipes is estimated to approximately 75 years and hence, the present value of the benefits was calculated for 75 years.
60
Figure 54: Sensitivity analysis for discount rate 2-5% for the present value of benefits vs number of years.
61
5.0 CONCLUSIONS
The Science Complex site experienced flooding during June 30th, 2013 storm which
62
63
APPENDIX
Section 1: SWMM Model Data Input and Status Report
************* Element Count *************
Number of rain gages ... 1
Number of sub-catchments ... 14
Number of nodes... 53
Number of links... 58
Number of pollutants ... 0
Number of land uses ... 0 Rain Gage Summary ****************
Name Data Source Type Interval
--- SCS_24h_Type_II_8.0in SCS_24h_Type_II_8.0in VOLUME 15 min.
******************** Sub-catchment Summary ********************
Name Area Width Imperv Slope Outlet Node (Acre) (Feet) (%) (%)
--- SciComplex8 2.46 101.21 70.15 0.44 311-A-169
64 ************
Node Summary ************
65
311-B-205 JUNCTION 471.92 7.34 1000.0 311-B-204 JUNCTION 478.71 3.50 1080.0 311-B-214 JUNCTION 430.37 14.10 313.0 311-B-227 JUNCTION 436.35 9.50 1000.0 311-B-231 JUNCTION 481.76 6.74 186.0 311-B-189 JUNCTION 429.23 4.59 1000.0 J1 JUNCTION 427.90 8.00 1000.0 J10 JUNCTION 493.50 6.40 1000.0 311-B-321 JUNCTION 434.00 12.00 1000.0 311-A-313 JUNCTION 468.90 7.00 500.0 Gage OUTFALL 422.00 3.00 0.0 311-C-090 STORAGE 493.50 3.00 0.0 311-C-012 STORAGE 496.00 4.00 0.0 311-B-187 STORAGE 424.98 6.02 0.0
************
Link/Conduit Summary ************
66
16152 311-B-310 311-B-179 CONDUIT 126.3 2.3838 0.0130 16151 311-B-308 311-B-310 CONDUIT 34.9 2.3777 0.0130 16150 311-A-320 311-B-308 CONDUIT 52.1 2.3994 0.0130 11770 311-A-168 311-A-320 CONDUIT 22.3 4.1731 0.0130 11550 311-A-169 311-A-168 CONDUIT 75.0 1.7742 0.0130 12444 311-B-180 311-B-179 CONDUIT 31.4 5.6511 0.0130 13112 311-A-150 311-A-149 CONDUIT 54.8 2.3907 0.0130 12670 311-A-151 311-A-150 CONDUIT 26.5 7.6065 0.0130 11573 311-B-210 311-B-201 CONDUIT 12.9 4.9734 0.0130 12001 311-B-167 311-B-201 CONDUIT 19.7 2.2335 0.0130 12447 311-B-201 311-B-200 CONDUIT 133.7 1.7049 0.0130 11985 311-B-200 311-B-199 CONDUIT 29.2 3.6331 0.0130 11275 311-B-199 311-B-198 CONDUIT 36.3 3.7485 0.0130 14806 311-B-198 311-B-228 CONDUIT 76.8 0.7398 0.0130 14793 311-B-228 311-B-323 CONDUIT 70.9 1.9767 0.0130 14780 311-B-323 311-B-227 CONDUIT 33.7 2.0187 0.0130 13633 311-B-214 311-B-189 CONDUIT 135.0 0.8431 0.0130 C56 311-A-149 311-A-313 CONDUIT 12.9 4.6680 0.0130 C5 J1 311-B-187 CONDUIT 153.4 1.9043 0.0350 C6 311-B-189 J1 CONDUIT 84.3 1.5778 0.0350 C43 311-B-136 311-B-134 CONDUIT 174.0 6.3981 0.0130 C45 311-B-205 311-B-134 CONDUIT 111.0 6.1386 0.0130 C51 311-B-134 311-B-203 CONDUIT 345.0 4.1892 0.0130 C44 J10 311-C-090 CONDUIT 10.0 0.0100 0.0130 C54 311-B-227 311-B-321 CONDUIT 60.4 3.8905 0.0130 C55 311-B-321 311-B-214 CONDUIT 81.4 4.1203 0.0130 C57 311-A-313 311-B-180 CONDUIT 27.1 4.6179 0.0130 99 311-C-066 311-C-065 CONDUIT 400.0 0.3600 0.0100 1 311-B-187 Gage CONDUIT 400.0 0.7450 0.0130 78 J10 311-C-067 ORIFICE
81 311-C-012 311-B-181 ORIFICE 79 J10 311-C-067 WEIR 80 311-C-012 311-B-181 WEIR *********************
Cross Section Summary *********************
Full Full Hyd. Max. No. of Full Conduit Shape Depth Area Rad. Width Barrels Flow (cfs) --- 13721 CIRCULAR 1.25 1.23 0.31 1.25 1 7.82
67
68
99 TRIANGULAR 0.50 5.00 0.25 20.00 1 17.68 1 CIRCULAR 3.00 7.07 0.75 3.00 1 57.57
************* Analysis Options **************** Flow Units... CFS Process Models:
Rainfall/Runoff... YES RDII... NO Snowmelt... NO Groundwater... NO Flow Routing... YES Ponding Allowed... YES Water Quality... NO
Infiltration Method... GREEN_AMPT Flow Routing Method... DYNWAVE Report Time Step ... 00:00:05 Wet Time Step ... 00:00:30 Dry Time Step ... 00:30:00 Routing Time Step... 1.30 sec Variable Time Step... YES
Analysis begun on: Mon Mar 21 02:01:55 2016 Analysis ended on: Mon Mar 21 02:02:03 2016 Total elapsed time: 00:00:08
************************** Volume Depth Runoff Quantity Continuity acre-feet inches ************************** --- --- Total Precipitation ... 24.651 8.000 Evaporation Loss ... 0.000 0.000 Infiltration Loss... 3.645 1.183 Surface Runoff... 20.710 6.721 Final Storage ... 0.300 0.097 Continuity Error (%)... -0.011
69
************************** Volume Volume Flow Routing Continuity acre-feet 10^6 gal ************************** --- --- Dry Weather Inflow ... 0.000 0.000 Wet Weather Inflow ... 20.708 6.748 Groundwater Inflow ... 0.000 0.000 RDII Inflow... 0.000 0.000 External Inflow ... 0.000 0.000 External Outflow ... 17.024 5.547 Flooding Loss ... 3.508 1.143 Evaporation Loss ... 0.000 0.000 Exfiltration Loss... 0.000 0.000 Initial Stored Volume.... 0.000 0.000 Final Stored Volume ... 0.141 0.046 Continuity Error (%).... 0.173
******************************** Highest Flow Instability Indexes
70
Section 2: Cost Estimation for Different Options
Table 9: Cost sheet for the implementation of Resizing Strategic Pipes at the Science Complex site
Stormwater Capital Improvement Plan: Unit Cost Template
Science Complex Resize Strategic Pipes
South Road
Item Quantity Unit Unit cost ($) Total cost ($)
Earthwork
Excavation 960 CY 20.00 19,200 Unsuitable/Rock Excavation 135 CY 50.00 6,750
Backfill 935 CY 16.00 14,960
Erosion and sediment control
Construction entrance, stabilized 2 Ea. 1,500.00 3,000 Inlet protection 5 Ea. 100.00 500 Pump Around (storm) 10 Day 1,400.00 14,000
Silt Fence 146 LF 2.50 365
Materials and installation
Pipe
60" RCP (Class III) 147 LF 275.00 40,425 48" RCP (Class III) 135 LF 250.00 33,750
Roadway
Asphalt 50 Tons 135.00 6,750
Walls
Temporary Fence 146 LF 4.00 584
Site Management
Traffic control 1 LS 10,000.00 10,000 Utility Coordination 1 LS 10,000.00 10,000
Survey 2 Day 1,100.00 2,200
Dump Fees 135 CY 37.00 4,995
Subtotal $167,479
Mobilization and demobilization (10% of subtotal, $10,000 min) 16,748 Contingency (20% of project) 36,845
CONSTRUCTION COST
= $221,072
DESIGN + CONTINGENCY (20% OF Construction Cost, $10,000 min.) = $44,220 CONSTRUCTION ADMIN/UNC PM FEE (10% OF Construction Cost, $10,000 min.) = $22,110
71
Table 10: Cost sheet for the implementation of Resizing All Pipes at the Science Complex site
Stormwater Capital Improvement Plan: Unit Cost Template
Science Complex Resizing All Pipes
South Road
Item Quantity Unit Unit cost ($) Total cost
($)
Earthwork
Excavation 2,170 CY 20.00 43,400 Unsuitable/Rock Excavation 165 CY 50.00 8,250 Backfill 1,980 CY 16.00 31,680
Erosion and sediment control
Construction entrance, stabilized 1 Ea. 1,500.00 1,500 Inlet protection 15 Ea. 100.00 1,500 Pump Around (storm) 10 Day 1,400.00 14,000
Silt Fence 470 LF 2.50 1,175
Materials and installation
Pipe
42" RCP (Class III) 254 LF 250.00 63,500 48' RCP (Class III) 377 LF 250.00 94,125 54" RCP (Class III) 147 LF 275.00 40,425 60" RCP (Class III) 148 LF 275.00 40,700
Roadway
Asphalt 50 Tons 135.00 6,750
Walls
Temporary Fence 470 LF 4.00 1,880
Site Management
Traffic control 1 LS 10,000.00 10,000 Utility Coordination 1 LS 10,000.00 10,000
Survey 2 Day 1,100.00 2,200
Dump Fees 135 CY 37.00 4,995
Subtotal $376,080
Mobilization and demobilization (10% of subtotal, $10,000 min) 37,608 Contingency (20% of project) 82,738
CONSTRUCTION COST
= $496,426
DESIGN + CONTINGENCY (20% OF Construction Cost, $10,000 min.) = $99,290 CONSTRUCTION ADMIN/UNC PM FEE (10% OF Construction Cost, $10,000 min.) = $49,650
72
Table 11: Cost sheet for the implementation of Addition of New Parallel Pipes at the Science Complex site
Stormwater Capital Improvement Plan: Unit Cost Template
Science Complex New Parallel Pipes
South Road
Item Quantit
y Unit Unit cost ($)
Total cost ($)
Earthwork
Excavation 1,985 CY 20.00 39,700 Unsuitable/Rock Excavation 135 CY 50.00 6,750 Backfill 1,850 CY 16.00 29,600
Erosion and sediment control
Construction entrance, stabilized 1 Ea. 1,500.00 1,500 Inlet protection 3 Ea. 100.00 300 Pump Around (storm) 10 Day 1,400.00 14,000
Silt Fence 340 LF 2.50 850
Materials and installation
Pipe
42" RCP (Class III) 675 LF 250.00 168,750
Roadway
Asphalt 50 Tons 135.00 6,750
Walls
Temporary Fence 340 LF 4.00 1,360
Site Management
Traffic control 1 LS 10,000.00 10,000 Utility Coordination 1 LS 10,000.00 10,000
Survey 2 Day 1,100.00 2,200
Dump Fees 135 CY 37.00 4,995
Subtotal $296,755
Mobilization and demobilization (10% of subtotal, $10,000 min) 29,676 Contingency (20% of project) 65,286
CONSTRUCTION COST
= $391,717
DESIGN + CONTINGENCY (20% OF Construction Cost, $10,000 min.) = $78,350 CONSTRUCTION ADMIN/UNC PM FEE (10% OF Construction Cost, $10,000 min.) = $39,180
73
Table 12: Cost sheet for the implementation of Storage Unit (SU1) Addition at the Science Complex site
Stormwater Capital Improvement Plan: Unit Cost Template
Science Complex Storage Unit Addition
South Road
Item Quantity Unit Unit cost ($) Total cost ($)
Earthwork
Excavation 4,075 CY 20.00 81,500 Unsuitable/Rock Excavation 15 CY 50.00 750
Backfill 150 CY 16.00 2,400
Erosion and sediment control
Construction entrance, stabilized 1 Ea. 1,500.00 1,500 Inlet protection 3 Ea. 100.00 300 Pump Around (storm) 10 Day 1,400.00 14,000
Silt Fence 65 LF 2.50 163
Materials and installation
Storage Unit
SU1 785,455 Ga 2.50 1,963,638
Pipe
36" RCP (Class III) 58 LF 250.00 14,500
Walls
Temporary Fence 65 LF 4.00 260
Site Management
Traffic control 1 LS 10,000.00 10,000 Utility Coordination 1 LS 10,000.00 10,000
Survey 2 Day 1,100.00 2,200
Dump Fees 135 CY 37.00 4,995
Subtotal $2,106,205
Mobilization and demobilization (10% of subtotal, $10,000 min) 210,621 Contingency (20% of project) 463,365
CONSTRUCTION
COST = $2,780,191
DESIGN + CONTINGENCY (20% OF Construction Cost, $10,000 min.) = $556,040 CONSTRUCTION ADMIN/UNC PM FEE (10% OF Construction Cost, $10,000 min.) = $278,020
74
Table 13: Cost sheet for the implementation of addition of Storage Unit (SU2) and New pipes at the Science Complex site
Stormwater Capital Improvement Plan: Unit Cost Template
Science Complex Combination of Storage Unit & New Pipes
South Road
Item Quantity Unit Unit cost ($) Total cost ($)
Earthwork
Excavation 3,350 CY 20.00 67,000 Unsuitable/Rock Excavation 75 CY 50.00 3,750
Backfill 300 CY 16.00 4,800
Erosion and sediment control
Construction entrance, stabilized 1 Ea. 1,500.00 1,500 Inlet protection 3 Ea. 100.00 300 Pump Around (storm) 10 Day 1,400.00 14,000
Silt Fence 203 LF 2.50 508
Materials and installation
Storage Unit
SU1 561,040 Ga 2.50 1,402,600
Pipe
36" RCP (Class III) 137 LF 250.00 34,250 36" RCP (Class III) 56 LF 250.00 14,000
Roadway
Asphalt 50 Ton 135.00 6,750
Walls
Temporary Fence 203 LF 4.00 812
Site Management
Traffic control 1 LS 10,000.00 10,000 Utility Coordination 1 LS 10,000.00 10,000
Survey 2 Day 1,100.00 2,200
Dump Fees 135 CY 37.00 4,995
Subtotal $1,577,465
Mobilization and demobilization (10% of subtotal, $10,000 min) 157,746 Contingency (20% of project) 347,042
CONSTRUCTION
COST = $2,082,253
DESIGN + CONTINGENCY (20% OF Construction Cost, $10,000 min.) = $416,460 CONSTRUCTION ADMIN/UNC PM FEE (10% OF Construction Cost, $10,000 min.) = $208,230