Analysis of Duke’s Healthy Lifestyles Program: A Reimbursable, Sustainable Monthly Intervention
For Overweight and Obese Children
By Elizabeth Reese
A Master‟s Paper submitted to the faculty of the University of North Carolina at Chapel Hill
in partial fulfillment of the requirements for the degree of Master of Public Health in
the Public Health Leadership Program.
Chapel Hill 2008
________________________________ Advisor
________________________________ Second Reader
________________________________ Third Reader
Abstract:
Objective: Our aim is to determine if a moderate-intensity, family-based childhood obesity
intervention which is reimbursable by third party payers can achieve significant obesity and co-morbidity reduction. Patients and Methods: Retrospective chart analysis of 190 children (birth-21) enrolled in Duke‟s Healthy Lifestyles Program (HLP) to assess significant changes in weight, co-morbidities, mood, and lifestyle behavior from enrollment to program completion, and to assess for an intervention dose-related effect. Results: No significant baseline differences exist among groups. The 51 children who completed the program showed a statistically
significant and clinically important improvement in BMI, BMI z-score, BMI percentile, body fat percentage, fasting insulin, fasting glucose, total cholesterol, hypertension, validated mood scores, and self-reported lifestyle behaviors. Alanine transaminase (ALT) decreases but does not reach statistical significance (p = 0.07). At enrollment, 54% of children were categorized with either stage 1 or 2 blood pressure readings and at completion only 30% continued to have stage 1 or 2 hypertension. The average time to complete the program was 280 days, or approximately 7.8 months. Conclusion: A moderate intensity, multi-disciplinary intervention that is
Introduction:
Childhood obesity has become one of the greatest health challenges facing children today.1 The incidence of children becoming overweight or obese in the United States has more than doubled in the last 25 years with levels reaching 13.9% in children 2-5 years old, 18.8% in children 6-11, and 17.4% in children 12-19,2 with this increase most pronounced among
developed nations and in urban populations.3 Childhood obesity poses a serious health threat for chronic disease. Type II diabetes mellitus (T2DM) is one of the most serious and common co-morbidities of obesity. Its prevalence has been rising4 along with other obesity related co-morbidities including hypertension and hyperlipidemia.5 If this trend continues, by 2035 up to 16% of 35 year old adults are predicted to have coronary heart disease due to these obesity related co-morbidities.6
Many treatments are being studied including bariatric surgery for extreme cases; however behavior modifications focused on diet and exercise remain at the core of obesity care.1 Treating obesity has remained very frustrating, time consuming, and expensive.7 Research has shown that children are more successful at losing and maintaining weight loss than adults, highlighting the importance of interventional behavior modification while the patient is young.8 The inclusion of the family in behavioral modification programs is a critical factor for success and maintenance of achievement. The important influence parents‟ exercise and food choice habits have on their children is also being studied with the genetic link in obesity being further complicated by the parent‟s own eating habits and child-feeding practices.9, 10
weight loss in children are resource intensive and expensive to implement.13, 14 Programs such as these may not help the economically disadvantaged families whose children are at high risk for chronic illness.
Our aim is to determine if a moderate-intensity, family-based childhood obesity
intervention which is reimbursable by third party payers and designed as a sustainable approach to the comprehensive outpatient management of obese children can achieve significant obesity and co-morbidity reduction. The hypothesis of this study is that overweight children who complete a 6-visit comprehensive, multidisciplinary weight loss program will have a significant improvement from baseline and a greater reduction in body mass index (BMI) and related co-morbidities than children who fail to complete the program.
Methods:
Intervention:
The Healthy Lifestyles Program (HLP) is a comprehensive, multidisciplinary approach to the treatment of childhood obesity with three primary care pediatricians, three pediatric
endocrinologists, one dietician with certification in pediatric weight management, and one clinical social worker. Individuals are eligible for the HLP if they are < 22-years-old with a (1) body mass index (BMI) ≥ the 85th percentile or (2) have crossed two BMI percentile lines on the Centers for Disease Control and Prevention (CDC) standard growth curve, or (3) are ≥ 2-years-old and have a weight for their height ≥ the 95th percentile. Participation is divided into three stages: a screening visit, an intensive phase, and a maintenance phase.
Screening Visit: Before the initial visit, patients receive a standardized series of fasting
on Childhood Obesity (required: lipid panel, insulin, glucose, alanine transaminase (ALT) and aspartate transaminase (AST); optional: hemoglobin A1c (HbA1c) which are ordered by the referring physician. During the screening visit, the patients‟ history is reviewed and
anthropomorphic measurements are taken (including height, weight, BMI, and percent body fat).
Intensive Phase: The intensive phase constitutes the next five monthly visits. Each of these visits is with one of the HLP primary care pediatricians and dietician. During this visit, progress is reviewed, previous goals are refined, and new goals are set. All clinicians use motivational interviewing techniques to set family-centered evidence-based goals. During each visit a “fit kit” and written materials are given to the patient and family. The program follows five basic
principles including: portion control15, 16, limiting juices and soft drinks15, 16, less than two hours per day on the television15, 16, good sleep15, 16, and sixty minutes of activity per day15-17.
Maintenance Phase: These visits are similar to the intensive phase, but occur only every six months until the patient ages out of the program.
currently operates at a deficit of approximately $15,000.00 per year. This cost, relatively low for most hospital operating budgets, justifies the use of the term “sustainable.”
Outcomes
The main outcome variable is change in BMI. Secondary outcomes are the follow up
measurements for height, weight, BMI, BMI percentile, blood pressure, body fat percentage, PALS, MFQ, fasting insulin, glucose, and lipid panel, ALT and AST. Blood pressure categorization is assessed using the blood pressure tables from the National Heart Lung and Blood Institute blood pressure tables according to height, sex, and age. Body fat is measured using the Bioimpedence device Tanita brand 2006 model. The values for patients with ≥ 6 visits are taken at the sixth visit to maintain consistency at completion of the intensive phase.
Independent Variables
The main independent variable is the number of follow up visits. The 190 children enrolled in the program are grouped by level of follow up. The groups are divided into children who have completed the program with ≥ 6 visits (n=51), 4-5 visits (n=32), 2-3 visits (n=58), and 1 visit (n=49). Other independent variables include: age, gender, and the baseline values for height, weight, BMI, BMI z-score, BMI percentile, blood pressure, body fat percentile, PALS, MFQ, fasting insulin, glucose, lipid panel, ALT and AST.
Statistical Analysis:
STATA/IC 10.0 is used for statistical analysis. One-way ANOVA examines the baseline
if there is a statistical significance among the four groups by level of follow up including 1 visit, 2-3 visits, 4-5 visits, and ≥ 6 visits. One-way ANOVA is performed for age, weight, height, BMI, BMI z-score, BMI percentile, body fat percentage, and PALS score. For categorical outcomes including blood pressure and gender, a Pearson‟s chi-square analysis is run.
A linear regression model is performed to analyze the outcomes for post-BMI z-score and body fat percentage by follow up visits. The linearity of the independent variables to the
outcomes are checked leaving the main independent variable of number of visits, as well as pre-BMI z-score, and pre-blood pressure category remaining in the model for pre-BMI z-score. In the post-body fat percentage model, the main variable number of visits as well as pre-body fat percentage, pre-blood pressure category, age and gender remain in the model. T-tests are performed to see if there is a significant difference between groups. Ordinal logistic regression is run for blood pressure outcomes with the independent variables of number of visits, pre-blood pressure category, pre-body fat percentage, and pre-BMI z-score in the model. The proportional odds assumption for the model is tested using the omodel command in STATA and is found to have a non-significant p-value.
Results:
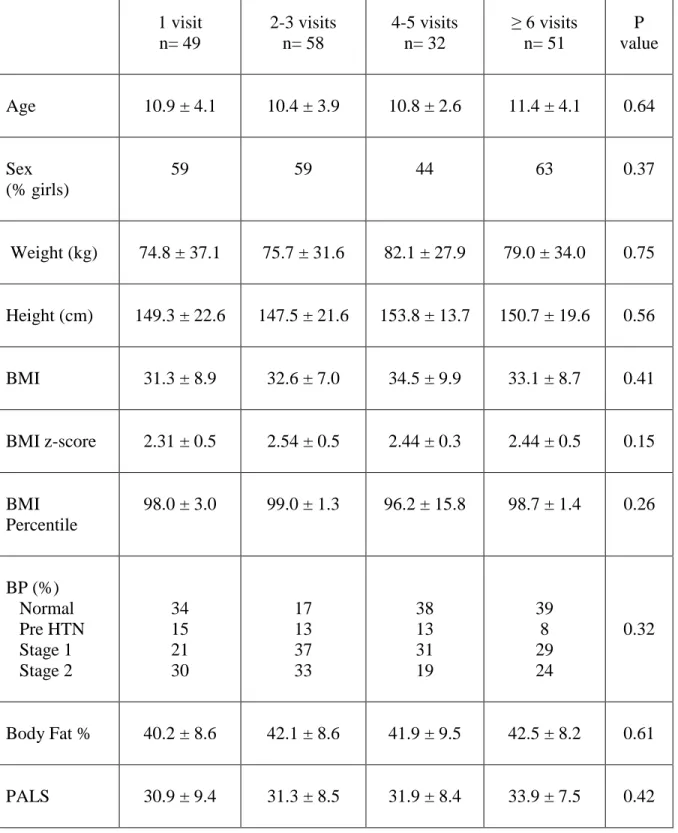
The characteristics of the children at the time of enrollment grouped by the number of follow up visits are shown in Table 1. At baseline, there is no statistically significant difference among the groups for any of the measures including age, gender, BMI z-score, blood pressure diagnoses, body fat percentage, or PALS score. Children who had 1 visit in the program were lost to follow up and therefore 49 children could not be included in the subsequent analyses.
Children with follow up data were able to be compared to examine a potential dose response relationship to the number of visits in the program. The dose response relationship for BMI z-score, body fat percentage, and blood pressure is shown in Table 2. The children with 2-3 visits had a mean post BMI z-score of 2.47, SE 0.03. Similarly, children with 4-5 visits had a mean post BMI z-score of 2.46, SE 0.04. Finally the children who completed the program with ≥6 visits had a mean BMI z-score of 2.29, SE 0.03. Similar analysis was performed for post body fat percentage. The children in the 2-3 visit group with post body fat percentage readings had a mean of 41.7, SE 0.6., Children in the 4-5 visit group had a mean post body fat percentage of 41.5, SE 0.81. Finally the children who had completed the program with ≥ 6 visits had a mean post-body fat percentage of 39.7, SE 0.62.
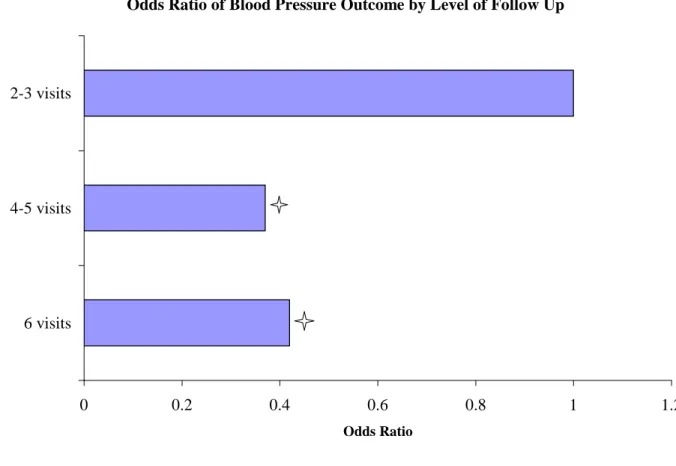
Stage 2, Stage 1, and Pre-Hypertension versus normal blood pressure compared to children who had only 2-3 visits with a 95% CI[0.19, 0.89] and a p value of 0.024. It is therefore also true that these children are 0.42 times as likely to have Stage 2 versus the other blood pressure categories compared to 2-3 visits, as well as Stage 2 and Stage 1 hypertension versus pre-hypertension and normal blood pressure compared to children with 2-3 visits with the same 95% CI and p value.
For both of these above models, only children with ≥ 6 visits were significantly different for both post-BMI z-score and post body fat percentage from children with 2-3 visits and
children with 4-5 visits. Neither children with 2-3 visits nor 4-5 visits were significantly
different from each other. For blood pressure there is a different pattern. Both 4-5 visits and ≥ 6 visits are similarly protective in improving blood pressure while children with 2-3 visits are significantly different for this outcome.
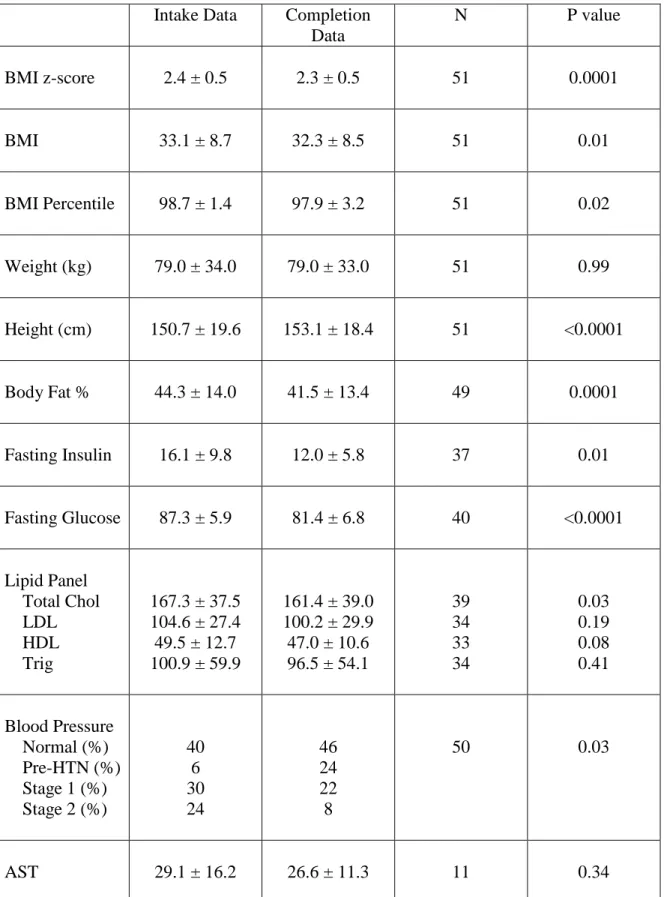
completion of the program, only 30% of the children continued to have stage 1 or stage 2 hypertension with a decrease in stage 2 hypertension going from 24 to 8%. The p value for the difference is 0.028. The average time to complete the program was 280 days, or approximately 7.8 months.
Discussion:
Upon completion of the HLP, there is no significant change in weight. However, there is a significant decrease in BMI as well as many clinically important and health associated co-morbidities including blood pressure, fasting insulin, glucose, and total cholesterol. There is also a decrease in ALT that did not quite reach statistical significance (p=0.07). Lifestyle behavioral changes were measured with the PALS tool and showed a significant improvement among children who completed the program. This correlates with a decrease in television watching, an increase in physical activity, and an improvement in diet. The statistically significant
improvement in MFQ score indicates a decrease in psychosocial stress among children.
As a sub-analysis, a potential dose response across the groups by follow up visit exists for both post BMI z-score and post body fat percentage as both 2-3 visit and 4-5 visit groups had nearly identical numbers while children who completed the program had lower values. This was only statistically significant for post BMI z-score, but reached near significance for post body fat percentage. The model was not adjusted for time therefore those with 4-5 visits would be
the children in the ≥ 6 visits category and both these groups have statistically significant lower blood pressures than children in the 2-3 visit group. BMI z-score is used as BMI z-score best measures fat reduction in an obese pediatric population with a wide age range.18
There are many programs at medical centers across the nation that have childhood weight loss interventions. One of the innovative ways which makes Duke‟s HLP different is its coverage by third party payers. Few programs have published the results of their program. One that has is the Bright Bodies program at Yale which has shown success in a multidisciplinary intervention program.13 At the end of this 12 month RCT, the intervention group showed very minimal mean weight gain of 0.3 kg and a 3.7 % reduction in body fat; similar to the significant 2.8% decrease in body fat after completion in the HLP. There is a significant decrease in BMI by 0.9 after approximately 7.8 months in the HLP, while the Bright Bodies had a decrease in BMI of 1.7. Another RCT randomized children into an initial weight loss program that was 5 months long, involved weekly meetings, and required parent attendance at each session showed a statistically significant decrease in BMI z-score of 0.22, with a p-value <0.001.14 This is similar to the change in BMI z-score at completion of Duke‟s HLP with a significant decrease in BMI z-score of 0.18.
BMI is expected to increase naturally with age and is not only slightly higher in girls but also particularly higher in African American and Hispanic girls than for Caucasian girls.19 Fifty-seven percent of all the children enrolled in the HLP are girls, many African Americans, and 63% of the children who completed the program and reduced their BMI were girls. A decrease in BMI when a natural increase is expected with age over a 7.8 month period of time is a
Some studies have addressed whether involvement in childhood weight reduction programs can cause psychological harm. A systematic review showed inconclusive results.21 A ten year follow up of children involved in weight loss interventions reports higher levels of psychiatric disorders; however, it is not clear that the relationship is causal. The
Patient-centered Assessment and Counseling for Exercise plus Nutrition (PACE+) study found that self-esteem and body image did not worsen for children regardless of their weight, and girls with weight reduction or maintenance at 6 and 12 months had significant improvements in body image satisfaction compared to girls with weight gain.22 After a 4 week weight loss camp, the obese children reduced their BMI and significantly increased self esteem scores and decreased body scale dissatisfaction scores 23 The results of these studies are inconclusive particularly in the long term, but the last two studies indicate that if the intervention is efficacious it may lead to psychological improvements as well. This is in accordance with the results that were obtained in this study as the HLP showed an improvement in the MFQ at completion, specifically designed to test for depression in children.24
The largest limitation of the study is that the comparison group consists of individuals who chose to enroll in the program then failed to complete it. It has been shown that parents often believe the BMI of their overweight or obese child is in a normal range.25 These parents may not enroll their child in a program to lose weight. Those who do believe it may therefore be a different population illuminating the largest limitation of the study. Also of note, while there is a statistically significant decrease for fasting insulin and blood pressure categories,
approximately 1/3 of all patients who are enrolled in the HLP are put on metformin at some time during the program and abut 1/10 of patients are put an anti-hypertensive. There is no standard guideline as to when a child is put on metformin in the program; it is a clinically based decision based on numerous factors.
Targeting economically disadvantaged children through a weight loss program that is reimbursable has significant public health implications. These children are at higher risk of being overweight or obese26 and due to the cost and time-intensive nature of the
Table 1. Intake Data of Patients by Level of Follow Up 1 visit n= 49 2-3 visits n= 58 4-5 visits n= 32
≥ 6 visits n= 51
P value
Age 10.9 ± 4.1 10.4 ± 3.9 10.8 ± 2.6 11.4 ± 4.1 0.64
Sex (% girls)
59 59 44 63 0.37
Weight (kg) 74.8 ± 37.1 75.7 ± 31.6 82.1 ± 27.9 79.0 ± 34.0 0.75
Height (cm) 149.3 ± 22.6 147.5 ± 21.6 153.8 ± 13.7 150.7 ± 19.6 0.56
BMI 31.3 ± 8.9 32.6 ± 7.0 34.5 ± 9.9 33.1 ± 8.7 0.41
BMI z-score 2.31 ± 0.5 2.54 ± 0.5 2.44 ± 0.3 2.44 ± 0.5 0.15
BMI Percentile
98.0 ± 3.0 99.0 ± 1.3 96.2 ± 15.8 98.7 ± 1.4 0.26
BP (%) Normal Pre HTN Stage 1 Stage 2 34 15 21 30 17 13 37 33 38 13 31 19 39 8 29 24 0.32
Body Fat % 40.2 ± 8.6 42.1 ± 8.6 41.9 ± 9.5 42.5 ± 8.2 0.61
PALS 30.9 ± 9.4 31.3 ± 8.5 31.9 ± 8.4 33.9 ± 7.5 0.42
Table 2: Linear regression of outcomes by level of visit
Post BMI z-score Post BMI z-score N value
Post Body Fat % Post Body Fat % N value
2-3 visits 2.47 n=54 41.7 n=46
4-5 visits 2.46 n=32 41.5 n=29
≥ 6 visits 2.29* n=51 39.7* n=49
Linear regression for post BMI z-score was adjusted for pre-BMI z-score as well as pre-blood pressure category. The linear regression model for post body fat percentage was adjusted for age, gender, pre-body fat percentage, and pre-blood pressure category.
*Indicates statistical significance p<0.05
Figure 1: Ordinal Logistic Regression showing Adjusted* Odds Ratios of Post Blood Pressure Outcomes Using Normal Blood Pressure and 2-3 visits as the Reference points.
Odds Ratio of Blood Pressure Outcome by Level of Follow Up
0 0.2 0.4 0.6 0.8 1 1.2
6 visits 4-5 visits 2-3 visits
Odds Ratio
Indicates Statistical significance p<0.05 from 2-3 visits.
Table 3: Data at the Completion of Duke’s Healthy Lifestyle Program
Intake Data Completion Data
N P value
BMI z-score 2.4 ± 0.5 2.3 ± 0.5 51 0.0001
BMI 33.1 ± 8.7 32.3 ± 8.5 51 0.01
BMI Percentile 98.7 ± 1.4 97.9 ± 3.2 51 0.02
Weight (kg) 79.0 ± 34.0 79.0 ± 33.0 51 0.99
Height (cm) 150.7 ± 19.6 153.1 ± 18.4 51 <0.0001
Body Fat % 44.3 ± 14.0 41.5 ± 13.4 49 0.0001
Fasting Insulin 16.1 ± 9.8 12.0 ± 5.8 37 0.01
Fasting Glucose 87.3 ± 5.9 81.4 ± 6.8 40 <0.0001
Lipid Panel Total Chol LDL HDL Trig
167.3 ± 37.5 104.6 ± 27.4 49.5 ± 12.7 100.9 ± 59.9
161.4 ± 39.0 100.2 ± 29.9 47.0 ± 10.6 96.5 ± 54.1
39 34 33 34 0.03 0.19 0.08 0.41 Blood Pressure Normal (%) Pre-HTN (%) Stage 1 (%) Stage 2 (%)
40 6 30 24 46 24 22 8
50 0.03
ALT 36.0 ± 29.8 30.9 ± 26.8 37 0.07
MFQ 7.4 ± 7.9 4.5 ± 7.9 23 0.01
PALS 35. ± 10.8 28.1 ± 11.2 35 <0.0001
Table 3: BMI = Body Mass Index, Body Fat % = Percent Body Fat, Total Chol = Total Cholesterol, LDL = Low Density Lipoprotein, HDL = High Density Lipoprotein, Trig =
Masters Paper Addendum to Introduction:
In the United States, approximately 14% of children were overweight or obese in 1999-2000 and this increased to 17% by 2003-2004.27 One of the reasons for this increase in obesity is that children have become less physically active, with only half of people aged 12-21 reporting participating in vigorous physical activity and 25% of them reporting no physical activity. Fasting hyperglycemia, hypertension, central obesity, and dyslipidemia together make up the metabolic syndrome which is on the rise in obese children and is predicted to lead to poor health outcomes28 with a related increase for cardiovascular disease continuing into adulthood.29 Other conditions such as non-alcoholic fatty liver disease30, joint problems31, sleep apnea32, asthma33 and psychosocial issues34 are also observed at higher levels among overweight and obese children. Due to these many health complications many studies have been done in order to decrease the rise of pediatric obesity.
There have been many different ways to try to decrease the prevalence of childhood obesity. These interventions were found through the use of a systematic literature review and are discussed in more detail below with a quality rating chart described in the methods addendum below shown on Table 4, pg 35. Many interventions have been attempted to try to reinforce lifestyle change including offering more nutritious options for children in school and attempting to increase the level of physical activity through physical education classes in schools. Lifestyle intervention is in fact currently the core of the majority of obesity care. Both intake from food and output from exercise together make up the energy balance. It therefore seems obvious that the most successful interventions to prevent pediatric obesity and its related co-morbidities will likely target both good nutrition as well as increased physical activity. Focusing on one
component only without attention to the other will likely fail, particularly in the long term, as is evident from a number of studies addressing only one part of the energy balance.36-45 This focus on multi-disciplinary lifestyle inventions rather than on one part of the energy balance is also in line with research in preventing adult T2DM, where multi-disciplinary interventions like the Diabetes Prevention Program46 have shown the most potential for success. Counseling can be used as an additional method to any of these interventions listed above to help reinforce lifestyle change.
Nutritional Lifestyle Interventions:
Many interventional programs have studied whether improving the nutrition of children‟s food intake will be feasible and effective in causing weight loss. A middle school program showed over a six-week period that all but one of six schools were able to successfully
by both students and staff and could likely be successful as a long term change.36 Another program sought to only change one aspect involved in weight gain: soft drink consumption. This study did show a modest reduction in the number of children who were overweight and obese in six primary schools with a reduction in consumption of carbonated beverages.37 The CHOPPS (Christchurch obesity prevention programme in schools) done by the same group incorporated education, promotion of a healthy diet, and reduction of carbonated beverage consumption over four sessions in one year. This study showed a modest decrease in overall weight after one year but this decrease was lost at three years follow up.38 A different type of study incorporated the importance of family influence over childhood behavior. This study was a comprehensive behavioral weight loss program for all but also separated families into two groups, one which was encouraged to increase their consumption of fruits and vegetables and the other with was encouraged to decrease the intake of high fat and high sugar foods. They showed that the group that was encouraged to eat more fruits and vegetables actually had more weight loss than a group focused on decreasing the amount of unhealthy food consumed.39 Intervening with poor
childhood food habits and encouraging healthy eating particularly through family reinforcement does appear to have some modest benefits in decreasing the overall incidence and prevalence of children who are overweight and obese.
loss of weight.47 There is some disagreement however and there is some belief that the dangers due to the high amounts of co-morbidities that exist with the increasing prevalence of obesity are less of a risk if the child loses weight on the diet than if the child continues to be overweight and risks the associated co-morbidities.48
The issue of putting children on a diet is quite complicated. Not only must the safety of the diet be considered but also as seen the risks that the child will incur if they are not on a diet. Whether they will be receiving proper nutrition for growth and development is very dependent on each household and makes the problem even more challenging. Children will generally be fed what their parents are eating therefore if behavior modification strategies can be targeted toward better eating habits for the parents, the children will hopefully benefit from better diets as well. Making the nutrition intervention a change that incorporates healthier eating such as more fruits and vegetables is likely to be a better nutrition intervention for childhood obesity than a nutrition intervention that focuses on caloric reductions or other dietary restrictions.
Physical Lifestyle Interventions:
Similarly to nutrition programs aimed at children, there have been programs specifically targeted at increasing levels of physical activity in order to prevent childhood obesity. One study was performed in preschool children and took place over thirty weeks. The program
years they found that there was a decrease in adiposity among those in the physical education group but this decrease was not significant.41 Dance for Health was a program for African American and Hispanic adolescents that randomized 43 students into the dance for health intervention and 38 students to usual physical activity. They discovered that students in the intervention had significantly lower BMIs and lower resting heart rates than those in the regular physical activity group. Of note, this effect was greater in girls than it was in boys.42 A program called New Moves was a girls‟ only physical education class that randomized six schools into intervention and control. The study measured physical impact, eating patterns, self-perceptions, and BMI for 89 girls in the intervention and 112 in the control. Overall the program was well received and girls in the intervention reported that the program positively influenced their
physical activity, eating patterns, and self image. In spite of this, none of the measurements were statistically significant for intervention group versus control group.43 A school based
intervention called PLAY (Promoting Lifestyle Activity for Youth) separated 606 students from 35 Arizona schools into four groups: physical education and PLAY, PLAY only, physical education only, and no treatment. All treatment groups were more significantly effective for increasing physical activity than the no treatment group, but no differences in BMI were seen in each group.44 An interesting study that sought to increase physical activity through a reduction in television watching and video game playing separated 192 third and fourth grade students in two schools for a six month period of time where the intervention group had an 18 lesson
intake, moderate to vigorous physical activity, and cardio-respiratory fitness.45 Based on these studies, there is some benefit from incorporating more physical activity as well as decreased sedentary activity in improving several aspects of childhood health. A great decline in BMI was not noted to have taken place from these interventions in the majority of these studies,
particularly long term decreases in BMI.
A randomized control trial was recently published called the Stanford Sports to Prevent Obesity Randomized Trial (SPORT). It randomized 21 children with BMIs above the 85th percentile who were in the 4th or 5th grade and who lived in a low income, minority community. Nine were randomized into the treatment arm which involved an after school soccer team that initially met three times per week then for four times per week for the six months of the study. Physical activity was measured using an accelerometer, and reported television time, a self-esteem scale, and depression scale were used to compare them with the twelve students in the control group which involved 25 weekly health and nutrition information meetings which
promoted healthy eating and physical activity. There were significant reductions in the treatment group for BMI, BMI z-score, which is matched for age and gender, and total daily physical activity at 3 and 6 months; however, the data is not significant for television viewing or self esteem. This study obviously is limited in its small sample size, but is an important pilot study and targets the most at risk population of minority children of low socioeconomic status and does so using a low cost intervention.49
Multidisciplinary Lifestyle Interventions:
interventions might be predicted to have the most success. Even more success may be obtained particularly in the long term if the family is involved in incorporating these lifestyle changes in the child‟s life. There have been several studies that have examined the efficacy of
multidisciplinary studies.
The Bright Bodies program at Yale has recently shown success in a multidisciplinary intervention program to combat pediatric obesity.13 This RCT randomized 174 minority children living in an inner city into either an intensive lifestyle modification program or a control group. All participants were between the ages of 8 and 16 and had BMIs > 95% for their age and gender. The intervention group underwent a family-based program that involved classes and behavior modification sessions which stressed the importance of exercise and proper nutrition for obesity prevention. Importantly for this program, the participants were required to bring their caregiver to all classes, which met biweekly for the first six months, and then bimonthly for the remaining six months. At the end of the 12 month study, the intervention group showed very minimal weight gain with a mean of 0.3 kg, while those in the control group had a mean increase in weight gain of 7.7 kg, a 4% reduction in body fat (-3.7 kg, vs. +5.5 kg in controls), a modest fall in BMI (-1.7 vs. +1.6 in controls), and even a marked decrease in insulin sensitivity (as measured by HOMA-IR (homeostasis model assessment of insulin resistance) -1.52 in intervention vs. +0.90 in control). All p values for the above measurements were < 0.001.
facilitation maintenance, or a control group and were followed up at one and two years. The weight loss program as well as the two intervention programs all involved weekly meetings that required at least one parent attend each session as well. The control group had no further contact with the group after the 5 month weight loss program. The weight loss intervention alone was statistically significant from baseline with a mean change -0.22 in BMI z-score, with a p-value <0.001. In the short term, both of the active maintenance groups had more success in
maintaining a lower BMI z-score than those in the control group with a p value <0.001. For long term results, baseline to two years, BMI z-score maintenance was significantly better in the social facilitation maintenance group or the pooled active treatment groups versus the control group but was not significantly different for the behavioral skills maintenance treatment group versus control at two years.14
The Girls health Enrichment Multi-site Study (GEMS) involves four pilot studies that were undertaken in 2003 and enrolled overweight African-American girls between the ages of 8 to 10 and their families in short-term programs that stressed dietary change, increased physical activity, and enhanced self-esteem.36, 50-52
water as well as fruits and vegetables, and decreased sweetened beverages. There were no differences in BMI, although there was a trend toward lower BMI among the heavier girls in the treatment compared to the girls in the control group.36
The Memphis GEMS pilot study is another 12 week intervention. There were three arms in this study, one a control, and two active arms that focused on nutrition and physical activity, one of which was parents only and the other was children only. Twenty one children were randomized to the child targeted intervention while twenty one parents were randomized to the parent targeted intervention. Both involved weekly 90 minute sessions. Eighteen were
randomized to a comparison group. The results showed that both active interventions produced more healthy results than the comparison group; however, the parent intervention showed an even greater increase in physical activity and fewer calories from fat when compared with the child targeted intervention group.50
The Stanford GEMS is a 2 arm 12 week randomized control trial. Sixty one eight to ten year old African American girls with a BMI greater than the 50th percentile were eligible and randomized into either treatment intervention which included after school dance lessons three times per week and 5 sessions during the twelve weeks on reducing television time. The active control group gave health education lectures and handed out newsletters. After 12 weeks, the girls in the intervention had a decrease in BMI of -0.32 kg/m2, 95% confidence interval [-0.77, 0.12] and reduced television time -4.96 hours/week, 95% confidence interval [-11.41, 1.49].51
not discuss topics pertaining to nutrition or physical activity. BMI remained the same between groups at the end of twelve weeks but there was a trend for girls in the intervention group to report more physical activity, less caloric intake with fewer calories from fat, and increased water consumption.52 While the enrollment in each of the GEMS studies was too small to yield large statistical significance between groups, the initial results were promising enough that two of the four studies are currently in phase II trials.
Children who develop T2DM will likely experience the associated co-morbidities such as diabetic retinopathy, peripheral neuropathy, and renal damage that will likely affect this
family centered interviewing techniques have become popular. Motivational interviewing is one such technique and it involves the idea that the instruction offered by the physician will only be efficacious if family members not only recognize the problem, have a personal interest in the problem, but also believe that they can create change, and this is a technique that is used by physicians in the HLP.55, 56
Despite an overall benefit seen in such studies as the Bright Bodies Program and GEMS, lifestyle modification is a costly intervention, as it requires substantial time on the part of the research team, as well as significant money to implement multidisciplinary interventions targeting a sizeable population. These intensive interventions programs discussed above were very expensive to implement, seeking to reach high-risk children at multiple levels across an extended period of time. Many of the demonstration programs that have been reported are resource intense and thus difficult to replicate.
Critical analysis of studies identified in the literature review
Bright Bodies and other similar multi-disciplinary interventions yield the most promise for long term childhood weight loss and behavior modification. Some recent studies with the example of SPORT14 are beginning to recognize the importance of targeting a high risk population of minority children of low socioeconomic status by providing them with an
inexpensive intervention. This intervention solely focused on increased physical activity which is undoubtedly important; however, involving the child and their family in other behavior
childhood obesity. Programs which simply focus on nutrition, particularly at school, are failing to recognize that eating behaviors are becoming ingrained in the child at home and are much more likely to represent that child‟s eating behavior in the future than the nutritious content of one meal five days a week. It is likely for this reason that studies have shown that interventions that have involved parents are more successful that interventions that target the children alone. The Motivational interviewing used in the HLP incorporates the idea that the family has to recognize that there is a problem, want to do something about it, and importantly believe that they can change things. The GEMS interventions are all quite different in terms of time
requirements yet all of them met at least once a week with the maximum of a day camp for four weeks. For the majority of people, these time demands are simply not feasible.
Medical interventions are becoming more necessary as obesity becomes more prevalent and children are developing more co-morbidities. Medical treatment of any kind is unfortunately expensive, and as such, these types of programs are not going to be able to treat children who are either at risk for developing co-morbidities from obesity or even worse children who will not receive treatment for co-morbidities they already have. Duke Healthy Lifestyles Program (HLP) is similar to some of the other medical multidisciplinary programs in that the patient sees a physician as well as a dietician and a social worker during their visit. While they are there, there is a focus on increasing physical exercise, increasing fruits, vegetables, and water consumption, decreasing sweetened beverages, decreasing portion sizes and high calorie foods, decreasing television time, and a focus on good sleep.
and its co-morbidities accessible to all children including those in a low socioeconomic class. No other study to date has examined whether programs that only meet monthly and are therefore accepted by third party payers are efficacious in promoting childhood weight loss and a decrease in associated co-morbidities. This paper analyzes the initial data from the program
This study is the first initial analysis of any of the data from the HLP. Using a retrospective chart analysis on data that is already available is the quickest way to determine from preliminary data whether this program as it currently is run is efficacious. Using retrospective data may help to elucidate ways in which the program can best be improved to optimize the results for patients in the future. Analyzing data in the literature as well as comparing these results to other results from other multidisciplinary studies will show the relationship that this multidisciplinary program has that meets once a month to other
multidisciplinary programs which meet more frequently. It is also of import to try to determine if there are any factors which predispose a child for completion in the program that may help physicians in identifying these children as well as child who only complete one visit then never return.
Methods
Intervention:
Vance, Orange, Cumberland, Alamance, Person, Nash, and Franklin, with very few patients coming from out of state.
Research Design/Measurement Analysis:
discussed further in the discussion section as a limitation of the study. The retrospective chart analysis was performed in 1/1/08 on children enrolled in the program from 10/2006-4/2007.
Methods for systematic Literature Search:
Abstracts in the PubMed database dated 1980 to June 2008 were searched using the terms: „pediatric obesity intervention‟, „pediatric obesity program‟, „pediatric obesity lifestyle‟, „pediatric obesity prevention‟, „pediatric diabetes prevention‟, „pediatric diabetes lifestyle‟, and „pediatric diabetes nutrition‟, „family child obesity prevention‟, and „family perceptions
overweight children‟. The goal was to find good quality studies, RCTs if available were chosen that intervened in overweight and obesity and its associated co-morbidities in pediatric
Quality Rating of Literature:
Table 4. Quality ratings for studies in literature review. Each study was rated 0-3 for each category, with 0=poor, 1=fair, 2=good, 3=excellent.
Study, Authors, Year Control Group? Source population Adequately Described? Study Population representati ve of source population? Adequate means of collecting data? Data collectors identified ? Appropr iate analysis ? Results reported adequately, with P-values and/or CI? Overall Quality Score TV viewing Robinson , T. 1999
2 2 2 3 3 2 3 17
Maintena nce treatment for weight loss Wilfley et al 2007
3 3 3 3 2 3 3 20
New-Moves Neumark-Sztainer et al. 2003
2 2 2 2 2 3 2 17
Improving school food. Cullen et al. 2007.
1 1 1 2 2 2 1 10
CHOPPS . James J et al. 2007.
3 2 2 2 2 3 3 17
Carbonat ed beverage s. James J et al. 2004.
3 2 2 2 2 3 3 17
School based exercise program. Mo-suwan et al. 1998.
2 3 2 3 3 2 3 18
Dance for Health. Flores R. 1995.
Study, Authors, Year Control Group? Source population Adequately Described? Study Population representati ve of source population? Adequate means of collecting data? Data collectors identified ? Appropria te analysis? Results reporte d adequat ely, with P-values and/or CI? Overa ll Qualit y Score PLAY. Pangrazi RP. 2003.
2 2 2 2 2 2 2 14
Increasing fruit and vegetable. Epstein LH et al. 2001.
3 2 2 2 1 2 2 14
Weight managem ent program RCT. Savoye M et al. 2007.
3 3 2 2 2 3 3 18
FFFP: GEMS. Baranowsk i et al. 2003.
3 3 3 2 2 3 2 18
Memphis GEMS. Beech BM et al. 2003.
3 3 3 2 2 3 2 18
Dance, Stanford GEMS. Robinson TN et al. 2003.
3 3 3 3 2 3 2 19
After school program. Minnesota GEMS. Story M et al. 2003.
3 3 2 2 2 3 2 17
SPORT Weintraub et al 2008
Masters Paper addendum to discussion:
There are many childhood obesity programs in the country. For example, in North Carolina alone, there is the Healthy Weight Research and Treatment Center and East Carolina University, the NEW Kids Program (Nutrition, Exercise, and Weight Management Program at Wake Forest, and the Pediatric Obesity Research Center at the University of North Carolina at Chapel Hill including Duke‟s HLP. As mentioned before, very few have published any data on the efficacy of their programs. However, the Bright Bodies program has recently published on a RCT of their program.13
A RCT that randomized 204, 7-12 year old children with BMIs 20-100% above the median for their age and sex who also had at least one overweight parents involved children to undergo an initial weight loss program that was 5 months long that involved weekly meetings and required that at least one parent attend each session.14 The weight loss intervention alone was statistically significant from baseline with a mean decrease in BMI z-score of 0.22, with a p-value <0.001. This is similar in results to the change in BMI z-score at completion of Duke‟s HLP with a decrease in BMI z-score of 0.18.
An intensive three month multidisciplinary study sought to examine the long term benefits of the intervention at 1 year post intervention. At 3 months this study had a significant decrease in body weight from 63.8 to 61.0, BMI from 28.5 to 26.8, and body fat percentage from 40.2 to 36.920 A main difference in this study was that it involved a twice weekly 1 hour exercise session for the full 3 months which may help account for the weight loss that is seen in this intervention that is not seen in some of the others that do not involve mandatory supervised exercise sessions. This study with a starting mean BMI of 28.5 is also likely a different
population than those in the HLP with 2-6 visits with a starting mean pre-BMI of 33.2 ±8.3 and their post-BMI is 33.3 ±9.0. The data for those who completed the study in the HLP did have a significant 0.9 loss in BMI compared to this three month exercise intensive program with a 1.7 mean decrease in BMI.
the data in table 1, there is no significant difference in the groups upon enrollment in the HLP. Those with 2-3 visits or 4-5 visits did not have successful outcomes, while children who went on to complete the program with 6 visits did have significantly successful outcomes. Another study performed in the UK, where children attended an inpatient clinic for at least a year were more likely to have what they defined as a successful outcome of a decrease in the BMI Standard Deviation Score of at least 0.5 if they were primary school aged rather than older, boys, and children without obese parents.18
Another factor that may not predict success per se after enrollment in an intervention program but may help physicians in predicting which children are going to become obese in order to help prevent these children from even needing to enter an obesity intervention program is the height and weight growth of a child and the age at which they reach a BMI ≥ 85th
percentile. A child who had a BMI ≥ 85th
percentile one or more time at the 24, 36, or 54 month check up is more than five times as likely to be overweight at age 12 than a child who was not overweight at any of these three time points. Children who have a BMI between the 75th and 85th percentile anytime up until they are 9 years old have a 40-50% chance of being overweight by age 12. No children whose BMIs were less than the 50th percentile in elementary school were overweight by 12 years old.57 This information can help physicians in identifying and providing early counseling to parents and children as the earlier the child can receive intervention, the more likely it may have positive benefits early on.
childhood is low income. In this study, neither race nor marital status influenced the rate of overweight in children. The factors that the primary caregiver felt were important in causing childhood obesity such as diet or physical activity were significantly related to childhood obesity, but when the study accounted for income in this model, this relationship was no longer significant. Therefore this study concludes that family income is strongly the most important predictor for childhood obesity.58 This is particularly important for the future of public health and childhood obesity and highlights the need to find an intervention that is efficacious and can be assessed by children of low socioeconomic status.
As one of the criteria for involvement in the Duke HLP is to be diagnosed and referred by a physician is it interesting to be aware of the practices of diagnosing and referring children for obesity by pediatricians. One factor that was discovered to play a role in how a pediatrician counseled a child on their weight was the pediatrician‟s own weight. Interestingly, nearly 49% of overweight physicians did not classify themselves as overweight with significantly more men misclassifying themselves. Those who classified themselves as “thin” were six times as likely to report having difficulty counseling children as a result of their own result in comparison with “average” weight physicians while those who classified themselves as “overweight” were four times as likely as the “average” weight physicians to report weight counseling difficulties to their patients.59
adequately treating this issue. On the positive side in this study, it was shown that 89% of
pediatricians took some form of advocacy for obesity prevention and treatment for their patients. However, this leaves the remaining 11% who do not advocate for their patients at all, and leaves doubt for the 29% of pediatricians who did not respond to this cross-sectional mailed survey.60
In light of the increasing prevalence of childhood obesity, the role of the physician in recognizing the problem early and begin counseling the parents as soon as possible is incredibly important. The studies above show part of the problem in physician‟s having a difficult time counseling patients and very few actually feeling like they are able to adequately treat pediatric obesity. The other large part of the problem is the parents themselves. The physicians
themselves can only do so much particularly if the parents are not bringing their children into the pediatrician‟s office. One study investigated the concern that parents had for their children‟s weights as well as to try to discern what factors were involves that actually motivated parents to become concerned. As an answer to the first question, they discovered that out of the 347 children in the study, 82% of the parents of overweight children and 18% of obese children had little parental concern regarding their child‟s weight. Some of the factors that they found to be associated with increased parental concern were a higher BMI for their child, a decrease in the child‟s health related quality of life, and a more correct estimation of their child‟s body size.61
Another study used pictures as well as words to try to identify a parent‟s perception of their child‟s weight. The study had 223 children ranging in age from 2-17 years old with a good mix of racial backgrounds. Of these children 19% were between the 85th and 94th percentile and considered at risk for being overweight while 20% were ≥ 95th
selected a more accurate sketch. This helps understand part of the problem that many of the times even if the parent can accurately point out what their child visually looks like by sketch, they would not call that overweight by terminology. This same study asked parents of
overweight children or those at risk for overweight if they remembered a doctor talking to them about their child‟s weight and only 18% of them said yes. They found that among this group of parents, 26% were worried about their child‟s weight and this was more correlated with parents of older children and those lifestyle‟s and activities were being impacted due to their weight. 62
. Yet another study showed that parents continued to underestimate their child‟s weight. This was significantly more evident in parents of younger children than parents of adolescents at 65% underestimating versus 51%. This study found that underestimating was not associated with education, socioeconomic status, or the BMI of the parents. It was however found that African American parents were twice as likely as Caucasian parents to underestimate their child‟s weight. After this initial study these children were enrolled in a public school program that involving BMI screening with feedback to the parents. Follow up after one year of this program showed that underestimation improved from 60% to 53% and African American parents showed a statistically significant improvement from baseline over Caucasian parents with the feedback program.63
Looking into the factors that are associated with parents being motivated to promote change is a study that examines 151 parents of overweight or obese children aged 2-12, and through a questionnaire determined the stage of change that the parents were in regarding their child‟s weight with the stages being: pre-contemplation, contemplation, and preparation/action. It was found that 38% were in the preparation/action stage which is important as this is likely the core of the group of children who come to the intervention programs like the HLP with some children possibly from the contemplation stage as well of which 17% of parents belonged. The remaining 44% of parents were in the pre-contemplation stage of change. They discovered that the factors associated with parents being in the preparation/action state of change are having an older child, particularly an overweight older child, perceiving themselves or their child/children as
overweight, and believing that their weight was a hazard to their health.64
Of importance to this study is the use of motivational interviewing and the idea that in order for this type of technique to work the family has to recognize the problem, want to change the problem, and believe that they can change the problem. All of these factors discussed above may help determine which families may recognize when a problem exists and when they believe it is important enough to do something about it. These are the children and families who are most likely to benefit from these interventions.
school wide programs may do is cause psychological harm to the overweight children who are being forced to be enrolled in them. In fact, all childhood obesity intervention programs have come into question about whether they cause any psychological harm to the children that are undergoing enrollment in these programs.
The PACE+ study, a one year intervention for adolescents, addressed the question not only of whether the intervention caused the adolescents to gain weight, but at what expense to their psyche? They were particularly concerned that these types of interventions could lead to adolescents developing unhealthy obsessive habits dealing with food and exercise. After analyzing the data from 657 adolescents, they found that self-esteem and body image did not worsen for boys or girls regardless of their weight throughout the study. They also found that girls who had weight reduction or weight maintenance at 6 months and 12 months had
statistically significantly self reported improvements in body image satisfaction compared to girls who gained weight.22 Another study investigated a more radical intervention, children‟s weight loss camps. This study had 57 obese campers and 38 comparison campers of normal weight. The obese campers had lower self-worth and greater body dissatisfaction scores at baseline than the comparison children. At the end of the 4 weeks, the obese children reduced their BMI by a mean of 2.1 kg/m2. The self esteem scores significantly increased and the body scale dissatisfaction scores significantly decreased.23 The results of these studies seem to
indicate that childhood obesity interventions do not seem to be harmful, in fact if the intervention is efficacious it may not be just effective for weight loss, but may lead to psychological
improvements as well. This data appears to be in line with the results that were obtained in this study as the HLP showed an improvement in the Mood and Feeling Questionnaire at the
There are several future studies can extend from this initial analysis into the HLP. The HLP does require the attendance of a primary caregiver at each visit, and recognizing the influence of the primary caregiver of the child‟s success in the program,9, 10
, the HLP recently began to record the BMI of the primary caregiver of the patient at each visit several months ago. Doing so more fully incorporates the notion that the program is about lifestyle modification and weight loss not only for the child but for the whole family as well. This data could not be analyzed in this study, but the effect of the program on the BMI of the primary caregiver would be of interest for a future study. Particularly to examine the relationship of whether the children who were losing the most weight were in families where the primary caregiver‟s BMIs were also significantly declining or whether there was no significant relationship between their BMIs to their children‟s.
Having a randomized control trial where overweight or obese children were randomized in the Healthy Lifestyles Program or another group that met monthly as a control group would be an ideal future study to examine the true efficacy of the program. Having a control group to compare the children in this study would make the results stronger, yet the setup of the HLP makes having a comparable control group quite difficult as the children in the HLP are those who are referred by their primary care physician for uncontrolled obesity or an obesity-related co-morbidity. Certainly children being referred for medical care could not be simply randomized to a control group where nothing was done, but perhaps they could be randomized to a group that only met with a doctor and continued to receive medical care including work-up and treatment of any co-morbidities and general counseling as is generally given by a pediatrician approximately once a month for six visits. These groups could then be compared and would make for a
Another trial that would be of interest given the data reported in table 2 on the apparent similarities between the 2-3 visit group and the 4-5 visit group versus the completion group would be a simple retrospective chart analysis of the children who had completed the program at their 2-3 visit and again at their 4-5 visit. This data could then be compared not only to their completion data but also to the data already collected for this study against those with 2-3 and 4-5 visits and to see if those who went on to complete the study were a significantly different population from those who did not continue at their 2-3 visit or at their 4-5 visit. This information may be of use to physicians in helping to identify success factors for obesity intervention programs.
Another limitation of the study not discussed above was that the HLP is still in continuation enrolling patients yet this was a retrospective chart analysis, thus limiting the number of patients whose data could be analyzed. In order to define a time to allow for adequate completion of all six visits of the study, patients who were enrolled before nine months
preceding the IRB approval date for the retrospective analysis were considered for the study, accounting for the looking at all patients enrolled between 10/2006 and 4/2007 with IRB approval in 1/2008. It is therefore possible that there as some patients who were enrolled in 4/2007 and had only had 4-5 visits by 1/2008 and had not had time to be considered a completer for the purposes of this study.
References
1. Armstrong SaFM. "Multimodal childhood obesity treatment programs: An evidence-based review." Sumission to Review of Endocrinology. 2008.
2. Statistics CNCfH. NHANES data on the Prevalence of Overweight among Children and Adolescents: United States, 2003-2004. Health E-Stat. 2003-2004.
3. Pinhas-Hamiel O, Zeitler P. Type 2 diabetes in adolescents, no longer rare. Pediatr Rev.
Dec 1998;19(12):434-435.
4. Whitlock EP, Williams SB, Gold R, Smith PR, Shipman SA. Screening and interventions for childhood overweight: a summary of evidence for the US Preventive Services Task Force. Pediatrics. Jul 2005;116(1):e125-144.
5. Freedman DS, Dietz WH, Srinivasan SR, Berenson GS. The relation of overweight to cardiovascular risk factors among children and adolescents: the Bogalusa Heart Study.
Pediatrics. Jun 1999;103(6 Pt 1):1175-1182.
6. Bibbins-Domingo K, Coxson P, Pletcher MJ, Lightwood J, Goldman L. Adolescent overweight and future adult coronary heart disease. N Engl J Med. Dec 6
2007;357(23):2371-2379.
7. Spear BA, Barlow SE, Ervin C, et al. Recommendations for treatment of child and adolescent overweight and obesity. Pediatrics. Dec 2007;120 Suppl 4:S254-288. 8. Epstein LH, Valoski AM, Kalarchian MA, McCurley J. Do children lose and maintain
weight easier than adults: a comparison of child and parent weight changes from six months to ten years. Obes Res. Sep 1995;3(5):411-417.
9. Birch LL, Davison KK. Family environmental factors influencing the developing behavioral controls of food intake and childhood overweight. Pediatr Clin North Am.
Aug 2001;48(4):893-907.
10. Golan M, Crow S. Parents are key players in the prevention and treatment of weight-related problems. Nutr Rev. Jan 2004;62(1):39-50.
11. Epstein LH, Valoski A, Wing RR, McCurley J. Ten-year outcomes of behavioral family-based treatment for childhood obesity. Health Psychol. Sep 1994;13(5):373-383.
12. Epstein LH, Valoski A, Wing RR, McCurley J. Ten-year follow-up of behavioral, family-based treatment for obese children. Jama. Nov 21 1990;264(19):2519-2523.
13. Savoye M, Shaw M, Dziura J, et al. Effects of a weight management program on body composition and metabolic parameters in overweight children: a randomized controlled trial. Jama. Jun 27 2007;297(24):2697-2704.
14. Wilfley DE, Stein RI, Saelens BE, et al. Efficacy of maintenance treatment approaches for childhood overweight: a randomized controlled trial. Jama. Oct 10
2007;298(14):1661-1673.
15. Quality NIfCsH. Expert Committee Recommendations on the Assessment, Prevention and Treatment of Child and Adolescent Overweight and Obesity - An Implementation Guide from the Childhood Obesity Action Network. 2007.
16. Quality AfHRa. Evaluation and Treatment of Childhood Obesity. 2004.
17. Active healthy living: prevention of childhood obesity through increased physical activity. Pediatrics. May 2006;117(5):1834-1842.
19. Rosner B, Prineas R, Loggie J, Daniels SR. Percentiles for body mass index in U.S. children 5 to 17 years of age. J Pediatr. Feb 1998;132(2):211-222.
20. Nemet D, Barkan S, Epstein Y, Friedland O, Kowen G, Eliakim A. Short- and long-term beneficial effects of a combined dietary-behavioral-physical activity intervention for the treatment of childhood obesity. Pediatrics. Apr 2005;115(4):e443-449.
21. Carter FA, Bulik CM. Childhood obesity prevention programs: how do they affect eating pathology and other psychological measures? Psychosom Med. Apr 2008;70(3):363-371. 22. Huang JS, Norman GJ, Zabinski MF, Calfas K, Patrick K. Body image and self-esteem
among adolescents undergoing an intervention targeting dietary and physical activity behaviors. J Adolesc Health. Mar 2007;40(3):245-251.
23. Walker LL, Gately PJ, Bewick BM, Hill AJ. Children's weight-loss camps: psychological benefit or jeopardy? Int J Obes Relat Metab Disord. Jun 2003;27(6):748-754.
24. Angold A CE, Messer SC, Pickles A, Winder F, and Silver D. . The development of a short questionnaire for use in epidemiological studies of depression in children and adolescents. International Journal of Methods in Psychiatric Research. 1995 1995;5:237-249.
25. Wald ER, Ewing LJ, Cluss P, et al. Parental perception of children's weight in a paediatric primary care setting. Child Care Health Dev. Nov 2007;33(6):738-743. 26. Gordon-Larsen P, Adair LS, Popkin BM. The relationship of ethnicity, socioeconomic
factors, and overweight in US adolescents. Obes Res. Jan 2003;11(1):121-129. 27. Wang Y, Lobstein T. Worldwide trends in childhood overweight and obesity. Int J
Pediatr Obes. 2006;1(1):11-25.
28. Ogden CL, Carroll MD, Curtin LR, McDowell MA, Tabak CJ, Flegal KM. Prevalence of overweight and obesity in the United States, 1999-2004. Jama. Apr 5
2006;295(13):1549-1555.
29. Jolliffe CJ, Janssen I. Vascular risks and management of obesity in children and adolescents. Vasc Health Risk Manag. 2006;2(2):171-187.
30. Imhof A, Kratzer W, Boehm B, et al. Prevalence of non-alcoholic fatty liver and characteristics in overweight adolescents in the general population. Eur J Epidemiol.
2007;22(12):889-897.
31. Gushue DL, Houck J, Lerner AL. Effects of childhood obesity on three-dimensional knee joint biomechanics during walking. J Pediatr Orthop. Nov-Dec 2005;25(6):763-768. 32. Wing YK, Hui SH, Pak WM, et al. A controlled study of sleep related disordered
breathing in obese children. Arch Dis Child. Dec 2003;88(12):1043-1047.
33. Matricardi PM, Gruber C, Wahn U, Lau S. The asthma-obesity link in childhood: open questions, complex evidence, a few answers only. Clin Exp Allergy. Apr 2007;37(4):476-484.
34. Swallen KC, Reither EN, Haas SA, Meier AM. Overweight, obesity, and health-related quality of life among adolescents: the National Longitudinal Study of Adolescent Health.
Pediatrics. Feb 2005;115(2):340-347.
35. Satia JA, Galanko JA, Siega-Riz AM. Eating at fast-food restaurants is associated with dietary intake, demographic, psychosocial and behavioural factors among African Americans in North Carolina. Public Health Nutr. Dec 2004;7(8):1089-1096.
37. James J, Thomas P, Cavan D, Kerr D. Preventing childhood obesity by reducing consumption of carbonated drinks: cluster randomised controlled trial. Bmj. May 22 2004;328(7450):1237.
38. James J, Thomas P, Kerr D. Preventing childhood obesity: two year follow-up results from the Christchurch obesity prevention programme in schools (CHOPPS). Bmj. Oct 13 2007;335(7623):762.
39. Epstein LH, Gordy CC, Raynor HA, Beddome M, Kilanowski CK, Paluch R. Increasing fruit and vegetable intake and decreasing fat and sugar intake in families at risk for childhood obesity. Obes Res. Mar 2001;9(3):171-178.
40. Mo-suwan L, Pongprapai S, Junjana C, Puetpaiboon A. Effects of a controlled trial of a school-based exercise program on the obesity indexes of preschool children. Am J Clin Nutr. Nov 1998;68(5):1006-1011.
41. Sallis JF, McKenzie TL, Alcaraz JE, Kolody B, Hovell MF, Nader PR. Project SPARK. Effects of physical education on adiposity in children. Ann N Y Acad Sci. Oct 29
1993;699:127-136.
42. Flores R. Dance for health: improving fitness in African American and Hispanic adolescents. Public Health Rep. Mar-Apr 1995;110(2):189-193.
43. Neumark-Sztainer D, Story M, Hannan PJ, Rex J. New Moves: a school-based obesity prevention program for adolescent girls. Prev Med. Jul 2003;37(1):41-51.
44. Pangrazi RP, Beighle A, Vehige T, Vack C. Impact of Promoting Lifestyle Activity for Youth (PLAY) on children's physical activity. J Sch Health. Oct 2003;73(8):317-321. 45. Robinson TN. Reducing children's television viewing to prevent obesity: a randomized
controlled trial. Jama. Oct 27 1999;282(16):1561-1567.
46. Hamman RF, Wing RR, Edelstein SL, et al. Effect of weight loss with lifestyle intervention on risk of diabetes. Diabetes Care. Sep 2006;29(9):2102-2107. 47. Atkins diet dangerous for kids, says top nutritionist. February 17, 2004 2004. 48. Put fat children on Atkins diet. BBC News. March 14, 2004 2004.
49. Weintraub DL, Tirumalai EC, Haydel KF, Fujimoto M, Fulton JE, Robinson TN. Team sports for overweight children: the Stanford Sports to Prevent Obesity Randomized Trial (SPORT). Arch Pediatr Adolesc Med. Mar 2008;162(3):232-237.
50. Beech BM, Klesges RC, Kumanyika SK, et al. Child- and parent-targeted interventions: the Memphis GEMS pilot study. Ethn Dis. Winter 2003;13(1 Suppl 1):S40-53.
51. Robinson TN, Killen JD, Kraemer HC, et al. Dance and reducing television viewing to prevent weight gain in African-American girls: the Stanford GEMS pilot study. Ethn Dis.
Winter 2003;13(1 Suppl 1):S65-77.
52. Story M, Sherwood NE, Himes JH, et al. An after-school obesity prevention program for African-American girls: the Minnesota GEMS pilot study. Ethn Dis. Winter 2003;13(1 Suppl 1):S54-64.
53. Gee L, Smith TL, Solomon M, Quinn MT, Lipton RB. The clinical, psychosocial, and socioeconomic concerns of urban youth living with diabetes. Public Health Nurs. Jul-Aug 2007;24(4):318-328.
54. Bhatia V. IAP National Task Force for Childhood Prevention of Adult Diseases: insulin resistance and Type 2 diabetes mellitus in childhood. Indian Pediatr. May
2004;41(5):443-457.
56. Schwartz RP, Hamre R, Dietz WH, et al. Office-based motivational interviewing to prevent childhood obesity: a feasibility study. Arch Pediatr Adolesc Med. May 2007;161(5):495-501.
57. Nader PR, O'Brien M, Houts R, et al. Identifying risk for obesity in early childhood.
Pediatrics. Sep 2006;118(3):e594-601.
58. Gray VB, Byrd SH, Cossman JS, Chromiak J, Cheek WK, Jackson GB. Family
characteristics have limited ability to predict weight status of young children. J Am Diet Assoc. Jul 2007;107(7):1204-1209.
59. Perrin EM, Flower KB, Ammerman AS. Pediatricians' own weight: self-perception, misclassification, and ease of counseling. Obes Res. Feb 2005;13(2):326-332. 60. Perrin EM, Flower KB, Garrett J, Ammerman AS. Preventing and treating obesity:
pediatricians' self-efficacy, barriers, resources, and advocacy. Ambul Pediatr. May-Jun 2005;5(3):150-156.
61. Lampard AM, Byrne SM, Zubrick SR, Davis EA. Parents' concern about their children's weight. Int J Pediatr Obes. 2008;3(2):84-92.
62. Eckstein KC, Mikhail LM, Ariza AJ, Thomson JS, Millard SC, Binns HJ. Parents' perceptions of their child's weight and health. Pediatrics. Mar 2006;117(3):681-690. 63. West DS, Raczynski JM, Phillips MM, Bursac Z, Heath Gauss C, Montgomery BE.
Parental recognition of overweight in school-age children. Obesity (Silver Spring). Mar 2008;16(3):630-636.
64. Rhee KE, De Lago CW, Arscott-Mills T, Mehta SD, Davis RK. Factors associated with parental readiness to make changes for overweight children. Pediatrics. Jul