The journal homepage www.jpacr.ub.ac.id
ISSN : 2302 ‐ 4690
88
Adsorption of Iron(II) By Fly Ash Adsorbent from Coal
Candra Irawan,1,2* Atikah,2 and Barlah Rumhayati,2
1
Polytechnic of Balikpapan, Jl. Soekarno Hatta Km. 8 Balikpapan 76126
2
Department of Chemistry, Faculty of Mathematics and Natural Sciences, Brawijaya University
*
Corresponding email: candraarema1977@gmail.com
Received 22 July 2013; First revision 1 September 2013; Final revision 28 March 2014;
Accepted 28 April 2014; First published 16 April 2014; Published online for edition September-December 2014
ABSTRACT
This research has investigated adsorption of Fe with using fly ash adsorbent. Phase of adsorption of Fe is activated with H2SO4 after that the fly ash were characterized by using
XRF, FTIR and SEM. Determination of optimum conditions on the adsorption of Fe with adsorbent mass variations, variations in contact time, pH variation and variation concentration and adsorption isotherm study. Resulth show that the adsorption of Fe in optimum condition occurs in adsorbent mass of 2.5 g, for 60 minutes contact time with pH 4 at a concentration of 20 ppm. The results also able to adsorp up to 94% Fe. The adsorption of Fe with using fly ash adsorbent was more fitted to the Langmuir model than to Freundlich model.
Key words: adsorption, fly ash, isotherm adsorption
INTRODUCTION
Fly ash of coal are produced in the burning of the coal in the PLTU in the form of ash particles that are carried by exhaust gas while the remaining ashes and removed at the bottom of the furnace called as bottom ashes. In Indonesia, the fly ashes and bottom ashes productions increase from year to year. In 2009, the fly ashes production has reached 2.78 million tons [1]
The fly ashes of coal in general are thrown away in the landfill or stacked at the industrial area. The fly ashes handling of the coal still limited at the pilling up the vacant land. It has danger potentials for the environment and societies around if it is carried in the waters. If it is left continuously, then the fly ash do not have economic value even danger for the environment around, such as societies will experience the respiratory tract infection, the equipments and dried clothes will be dirty because of the ashes.
Beside the negative impacts, the fly ashes also have advantageous, that is the chemical composition mostly consist of metal oxide especially SiO2 and Al2O3 that has active site so it
is possible to be used as adsorbent for the heavy metals [2].
To get the adsorbent with high adsorbtion capacity, it can be done through activation by using acid solution (H2SO4) [3]. The activation is aimed at improving the pore specifics area
and the active site. The activation treatment by using acid solution able to dissolve the impurities at the materials so the pores widen so the pore specific area widen and the adsorption capacity of adsorbent also increase. The fly ash usage as adsorbent is able to separate the COD from the domestic liquid waste. The research results showed the adsorption capacity value reached 13.60 mg/g with efficiency of 91% [4].
The journal homepage www.jpacr.ub.ac.id
ISSN : 2302 ‐ 4690
89 Fly ashes also can be used as adsorbent to separate the metal from the water disposal. Beside that the separation of Cr in the water disposal by using fly ashes of coal where the efficiency of the fly ashes from the thermal power plant as adsorbent in separating the COD reached 87.89% for the domestic sources [5].
The research also aimed at knowing how far the fly ashes adsorption to the Fe at the ground water at the Balikpapan because the ground water quality or the drilled water at the Balikpapan still under standard and not proper for consumption, because contain high Fe, beside that the water in yellow and with odor. It can be observed with naked eye where the formation of yellow mosses at the bath up, and the deposition at the bottom of the bath up is the indication of water that contains high turbidity. The occurred condition because the ground water of the community is not processed firstly. Although the ground water is not proper for consumption, the communities still use the ground water for bath, washing plates, washing clothes, and daily needs [6].
At the Kelurahan Lamaru of RT 20 at the Balikpapan is consist of 152 KK that able to get clean water only 28 KK so the remains rely on the rain water and ground water that do not fulfill the standard so the population in general use low quality water. It has bad consequences for the community health such as irritation. The metal high concentration that causes the yellow color and odor that shows the presence of Fe content more than maximum content in water of 1.0 mg/l (Per Menkes RI No 416/Per/IX 1990). Some researches to decrease the metal content of the waste, one of them by using adsorption. The adsorption processes is one of alternatives to manage water that able to separate the impurities, the adsorption process is simple and economic [7]. The used materials as the adsorbent by the Lamaru communities of Balikpapan only by using sands and pebbles then be placed at the drum but the obtained water still turbid and with little odor. The alternative materials for adsorbent in the process can be from various materials such as fly ashes. The advantages of the fly ashes are the low cost. Beside that the adsorbent can be used well for liquid waste and can be used to separate heavy metals and colored waste [8].
The research focus is to study the influence of H2SO4 activation with characterization of
XRF, FTIR, and SEM. Then, also to study the influence of adsorbent mass, contact time, pH and adsorbate concentration toward the Fe-adsorption by using fly ashes adsorbent and using batch method. The interaction determination that occurred between adsorbent with adsorbate is determined by Langmuir and Freudlich modeling. To know the influence of adsorbent mass, contact time, pH and concentration of the adsorbate, then it used the mass variation of 1, 1.5, 2, 2.5, 3, 3.5, and 4, while for contact time of 15, 30, 45, 60, 75, 90 and 105 minutes, for pH of 2, 3, 4, 5, 6, 7 and 8 while the concentration of adsorbate 10, 20, 30, 40 and 50 ppm
EXPERIMENT
Chemicals and instrumentation
The used chemicals in the research are fly ashes, ground water, H2SO4 pa (98%, bj
1.84), NaOH (p.a), FeSO4, aquades and filter paper of Whatman No 41.
The used instrumentation is oven of Fisher Scientific Isotemp Oven of 655F, sieve (150 and 180 mesh), analytic scale of Mettle AE 50, glass equipment set, shaker rotator of type H-SR-200, pH meter (Onilab, Schott Gerate pH Meter CG 820), the magnetic stirrer (Heidolp MR 1000), Infra Red Spectrophotometer (FTIR-8000 PC Shimadzu), Scanning Electron Microscope (SEM) JEOL JSM-6390A, spectrophotometer Shimadzu UV-160 A and Spectrophotometer of Atom Adsorption (AAS).
The journal homepage www.jpacr.ub.ac.id
ISSN : 2302 ‐ 4690
90 Procedure reaction
Preparation of the fly ashes
The 30 g fly ashes are washed by aquades, then be dried in the oven with temperature of 110oC for 3 hours and be placed in the desiccators. The dried fly ashes then be weighted up to obtain the constant weight then be filtered by sieve of 150 mesh, the passed solid then be sieved again with 180 mesh. The detained solid at the second sieve be used for the next research.
Activation of coal fly ashes
The prepared fly ashes then be weighted for 10 g and be entered into chemical glass and added with 30 mL of H2SO4 with concentration of 4 M, 6M or 8 M. The mixture is soaked
for 24 hours after that be filtered and washed with aquades up to pH 7. The fly ashes then dried in oven with 110 oC for 3 hour.
Characterization of fly ashes
The composition of fly ashes are determined by using x ray flurescence spectrometer, the presence of active site at the fly ashes adsorbent are determined by FTIR and the surface of the fly ashes before and after activation then be observed by using SEM.
The determination of optimum condition for Fe adsorption The influence of adsorbent mass of the coal fly ashes
Preparing 5 solution of FeSO4 each for 100 ml with optimum concentration then be
added with fly ashes with weight variation of 0.5;1;1.5; 2; 2.5; grams then be stirred with 100 rpm for 30 minutes. Then the solution is filtered by using filter paper and the filtrate is taken for 5 ml and be diluted in the 100 ml aquades and analyzed by AAS with the wavelength of 248.3 nm. Then it is made the curve between the adsorbed %Fe with the adsorbent weight, from the curve it will be got the optimum weight.
The influence of contact time to the Fe adsorption
Preparing 5 solution of FeSO4 each for 100 ml with optimum concentration then be
added with fly ashes with optimum weight then be stirred with 100 rpm for 15, 30, 45, 60 and 75 min. Then the solution is filtered with the filter paper and the filtrate is taken for 5 ml, and be diluted at the 100 ml aquades then be analyzed by AAS with wavelength of 248.3 nm. Then it is made the curve between the adsorbed %Fe with the stirring time, from the curve it will be got the optimum stirring time.
The influence of pH to the Fe adsorption
Preparing 5 solution of FeSO4 each for 100 ml with optimum concentration then be
added with fly ashes with optimum weight after that be regulated with pH variation of 2, 3, 4, 5 and 6 then be stirred with 100 rpm for optimum time. Then the solution is filtered with the filter paper and the filtrate is taken for 5 ml, and be diluted at the 100 ml aquades then be analyzed by AAS with wavelength of 248.3 nm. Then it is made the curve between the adsorbed %Fe with the pH variation, from the curve it will be got the optimum pH.
The influence of adsorbate concentration to the Fe adsorption
Preparing 5 solution of FeSO4 each for 100 ml with concentration variation of 10, 20, 30, 40 and 50 ppm then be added with fly ashes with optimum weight after that be regulated
The journal homepage www.jpacr.ub.ac.id
ISSN : 2302 ‐ 4690
91 with optimum pH be stirred with 100 rpm for optimum time. Then the solution is filtered with the filter paper and the filtrate is taken for 5 ml, and be diluted at the 100 ml aquades then be analyzed by AAS with wavelength of 248.3 nm. Then it is made the curve between the adsorbed %Fe with calculation by using isotherm of Langmuir and Freundliq.
Experiment with original samples
The obtained optimum condition then be conditioned to the original sample. 50 ml original sample be added with fly ashes with optimum weight then be regulated with optimum pH and stirred at 100 rpm in optimum time. Then be filtered by filter paper and the filtrate is taken for 5 ml be analyzed by AAS with wavelength of 248.3 nm.
RESULT AND DISCUSSION Preparation of fly ashes
The initial stage of fly ashes by using fly ashes homogenization aimed at homogenizing the fly ashes size. If the size is not homogenous then the surface area that is passed through the Fe becomes varied. It causes the area of adsorption contact of Fe at the fly ashes surface become varied so the adsorption process become less optimum. The 150-180 mesh are selected because the size is the optimum size for adsorption process [9]. If the size lesser than 150, the fly ashes surface are become small so the adsorption process of Fe decreases. But if the size larger than 180 mesh then the space among the fly ashes molecule become smaller so the Fe metal will difficult to reach and interact with the fly ashes. Because of that, as the preliminary investigation at the research it is used 150-180 mesh. Then the fly ashes are washed by water and rinsed with aquades to remove the attached dust at the fly ashes. Then the fly ashes are dried in 110oC for 3 hours to evaporate water in the pores of fly ashes crystal.
Activation of fly ashes by using H2SO4
The activation of H2SO4 aimed at dissolving the impurities minerals at the fly ashes so
the fly ashes pores become widen so able to replace the exchanged cation (alkali or soil alkali) in the fly ashes structure with ion H+ so the fly ashes have bronsted acid group. Bearing in mind the H+ size is smaller than metal cation so physically able to widen the pore space. Beside that the H atom at the Bronsted acid group easily to be released again as H+ through ion exchange [10]. The metal ion exchange at the fly ashes with the ion H+ because of fly ashes activation by H2SO4 able to cause the Bronsted acid group (Figure 1) [11].
Figure 1. The acid activation process at the fly ash (M is metal).
The next step is to filter and rinse the mixture between the fly ashes of coal by using aquades up to the pH reached 7 because to remove the acid excess during the H2SO4 solution
addition. The water content in the fly ashes can be removed by oven in 110oC to dry. The treatment is expected able to set aside the active sites that contain metal such as Si and Al that is not used up because of drying.[12]. The heating results then be stored in the desiccators for the next test.
The journal homepage www.jpacr.ub.ac.id
ISSN : 2302 ‐ 4690
92 Characterization results of the activated fly ashes
Characterization by XRF
Based on the characterization results by using XRF from the fly ashes before activation, activation with H2SO4 4 M, 6M, and 8 M, is presented in Table 1.
Table 1. Composition of fly ashes from XRF results
Percentage
Element Before
activation
H2SO4
4M
H2SO4
6M
H2SO4
8M
Fe 42.4 33.8 38.5 10.3
Ca 28.4 8.99 12.6 8.60
Si 16.5 47.8 34.4 45.8
Al 6.10 0.10 0.10 29.4
K 1.77 3.49 3.06 0.00
Ti 1.20 1.80 1.63 1.10
S 0.85 0.10 2.90 1.35
V 0.04 0.06 0.04 0.10
Cr 0.098 0.13 0.10 0.35
Mn 0.35 0.28 0.28 0.11
Based on the characterization results of XRF from the fly ashes before activation, the activation by using H2SO4 4 M, 6M, and 8 M, Fe composition at the fly ashes before
activation still high that is 42.4% while the Si composition only 16.5%. At the activation of H2SO4 4 m and 6 m the Si element increase that is 47.8% and 34.4% but the Fe element still
high 33.8% and 38.5%. If the Fe element still high, the percentage will influence the adsorption process because able to impede the presence of active group at the fly ashes adsorbent.[13]. Based on Table 1, H2SO4 activation 8 M gives element Si and Al increase
45.75% and 32.4% while the Fe element decreases to 10.3%. If the more Si and Al compose in the fly ash, then the adsorption process will be maximums.
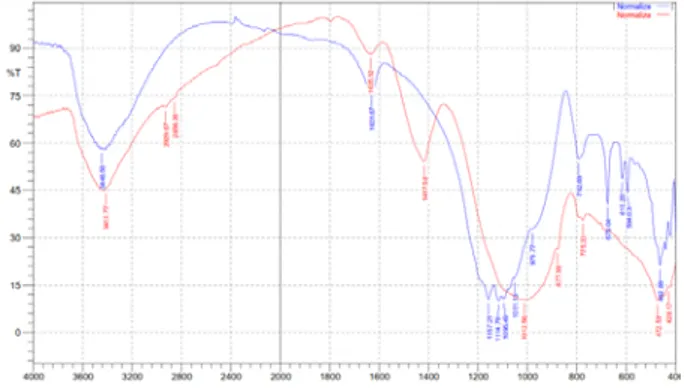
Figure 2. FTIR
spectra of fly ash before activated (red line) and after activated (blue line).
Characterization by FTIR
Identification of functional groups to the fly ashes is done by using infrared spectrophotometer at the 4000-4400 cm-1 by using pellet KBr. The analyzed samples were before activation (as control variable) and after activation 8M (as optimum variation). From characterization by FTIR from fly ashes before activation and after activation by H2SO4 8 M
The journal homepage www.jpacr.ub.ac.id
ISSN : 2302 ‐ 4690
93 The spectra in the fly ash before activating contained absorption bands at wavelengths of 3413.71 cm-1 is the OH vibration, wavelength 2929.67, 2856.38 cm-1 is the CH stretching, the wavelength of 1417.58 cm-1 is the CN stretching. Absorption band changes occurred after fly ash activated with the loss of 8M H2SO4 absorption band at a wavelength of 2929.67
cm-1, 2856.38 cm-1 and 1417.58 cm-1 which is the group that lost to activation of impurities.
Characterization by SEM
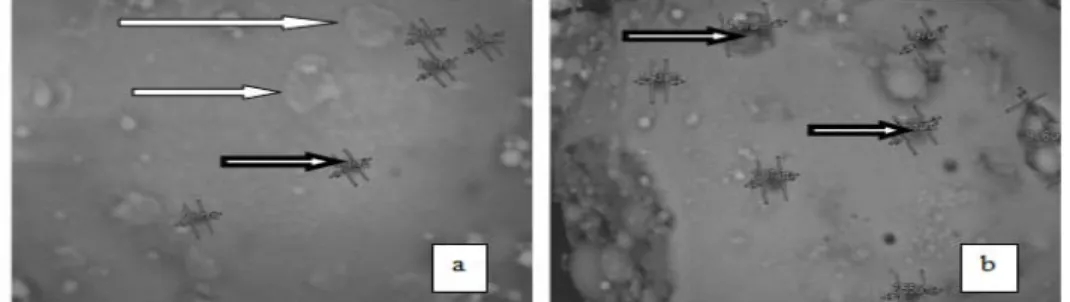
Surface morphology of fly ashes adsorbent before activation can be identified by SEM with object magnification of 6000 times that the results can be seen in the Figure 3.
Figure 3. Microgaph of SEM of fly ashes before activation (a) Microgaph
of SEM of fly ashes after activation (b) impurities on the surface of adsorbent, pore.
Figure 3(a), the difference in surface morphology of fly ash from fly ash before activation and after activation of H2SO4. In (a) visible pores fly ash still covered by impurities
and pore number less than the pore diameter and pore activated after 566 nm - 761 nm. In (b) visible surface of fly ash after activation of impurities is not covered and the amount of fly ash pore pore looks more and pore diameter is also larger than the pores of fly ash before activation (1,43 to 9,06 µm). According to research [9] that the fly ash activated with 8M H2SO4 has a specific surface area greater than the untreated fly ash activation is equal to
16.1306 m2 / g whereas fly ash without activation only 4.3461 m2/g.
Cation Exchange Capacity
Cation Exchange Capacity of the fly ashes is the quantity measure of the fly ashes to bind the ions that can be exchanged and depend on the active groupos amount per fly ashes weight. At the cation exchange capacity of inactivated fly ashes with activated fly ashes with H2SO4 8M can be seen in Table 2.
Table 2. The capacity data of cation exchange to the Fe2+ cation.
CEC (mek/100 g) Cation
Before activation After activation
Fe2+ 0.6432 17.0448
At the Table 2, it can be seen that the cation exchange capacity of the fly ashes that is activated by H2SO4 is stronger than the non activated fly ashes. It is because able to increase
the ion H+ amount into the fly ashes structure then the higher metal cation amount in the fly ashes that are replaced by ion H+ so the fly ashes that have active groups that easily to release
The journal homepage www.jpacr.ub.ac.id
ISSN : 2302 ‐ 4690
94 the proton. The metal ion exchange event at the fly ashes with the hydrogen ions is showed in the Figure 1.
The influence of adsorbent mass to the Fe adsorption
The result of treatment for adsorbent mass influence to the adsorption mass is presented in Figure 4. It can be observed that the adsorption mass of Fe increase up to the use of adsorbent 2.5 g. At the situation, the use of adsorbent mass is higher and do not increase the adsorption mass because the equilibrium of adsorption has been reached. After the adsorption equilibrium is reached, then the desorption rate become more dominant than adsorption rate, so the bound Fe to the fly ashes surface will be released again in the solution. The adsorption equilibrium is occurred when the adsorption rate equal with the desorption rate [14]. The phenomenon causes the adsorbed mass of Fe decrease as can be seen in figure 5 by using adsorbent mass 2.4-4.0 g. The optimum condition of adsorption is reached at the adsorbent mass usage of 2.5 g with adsorbed mass value of 0.72 so the research is using adsorbent mass of 2.5 g.
Figure 4. Curve of the adsorbent mass
influence to the adsorption mass.
Figure 5. The influence of contact time to the
% adsorption
The influence of contact time to the Fe adsorption
The determination of contact time aimed at knowing how long the time is needed by adsorbent to adsorp the Fe maximally up to the equilibrium. The investigation of the contact time is done by batch method a with contact time of 15, 30, 45, 60, 75, 90, and 105 minutes. The research was done at the adsorbate concentration of 20 ppm with optimum adsorbent mass of 2.5 g, with the stirring speed of 100 rpm.
The influence of contact time is done because the contact time showed able to influence the adsorption equilibrium. The contact time is able to influence the attractive interaction between adsorbent and adsorbate such Van Der Waals force and electrostatic force [15]. The relation between the contact time and the Fe adsorption percentage by fly ashes of coal can be seen in Figure 5. At contact time 15 to 60 minute, there is adsorption percentage increase because of the longer contact time cause the interaction between fly ash with the Fe become greater, the more Fe be adsorbed by the fly ashes. The decrease of adsorbed Fe percentage occurred at the minute 60 to 105 because of the concentration differences of Fe that is adsorbed at the fly ashes surface greater than the remain Fe in the solution cause the bound Fe will be re-desorbed into the solution. The optimum contact time
The journal homepage www.jpacr.ub.ac.id
ISSN : 2302 ‐ 4690
95 is occurred at the minute 60 with the adsorption percentage of 70.34% so the next research will use 60 minutes.
The influence of solution pH to the Fe adsorption
The determination of pH influence to Fe synthesis is done by using fly ashes adsorbent with optimum mass of 2.5g, contact time of 60 minutes, pH = 4 and stirring speed of 100 rpm. The pH investigation was done by batch system at pH variation of 2, 3, 4, 5, 6, 7 and 8. The relation between pH of Fe solution with the adsorbed Fe percentage by fly ashes is shown in Figure 6. There is an increase of adsorption percentage from pH 2 to 4. It is possibly caused by the Fe ion adsorption is dominated by electrostatic interaction or ion exchange with ion H+ at the adsorbent active groups.
Figure 6.
The curve of pH influence to the % adsorption
Ion H+ at the hydroxide form will run down and easy to release, and it causes the Fe bound and adsorbed strongly to the adsorbent [16].
Figure 7. Ion exchange reactions between Fe2+ with H+
At pH 5 to pH 8 showed the decrease of adsorption percentage. It is expected because of the metal ion washydrolysed at the pH > 6 then will cause the decrease of electrostatic force. While the decrease of electrostatic force will decrease the adsorption force. At the alkali pH will occur the decrease of adsorption, it is expected because the deposit Fe as the Fe hydroxide with the pass over of smallest value of Ksp Fe (OH)2 of 2.10-16. The optimum
condition of adsorption is reached at the pH 4 with adsorption percentage value of 95.73%.
The influence of adsorbate concentration to the Fe adsorption
The results of study the adsorbate concentration influence is presented in the Figure 8. It imply that the amount of adsorbed Fe increase along with the increasing Fe from 10 to 20 ppm. It is caused by the shift of adsorbate from solution phase to the adsorbent surface occurred continuously. When the concentration ranges between 20 and 50 ppm, the decrease of adsorption percentage is observed. It is possibly occurs the adsorption in equilibrium consition. In the equilibrium, the adsorption rate proportional to the desorption rate [14].
The journal homepage www.jpacr.ub.ac.id
ISSN : 2302 ‐ 4690
96 After attainment of the equilibrium condition, applying of higher concentration can decrease the adsorbed Fe. It is caused by the concentration addition at the solution phase cause the saturation of Fe ion quantity.
Figure 8. The curve of concentration
variation to the % Fe adsorption.
Figure 9. Isotherm graphic of Freundlich
adsorption
The increasing density causes the anion distance become shorter. So there is rejection force among ions. The rejection force of Fe that is not bound strongly to the adsorbent surface and it will be released easily. The adsorbed Fe by fly ashes will be desorbed again. The optimum condition of adsorption is attained at the adsorbate concentration of 20 ppm with adsorbed Fe amount of 94.41%. The determination of occurred interaction between adsorbent with adsorbate is determined by Langmuir and Freudlich model that is presented in the Figure 9 and 10.
Figure 10. Isotherm
graphic of Langmuir adsorption
Based on the comparison of the two modeling linearity of the adsorption is more in line with the modeling described by Freundlich. The Freundlich heterogeneity factor (n) of 1.183 mg/g, Freundlich constants of 0.264 L/mg. Freundlich constants indicate affinity adsorbent with adsorbate, ie how strong the interaction between the adsorbent with adsorbate. Freundlich adsorption is the adsorption because of interaction physically that occurred between adsorbate with the adsorbent surface. When the adsorbent surface is covered by adsorbate, the non-adsorbed adsorbate in upper/single layer of the adsorbent surface, and also it covers in the second layer and etc. So, it will produce multi layers.
Experiment with ground water samples
After the optimum condition was obtained, from Fe adsorption at the synthetic solution, The evaluation was undertaken using actual sample (ground water). It used a sample from
The journal homepage www.jpacr.ub.ac.id
ISSN : 2302 ‐ 4690
97 Balikpapan, at Kelurahan Lamaru. The sample was collected from area in the Figure 11. The sample of ground water was taken from four locations in Kelurahan Lamaru (red lines).
Figure 11. Location of ground water collection
Four locations was chosen where the waste firstly observed and the Fe concentration was analysed using AAS. The result was presented in Table 3.
Table 3. The content of Fe before adsorption and after adsorption on various locations
Location Fe (ppm) before
adsorption
Fe (ppm) after
adsorption % Adsorption
Lat:1o11’25.64”S
Lon:116o59’37.49”T 1.9718 0.1983 89.94
Lat:1o11’24.49”S
Lon:116o59’38.17”T 2.1237 0.2463 88.40
Lat:1o11’28.00”S
Lon:116o59’39.92”T 2.5305 0.3124 87.65
Lat:1o11’28.16”S
Lon:116o59’38.46”T 2.4045 0.2833 88.22
The fly ashes as adsorbent in the optimum conditions, that is 2.5 g, contact time 60 minutes, and stirring speed 100 rpm is able to adsorb Fe from ground water sample in 88.55%.
CONCLUSION
Optimum condition of Fe adsorption at the adsorbent mass developed from fly ash of 2.5 g, contact time 60 min, pH 4, and adsorbate concentration 20 ppm. The adsorption of Fe on the developed adsorbent following the Freundlich model and than Langmuir models. The adsorption of Fe from groundwater samples collected from Kalimantan give an average 88.55 adsorption percentage.
REFERENCES
[1]. Muchtar Aziz, Jurnal Teknologi Mineral dan Batubara, 2006, 36 (14), 1-8.
[2]. Mattigold S.V., C.C. Ainsworth, L.E. Eary and D. Rai, J. Environ., 1990, 1918, 198-201.
The journal homepage www.jpacr.ub.ac.id
ISSN : 2302 ‐ 4690
98 [3]. Widihati, I.A.Gede, Adsorpsi Anion Cr(VI) oleh Batu Pasir Teraktivasi Asam dan
Tersalut Fe2O3, Jurnal Kimia II. Bukit Jimbaran: 2008, Jurusan Kimia FMIPA
Universitas Udayana.
[4]. Reri Afrianita, Pemanfaatan fly ash batubara sebagai adsorben dalam penyisihan chemical oxygen demand (COD) dari limbah cair domestic, 2010, Jurusan teknik Lingkungan Universitas Andalas.
[5]. Gatima, Chien Jung Lien., Assessment of pulverized fly ash as an ameliorant of lead contaminated soils, Journal School of Biological Sciences, Plant and Soil Science,
2005, University of Aberden.
[6]. Danielyn, Analisa kualitas air bersih di Balikpapan, 2009, Balikpapan.
[7]. Chien Jung, L., Juu-En, Ch. and Ming-Chun, L, Application of fly ashes in the removal of metal ions from wastewater. Paper presented at the R’99 Congress (recovery, recycling, Re-integration),1999, World Congress, Geneva.
[8]. Papandreou, A, C.J Stournaras, D. Panias, J. Hazard. Mater., 2007, 148, 538-547. [9]. Dede Fajar I., Aktivasi Abu Layang Batubara dengan H2SO4 sebagai Adsorben Ion
Logam Pb(II) dan Zn (II), Jurusan Kimia, Fakultas MIPA, 2010, Universitas Negeri Semarang.
[10]. Siska Y, Pengaruh Aktivasi Asam pada Zeolit Alam Turen terhadap Kapasitas Tukar Kation Ni2+, Co2+, Mn2+ dan Fe3+ , Jurusan Kimia, Fakultas MIPA, 2008, Universitas Brawijaya Malang.
[11]. Nicolette Rebecca H., The Application of High Capacity Ion Exchange Adsorbent Material, Synthesized from Fly Ash and Acid Mine Drainage for The Removal of Heavy and Trace Metals from Secondary Co-disposed Process Waters, 2005, University of Western Cape.
[12]. Lathif Rizal, Penggunaan fly ash batubara untuk mengadsorpsi malasit hijau, Jurusan MIPA, 2003, Pasca sarjana UIN Malang.
[13]. Vaughan, D, Crystal Engineering: The Design and Application of Functional Solid,
1999, Kluwer Academic Publishers, Netherlands, pp. 451–472.
[14]. Castelan, G.W., Physical Chemistry, 1983, London: Addison Wesley Publishing Company.
[15]. El-latif, M.M.A., Amal M. Ibrahim, M.F. El-Kady, J. Am. Sci., 2010, 6, 1-6.
[16]. Shim, Young-Sook, Young-Keun Kim, Sung-Ho Kong, Seung-Whee Rhee, and Woo-Keun Lee. Waste Manage., 2003, 23 (9), 851-857.