The journal homepage www.jpacr.ub.ac.id p-ISSN : 2302 – 4690 | e-ISSN : 2541 – 0733
Estimation of ketorolactromithamine in Phamaceutical samples
and biofluids by the new validated UPLC method
Mohammad Nasir Uddin1*, Monir Uddin1, Md. Touhid Kabir1, Suman Das2 1Department of Chemistry, University of Chittagong, Chittagong-4331, Bangladesh.
2BCSIR Laboratories, Chittagong, Bangladesh.
*Corresponding author: [email protected]
Received 19 January 2017; Accepted 27 April 2017 ABSTRACT
A new UPLC method has been described to determine ketorolac tromethamine in pharmaceutical samples and biofluids. Drug was eluted using a reversed-phase Gemini 3U, C18, 110R (150 × 4.6 mm, 3 μm) column when a mobile phase composition 90:05:05 (v/v) consisting CH3OH, CH3CN and NaH2PO4 under isocratic program. Ketorolac tromethamine was eluted at a short of time 2.02 min. Ketorolac tromethamine isolated from biofluids after liquid-phase extraction. The results were linear up to 10 µg mL-1 with the correlation coefficients greater than 0.999. The sensitivity limits, LOD and LOQ were 0.016 and 0.051 µg mL-1, respectively. The method is simple, fast and reliable with good specificity and sensitivity and will be suitable for routine analysis of ketorolac tromethamine.
Keywords : Ketorolac tromethamine, pharmaceutical samples and biofluids, UPLC method
INTRODUCTION
Ketorolac tromethamine (Figure 1) is a highly potent member of non-steroidal anti-inflammatory drug (NSAID) in the family of heterocyclic acetic acid derivatives, used as an analgesic. The compound shows potent prostaglandin cyclooxygenase inhibitory activity. Ketorolac, when administered intramuscularly or orally, is a safe and effective analgesic agent for the short-term management of acute postoperative pain and can be used as an alternative to opioid therapy [1]. It has been investigated extensively for use in postoperative analgesia both as a sole agent and supplement opioid analgesics and excellent applicability in the emergency treatment of postoperative cancer pain and in the treatment of migraine pain [2].Frequent dosing is necessary to sustain the action of drug to alleviate pain in postoperative patients with a possibility of patient noncompliance. An ophthalmic solution of ketorolac is available and is used to treat eye pain and to relieve the itchiness and burning of seasonal allergies. Ketorolac is indicated for short-term management of moderate to severe pain. Concerns about the high incidence of reported side effects led to restriction in its dosage and maximum duration of use. The primary mechanism of action responsible for ketorolac's anti-inflammatory, antipyretic and analgesic effects is the inhibition of prostaglandin synthesis by competitive blocking of the enzyme cyclooxygenase (COX) [3,4]. Allergic reactions have been reported. Fluid retention and edema have been reported with the use of ketorolac and it should therefore be used with caution in patients with cardiac decompensation, hypertension or similar conditions. Ketorolac is not recommended for
pre-operative analgesia or co-administration with anesthesia because it inhibits platelet aggregation and thus may be associated with an increased risk of bleeding[5,6]. Ketorolac is not recommended for long-term chronic pain patients. However, ketorolac has been co-administered with meperidine and morphine without apparent adverse effects on patients. As with all NSAIDs, ketorolac should be avoided in patients with renal (kidney) disfunction. The patients at highest risk, especially in the elderly, are those with fluid imbalances or with compromised renal function e.g., heart failure, diuretic use, cirrhosis, dehydration, and renal insufficiency.
Figure 1. Structural formulae for ketorolactromethamine (MW=376.4)
Ketorolac causes serious side effects including heart attack, stroke, high blood pressure, heart failure from swelling (fluid retention), kidney problems including kidney failure, bleeding and ulcers in the stomach and intestine, low red blood cells (anemia), life-threatening skin reactions, liver problems including liver failure, asthma attacks in people who have asthma [7,8]. Other side effects are stomach pain, constipation, diarrhea, gas, heartburn, nausea, vomiting, and dizziness. Since this drug is widely seen in clinical cases, the measurement in samples continues to be of concern and investigation.
In this regard a single, rapid, reliable method with high precision is immense important for the analysis of ketorolac. Though several chromatographic methods have been developed for the determination of KTR by means of HPLC/UV [2, 9-15] or HPLC-MS [16]; some of these methods have a limit of quantification (LOQ) that is too high, some require length analysis times or long time for treatment sample. However, GC-MS [17] or LC-MS/MS [16] is a promising tool for analysis of drugs but suffers from a major limitation of involvement of tedious, time consuming and expensive instrumentation. There has been much emphasis recently, on reducing analysis time and solvent consumption in HPLC. The advances in column technology and the introduction of a number of commercially available ultrahigh performance liquid (UPLC) chromatographs, has permitted this reduction. This improvement in speed and sensitivity is useful in all areas of the pharmaceutical process. Therefore, the objectives of the research are to develop a simple and sensitive UPLC method for the estimation of ketorolactromethamine in pharmaceutical formulation and biofluids after optimized liquid-liquid extraction.
EXPERIMENT
Materials and Methods Instruments
A Shimadzu (Tokyo, Japan) binary low-pressure gradient system was used for the chromatographic determination of the examined analyte. The solvent lines were mixed in an FCV-20AH2 mixer. Two Nexera LC-30AD pumps equipped with a Prominence CBM-20A communication bus module, permitting fully automated operation, was used to deliver the mobile phase to the analytical column. Sample injection was performed via a Nexera SIL-30AC auto-sampler. Detection was achieved by an SPD-M20A Photodiode Array Detector, complied with Data acquisition software Lab Solutions-Nexera PDA by Shimadzu.
Chemicals
HPLC-grade methanol was supplied by SIGMA-ALDRICH (Germany), ACN was supplied by Scharlau (Scharlab S. L., Spain) and sodium dihydrogen phosphate was supplied by Applichem GmbH (Germany). Water used throughout the study was purified by the reverse osmosis method to gain high-purity water with a Milli-Q water purification system from Millipore (Millipore, Bedford, MA, USA). Purity of reference compounds was not less than 98%. Pharmaceutical formulations commercially available in Bangladesh were analysed to check the applicability of the method.
Preparation of standard
Stock solutions of the anions (1000 mg L−1) were prepared by dissolving an appropriate
amount of KTR in a volumetric flask and diluting to the mark with water. Experimental solutions were prepared by appropriate dilution of the stock solutions.
Sample Preparation Pharmaceutical Samples
Twenty tablets or the content were finely ground and powdered. An accurately weighed
portion equivalent to 100 µg mL-1 solution for each compound, was transferred to volumetric
flask, dissolved and diluted up to the mark with ethanol. The solution was sonicated for 15 min and centrifuged at 3000 rpm for 10 min, and filtered through a 0.22 μm PTFE syringe filter with Whatman filter paper. An aliquot portion was transferred to volumetric flask,
diluted with ethanol as to provide a stock solution of 100 µg mL-1. All stock solutions were
stored at 4oC in refrigerator. Dilution has been made to accurately measured aliquots of the
stock solution with ethanol to give working concentrations of the analyte. Blood samples
0.5 mL upper layer of the blood were taken in three vial, 0.5 mL acetonitrile were added into three vial ,for blank solution 1 mL ethanol were added into a vial and 1 mL of 1
µg mL-1 & 3 µg mL-1 standard solution were added into remaining two vial. The solution was
sonicated for 15 min and centrifuged at 3000 rpm for 10 min, and filtered through a 0.22 μm
PTFE syringe filter with Whatman filter paper. All solutions were stored at 4oC in
refrigerator. Urine Samples
1 mL of Urine were taken in three vial ,for blank solution 1 mL ethanol were added into
a vial and 1 mL of 1 µg mL-1 & 3 µg mL-1 standard solution were added into remaining two
vial. The solution was sonicated for 15 min and centrifuged at 3000 rpm for 10 min, and filtered through a 0.22 μm PTFE syringe filter with Whatman filter paper. All solutions were
stored at 4oC in refrigerator.
Chromatographic conditions
A standard solution at concentration level 5 μg mL-1 was used for the optimization
procedure. Reversed-phase Gemini 3U, C18, 110R (150 × 4.6 mm, 3 μm) column was used. Special attention was given on optimization of the mobile phase composition to obtain satisfactory results at reduced elution time and tailing problems. Several solvent gradients were performed to determine the optimum one to detectable peaks with high intensity in the chromatogram at considerable analysis time. Different composition of mobile phase
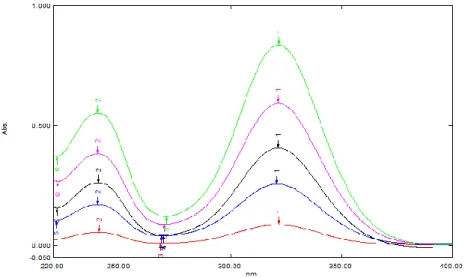
optimized conditions at a flow rate of 0.20 mL/min at ambient temperature. An UV scan of standard solution was done for the spectra of studied drugs in the range of 250 to 400 nm to detect the absorption maxima Figure 2. The best flow rate was investigated with respect to sharpness and symmetry of the peaks. The injection volume was 10 μL. Prior to the analysis the column was equilibrated with mobile phase. The dihydrogen sodium phosphate solution was filtered in vacuum using 0.2 µm membrane, and the mobile phase was degassed prior to use by a stream of helium.
Figure 2. Electronic spectra of ketorolac standard solution in the used mobile phase Preparation of calibration curve
Calibration curves were prepared for five concentration levels of the analyte ranging
from 1.0-10.0 µg mL-1 when peak area was plotted against theoretical concentrations. Curve
was fitted by a least squares linear regression to the equation, y = mx + c. Where, y = response ratio, m = slope, x=concentration of analyte and c = intercept. Calibration equation so obtained was used to find the unknown concentration of the analyte.
Validation Parameters
Validation parameters ; precision, accuracy, specificity, limit of detection, limit of quantitation, linearity and range, suitability and robustness as recommended by the ICH [18] were investigated for checking the analytical performance of the method.
RESULTS AND DISCUSSION Chromatography
The chromatographic conditions optimized were composition of the solvents, and mobile phase flow rate. Mobile phase it must elute all the different substances with satisfactory peak shape and in a short time. Initial experiments with the LC system using methanol or acetonitrile as organic modifier in the buffered mobile phase were performed for better separation of analytes. The combination of methanol with 5mM dihydrogen sodium phosphate served our intentions best. Reversed-phase Gemini 3U, C18, 110R (150 × 4.6 mm,
3 μm) column and 5 mM NaH2PO4 as buffer solution all through the experiment were used
for the determination of ketorolac. In particular, peak tailing observed was considerable. In order to determine the detection wavelength, the absorption spectra of Ketorolac were obtained. The absorption spectra of ketorolac showed absorption bands in the UV region with
maximum absorption wavelengths ranged between 270 and 360 nm. Therefore, 310 nm selected for monitoring as compromised to the drug. To determine the optimum mobile phase flow-rate under optimized composition the effect on Rt, peak height and peak width was studied. As expected when the mobile-phase rate was increased Rt decreased. A
flow-rate of 1 mL min-1 was chosen as a compromise analysis time, because this value also
maintains good peak shape. The mobile phase mixture of CH3OH, CH3CN and 5mM
NaH2PO4 by the composition of 90:05:05 (v/v) was optimized at isocratic program (Table 1).
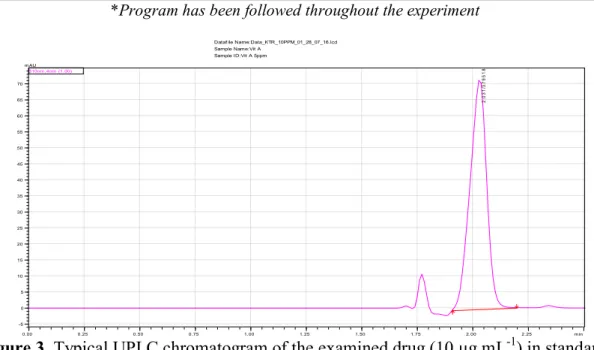
The method was carried out for the detection and quantitation of the drug representing total elution time less than 2 min (2.03±0.005 minutes). A representative chromatogram as shown in figure 3 was obtained from a standard solution under optimized conditions. No interfering of peaks was observed in the samples studied. Precision of retention times was examined to evaluate system suitability from within-day repeatability (mean value of six measurements, n = 18) and between-day precision (mean value of three measurements during six days, n = 54)
at 1, 2, 3, 4, 5 and 10 μg mL-1 level of drugs, which revealed RSD values of 2.57%.
Table 1. Optimum isocratic program for the proposed method
Program Time
Min
Solvent composition Flow rate
mL/min
R. time (min)
CH3CN CH3OH 5mM
NaH2PO4
A* 0.01-3.0 05 90 05 1.0 2.03±0.005
A 0.01-3.0 06 88 06 0.9 2.13±0.005
*Program has been followed throughout the experiment
Figure 3. Typical UPLC chromatogram of the examined drug (10 μg mL-1) in standard.
Chromatographic conditions are described in text. Peaks: 2.031 min (KTR).
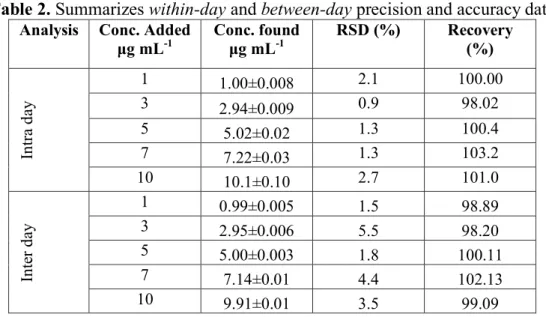
The validated method developed herein was applied to various concentrations taken from the pharmaceutical products for determining the content of investigated drugs. Table 2 summarizes within-day and between-day precision and accuracy data, indicating that these values are acceptable and the method is accurate and precise. Analytical data of system suitability and robustness are placed in Table 3. Table 4 also shows the column efficiency data as the validation evidences. Table 5 presents the analytical values on pharmaceutical formulations. Determination of ketorolac in blood and urine sample by the proposed method has been given in Table 6.
Dataf ile Name:Data_KTR_10PPM_01_28_07_16.lcd Sample Name:Vit A
Sample ID:Vit A 5ppm
0.00 0.25 0.50 0.75 1.00 1.25 1.50 1.75 2.00 2.25 min
-5 0 5 10 15 20 25 30 35 40 45 50 55 60 65 70 mAU
310nm,4nm (1.00)
2
.0
3
1
/3
7
9
5
1
Method Validation
The described UPLC method was developed using a simple mobile phase to provide a rapid quality control determination of both drugs in standard and pharmaceutical formulations. The parameters linearity, selectivity, extraction recovery, precision, accuracy, stability and robustness were studied for the validation of the method
Linearity
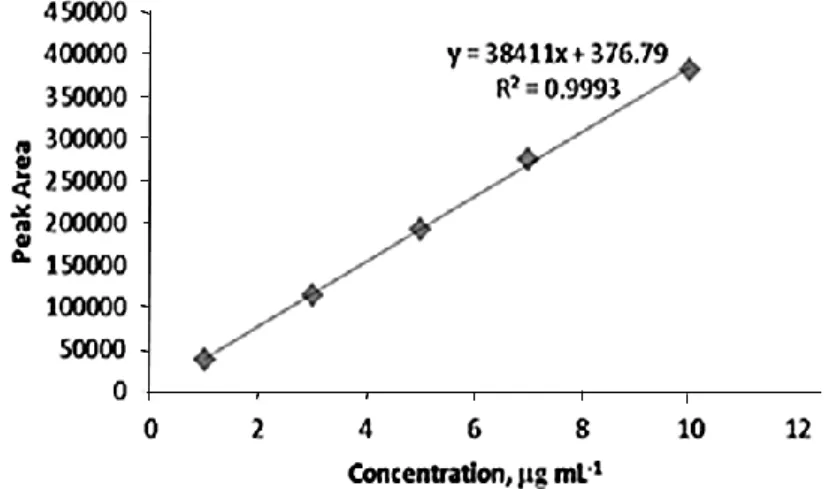
The calibration curves constructed for standard using working concentration at levels
1.0, 3.0, 5.0, 7.0, 10.0 μg mL-1 of ketorolac. Calibration curves were constructed using peak
area of drug versus nominal concentrations of the analyte. Calibration equations are y=38411x+376.79 for KTR determination. The calibration curves were linear in the range of
01-10 μg mL-1 for KTR. The coefficients of determination (r2) were 0.9999 for the drug.
Figure 4 show the calibration curve for the determination of ketorolac.
Figure 4. Calibration curve for the determination of ketorolac Sensitivity
The limit of detection were calculated from calibration graph by the formula; LOD=3•Sxy/a, and the limit of quantification; LOQ=10•Sxy/a. The LOD and LOQ were
found to be 0.016 and 0.051 μg mL-1, respectively. These results indicate that method is
sensitive enough for therapeutic assay. Recovery/Accuracy
The results of recovery studies obtained from the within-day assay at Five
concentrations (n=5) by the proposed method was 98.02-103.2% and between-day assay at
six different days was 98.20-102.13% indicated high Accuracy of the drug. Within-day and
Table 2. Summarizes within-day and between-day precision and accuracy data
Analysis Conc. Added
μg mL-1 Conc. found μg mL-1 RSD (%) Recovery (%)
In
tr
a
da
y
1 1.00±0.008 2.1 100.00
3 2.94±0.009 0.9 98.02
5 5.02±0.02 1.3 100.4
7 7.22±0.03 1.3 103.2
10 10.1±0.10 2.7 101.0
In
te
r
da
y
1 0.99±0.005 1.5 98.89
3 2.95±0.006 5.5 98.20
5 5.00±0.003 1.8 100.11
7 7.14±0.01 4.4 102.13
10 9.91±0.01 3.5 99.09
Precision
The relative standard deviations (RSD) obtained for the within-dayassay at five concentrations (n=5) in the range 0.9-2.7% for KTR and for Between-day assay the corresponding values in the range 1.5-5.5% for KTR indicating the high precision of the method. Within-day and between-day precision data for proposed method are presented in Table 2.
Specificity/Selectivity
The specificity was demonstrated showing that drug was determined free of interference from potential impurities and degradation products by the absence of any peak in the same retention times.The selectivity of the method was checked by injecting ketorolac tromethamine standard solution, background control sample. There was no interference at retention time of ketorolac due to back ground control sample.
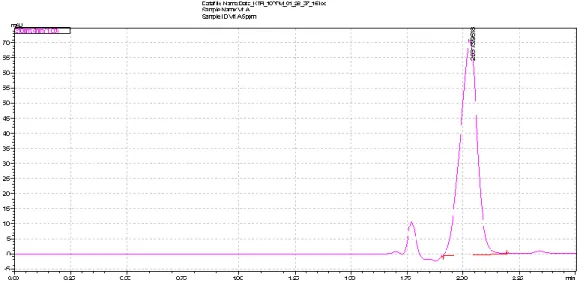
Peak purity of ketorolac peak was passed in standard. From the chromatogram shown in Figure 5, it is evident that under the chosen chromatographic conditions KTR (Tr=2.031 min) the UPLC method did not suffer interference by the formulation excipients, since there was not another peaks on the retention times of KTR. Results indicate the high specificity of the method and can be used in a stability assay and routine analysis of the investigated drug.
Figure 5. Typical UPLC chromatogram of the examined drug (10 μg mL-1) in pharmaceutical formulation. Chromatographic conditions are described in text. Peaks: 2.031 min (KTR). Robustness
It was found that the percent recoveries were excellent under most conditions, and remained unaffected by small deliberate changes of experimental parameters including the flow rate and isocratic program (Table 1) though retention time and resolution was shortened as expected. There was no noticeable difference between the chromatograms when the wavelength was varied by ±3 nm. Variation in the experimental parameters (flow rate, isocratic program) provided an indication of its reliability during normal use and concluded that the method was robust as shown in Table 3.
System Suitability
A system suitability test was an integral part of the method development to verify that the system is adequate for the analysis of KTR to be performed. The system suitability was
assessed by replicate injections (n=5) of the sample at 5 µg mL-1 concentration level
including within- and between-day assessments for standard. Precision of retention time and peak area was examined to evaluate the system suitability. RSD of the peak area 0.63% and that of retention time 0.85% indicates excellent suitability of the system as shown in Table 3.
Table 3. Validation parameters in terms of suitability and robustness Conc.
(5 µg mL-1) Suitability Robustness R (%)
R.T. (n=5) Area(n=5)
Average 2.031±0.005 516845±0.03 99.75
RSD (%) 0.85 0.63 1.25
Stability
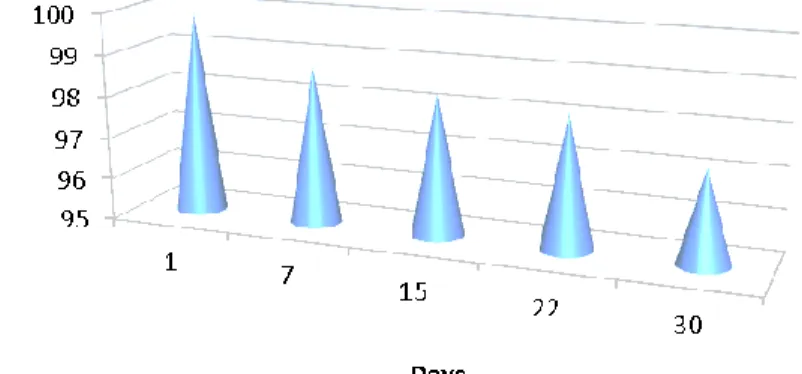
The stability of KTR in methanol, stored in clear glassware in the fridge (4ºC) was tested at five intervals by the 30 days. The responses from the aged solutions were compared with those from freshly prepared standard solution. The results showed that the retention time and peak area of KTR remained almost unchanged and no significant degradation within the indicated period occurred. Recovery of the compound was ≥ 99 % up to one month at 4°C stored sample as shown in figure 6 though it showed gradual decrease. Results conclude that there was no degradation product and the drug is stable at 4°C for at least 30 days, indicating
the possibility of using the samples over a period of 30 days at refrigerator without degradation. This indicates good stability.
Figure 6. Long term stability graph for ketorolac Column Efficiency
The column efficiency parameters have been calculated for a representative chromatogram. This test is essential for the assurance of the quality performance of a chromatographic system. The calculated values ; retention factor, k = 0.733±0.03, theoretical plate number, 763±5, and tailing factor, Tf = 1.36±0.01 shown in Table 4 revealed the excellent performance of analytical column.
Table 4. Validation parameters in term of column efficiency
Efficiency NTP HETP T. F C.F, k´
Average 763±5 203±1.4 1.36±0.01 0.733±0.03
RSD (%) 0.69 0.72 0.37 0.37
Degradation kinetics
Rate constant of degradation can be determined by plotting log(a-x) after definite time interval, t (days) when a straight line with negative slope is obtained (Figure 7) indicating that
degradation followed first order kinetics having the rate constant, k value of 0.0003 day-1.
Where, ‘a’ is the initial concentration and ‘x’ is the degraded concentration after definite time interval.
Applications
Application to Pharmaceutical formulation
The method developed here was applied to various concentrations (3.0, 5.0 µg mL-1) of
solutions prepared from pharmaceutical products for determining the content of KTR.
Typical UPLC chromatogram of the examined drug (5 μg mL-1) in formulation is given in
Figure 6. Typical UPLC chromatogram of the examined Blood sample with (3 μg mL-1
KTR) is given in Figure 8. Typical UPLC chromatogram of the examined Urine sample with
(3 μg mL-1 KTR) is given in Figure 9. The values of the overall drug percentage recoveries
and the RSD values of measurements are as presented in Table 5. Determination was free of interference from degradation products and no interference from the sample excipients could be observed at this detection wavelength, indicating the high specificity of the method. Results indicate that measurements are acceptable with good precision. Recovery was almost same as that of leveled values for four tested samples. Some contain excessive large amount and some contain lower than labeled values. It is may be due to lack of proper quality management.
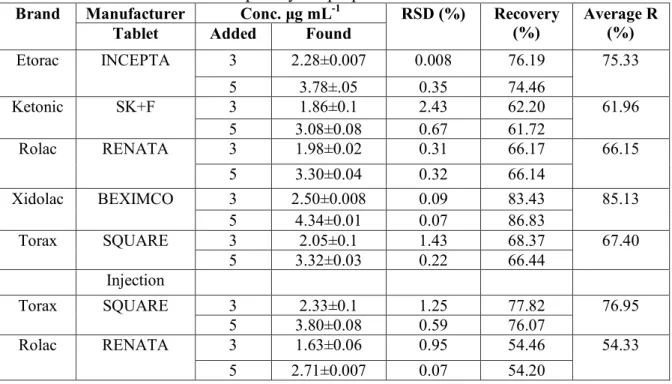
Table 5. Determination of ketorolac in pharmaceutical formulation, blood sample and urine samples by the proposed method
Brand Manufacturer Conc. μg mL-1 RSD (%) Recovery
(%)
Average R (%)
Tablet Added Found
Etorac INCEPTA 3 2.28±0.007 0.008 76.19 75.33
5 3.78±.05 0.35 74.46
Ketonic SK+F 3 1.86±0.1 2.43 62.20 61.96
5 3.08±0.08 0.67 61.72
Rolac RENATA 3 1.98±0.02 0.31 66.17 66.15
5 3.30±0.04 0.32 66.14
Xidolac BEXIMCO 3 2.50±0.008 0.09 83.43 85.13
5 4.34±0.01 0.07 86.83
Torax SQUARE 3 2.05±0.1 1.43 68.37 67.40
5 3.32±0.03 0.22 66.44
Injection
Torax SQUARE 3 2.33±0.1 1.25 77.82 76.95
5 3.80±0.08 0.59 76.07
Rolac RENATA 3 1.63±0.06 0.95 54.46 54.33
5 2.71±0.007 0.07 54.20
Application to Bio-samples
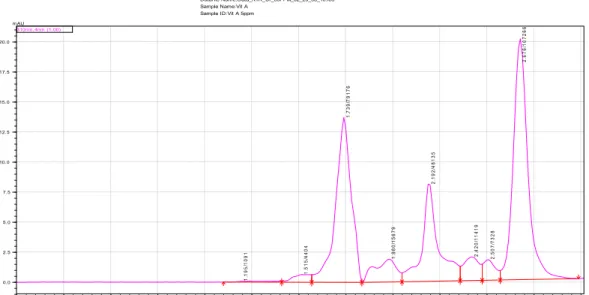
The absence of any endogenous interfering peak observed (Figure 8, 9) in the extracts of bio-fluids overlapping with any analyte indicates the high specificity of the method which can be used in therapeutic and routine analyses. Data of the determination of KTR in biological sample by the proposed method has been given in Table 6.
Table 6. Determination of ketorolac in blood and urine sample by the proposed method
Samples Drug Name
(Injection)
Conc.μg mL-1 RSD
(%)
Recovery (%)
Spiked Found Biofluids
Blood Rolac 0.00 0.94±0.03 0.94 3.01 ---
1.00 1.95±0.06 0.95 1.71 108.43
3.00 3.94±0.02 0.94 4.99 99.97
Urine Rolac 0.00 0.54±0.02 0.54 1.95 ---
1.00 1.51±0.03 0.51 1.00 93.10
3.00 3.52±0.02 0.52 1.64 95.28
Figure 8. Typical UPLC chromatogram of the examined blood sample spiked with 3 μg mL-1
KTR, Peaks: 2.178 min
Figure 9. Typical UPLC chromatogram of the examined urine sample spiked with3 μg mL
-1KTR, Peak: 2.192 min
Dataf ile Name:Data_KTR_BD_03PPM_01_23_08_16.lcd Sample Name:Vit A
Sample ID:Vit A 5ppm
0.00 0.25 0.50 0.75 1.00 1.25 1.50 1.75 2.00 2.25 2.50 2.75 min
-0.50 -0.25 0.00 0.25 0.50 0.75 1.00 1.25 1.50 1.75 2.00 2.25 mAU 310nm,4nm (1.00) 1 .0 6 2 /2 8 2 1 1 .7 1 7 /8 0 3 1 1 .8 7 2 /8 0 6 7 2 .1 7 8 /4 7 4 7
Dataf ile Name:Data_KTR_Ur_03PPM_02_23_08_16.lcd Sample Name:Vit A
Sample ID:Vit A 5ppm
0.00 0.25 0.50 0.75 1.00 1.25 1.50 1.75 2.00 2.25 2.50 2.75 min
0.0 2.5 5.0 7.5 10.0 12.5 15.0 17.5 20.0 mAU 310nm,4nm (1.00) 1 .1 9 5 /1 0 9 1 1 .5 1 5 /4 4 0 4 1 .7 3 9 /7 9 1 7 6 1 .9 8 0 /1 5 6 7 9 2 .1 9 2 /4 8 1 3 5 2 .4 2 0 /1 1 4 1 9 2 .5 0 7 /7 3 2 8 2 .6 7 6 /1 0 7 2 6 6
CONCLUSION
For the determination of KTR in biofluids, UPLC method presented herein meets the criteria for routine therapeutic drug monitoring or pharmacokinetic studies. The advantage of the method over previously reported methods is the rapidity, simplicity (ease of sample preparation), high sensitivity, and high selectivity. The LOD and LOQ achieved make the assay appropriate for the measurement of therapeutic concentrations. Stability studies showed that the samples can be stored without degradation for a period of up to 7 days. Furthermore the lower solvent consumption along with the significantly reduced run time leads to an environmentally friendly economically analytical procedure that allows for the analysis of a large number of samples over a short period of time.
REFERENCES
[1] Rang H, Dale M, Ritter J and Flower R, Pharmacology, 6th Ed., Churchill Livingstone,
Elsevier, 2007, 227-230.
[2] Wang Z, Dsida R., and Avram M. J., J. Chromatogr. B, 2001, 755(1-2), 383-386.
[3] Warner T. D., Mitchell J. A., FASEB J, 2004, 18, 790-804.
[4] Galán-Herrera J. F., Poo J. L., Maya-Barrios J. A., de Lago A., Oliva M. S. I., . Mario
González-de la P., Patricia J., Ericka L., Victoria B., Salvador N., Clin Ther, 2008, 30,
1667-1674.
[5] Dave, J. B., P. J. Vyas, C. N. Patel, Chron. Young Sci., 2013, 4(1), 24-31.
[6] Martindale, The Complete Drug Reference, 35th Edition, 2004, London, Pharmaceutical
Press.
[7] Committee on the Safety of Medicines and Medicines Control Agency, Curr. Prob.
Pharmacovigilance, 1993, 19, 5-8.
[8] Strom BL, Berlin JA, Kinman JL, Spitz PW, Hennessy S, Feldman H, Kimmel S,
Carson L, JAMA, 1996, 275, 376-82.
[9] R Singh, APathak, P Chawla, Indian J. Pharm. Biol. Res., 2013, 1(4), 95-101.
[10] Bhagyashree R. D., K. P. Bhusari, M. R. Tajne, M. H. Ghante, N. S. Jain, Indo
American Journal of Pharm Research., 2014, 4(7), 3248-3257.
[11] Razzaq S. N., Khan I. U., Quim. Nova., 2012, 35(6), 1216-1221.
[12] Jayant B. Dave, Pratik J. Vyas, Chhagan N. Patel, Chron. Young Sci., 2013, 4(1),
24-31.
[13] Chaudhary R, Gangwal S, Jindal K and Khanna S, J. Chromatogr. B, 1993, 614(1),
180-184.
[14] Jones D and Bjorksten A, J. Chromatogr. B, 1994, 661(1), 165-167.
[15] M. N. Uddin, S. Das, S. H. Khan, S. K. Shill, H. R. Bhuiyan, R. Karim, J Taibah Univ
Sci, 2016, 10(5), 755-765.
[16] Patri, S., A. K. Patni, S. S. Iyer, A. H. Khuroo, T. Monif, S. Rana, S. Kumar, and R.
Jain, Chrom. Res. International, 2011, 2011, 1-11.
[17] Logan, B. K., Friel, N. P., Peterson, K. L., Predmore, B. B., J. Anal. Toxicol., 1995, 19,
61.
[18] ICH Harmonized Tripartite (1996) Validation of Analytical Procedures: Text and Methodology Q2 (R1), Current Step 4 Version, Parent Guidelines on Methodology Dated November 6 1996, Incorporated in November In: International Conference on Harmonisation, 2005, Geneva, Switzerland.