Phosphorene: Synthesis and Controlled Oxidation Using
Selective Environmental Parameters
Rebekah Wells
Graduate Student Co-workers: Kaci Kuntz, Adam Woomer, and Tyler Farnsworth
Principle Investigator: Scott Warren
Senior Honors Thesis
Chemistry
University of North Carolina at Chapel Hill
ABSTRACT
Phosphorene, a two-dimensional (2D) monolayer of black phosphorous (BP), has generated significant theoretical interest in its promising optoelectronic properties. However, attempts to mechanically exfoliate BP have had limited success leaving many predictions untested. Here I describe a reliable method of synthesis and thickness-based selection using liquid exfoliation and centrifugation. An extensive solvent and centrifugation speed study detail optimal parameters for exfoliation. An additional barrier is the material’s instability in ambient conditions, readily undergoing oxidation. While this instability is widely known, little is understood about the mechanism of degradation nor the resulting oxide species formed. I present here a series of time-lapse studies showing degradation of thin 2D BP over time for different environmental
parameters. In these studies, I describe conditions necessary to induce oxidation and degradation. I show that, in contrast to popular belief, light is not required to induce damage in 2D BP
1. INTRODUCTION
Two-dimensional (2D) and thin nanomaterials are revolutionizing electronic devices because of their unprecedented optoelectronic properties. These materials are being explored as possible tools for improving important technologies such as photovoltaics,1 transistors,2 light-emitting diodes,3 batteries,4,5 and photodetectors.6,7 Though interest in developing 2D materials surged with the discovery of graphene, its lack of band gap limited its application in optoelectronic devices.8 Researchers have since turned to alternative materials including transition metal dichalcogenides (MoS2, WeSe2), and other semimetals in search of more favorable
optoelectronic properties.
Of particular interest is a material known as black phosphorous (BP). BP is a semiconductor material made up of layers of puckered elemental phosphorous sheets held together principally by van der Waals (vdW) forces.9 Coleman’s work exfoliating graphite to graphene suggested that this layered material could be exfoliated into monolayers, which are now known as phosphorene, or few layer pieces.10 Recently, this material has attracted considerable attention due to
theoretical predictions of the material’s chemical reactivity,11,12 mechanical properties,13 and anisotropic and thickness-dependent optoelectronic properties.14,15 Notably, studies have
predicted that phosphorene should possess a band gap of 1.8 eV,16 ~1.5 eV larger than BP’s band gap in bulk form (0.31 eV)17. These characteristics, if true, would make 2D BP an excellent candidate for optoelectronic devices.
Until recently, most of these predictions remained untested as no method existed for the production or purification of monolayer and few layer BP. Unlike graphene, mechanical
In addition, I will describe my work on the controlled modification of phosphorene by oxygen and water. Although phosphorene possesses many desired characteristics, it was found recently that thin BP undergoes oxidation when exposed to ambient conditions.19 This in turn leads to the degradation of the material’s optoelectronic properties.20 While the oxidation of BP is well-documented, both the oxide composition and mechanism of oxidation remain unknown. Additionally, no significant research efforts have been made to understand how controlled oxidation might be transformed from a liability to a tool for functionalization. This work investigates the impacts of environmental parameters on the oxidation of thin BP over time and explores the possibility of selective oxidation and modification. X-ray photoelectron
spectroscopy (XPS) in conjunction with transmission electron microscopy (TEM) are used to show oxidation and degradation for varying conditions over extended periods of time.
2. EXPERIMENTAL
2.1 Liquid Exfoliation
Black phosphorous crystals were synthesized via SnI2 transport.21 Under an inert environment
the crystals were ground into a fine powder with mortar and pestle. Based on Coleman’s work with graphene,10 N-methyl pyrrolidone (NMP) was selected as the first test solvent. Ten milligrams of BP powder were sonicated in 20 mL of NMP using a low power bath sonicator. After the solutions of suspended BP were centrifuged at 4000 rpm, the supernatant was collected and centrifuged again at 4000 rpm. UV–Vis transmission spectroscopy was used to characterize BP suspended in the supernatant and determine dispersed concentration. The 2D material was re-dispersed in isopropanol (IPA) before being drop cast onto carbon film TEM grids and examined using a low-resolution JEOL 100CX II TEM.
2.2 Liquid Exfoliation Solvent Study
mass spectroscopy (ICP-MS) and UV–Vis transmission spectroscopy were used to characterize these suspensions and determine dispersed concentration.
2.3 Isolating Thin 2D BP
Centrifugation speeds ranging from 1,000 to 21,000 rpm were tested as a means of selecting BP flakes based on lateral size and thickness. Suspensions of BP in NMP were centrifuged at 1,000 rpm. That supernatant was collected and centrifuged at a slightly higher rpm. This process was repeated until we reached 21,000 rpm. UV–Vis transmission spectroscopy was used to
characterize these suspensions. TEM was used to analyze flake thickness and lateral size.
2.4 Preliminary BP Flake Exposure Series
2D BP suspended in IPA was drop cast onto a carbon TEM grid. The grid was set on a platform and exposed to ambient conditions and illuminated by an LED with a specific power of 0.6 mW/cm2. The apparatus was confined to a dark box, so that only light from the LED played a role. Flakes were selected, imaged, and reimaged over a period of 84 hours using a low-resolution JEOL 100CX II TEM. The samples were placed under vacuum and stored in inert conditions between exposures.
2.5 Controlled Environment Exposure Series
2D BP suspensions re-dispersed in IPA were drop cast onto TEM grids or doctor bladed onto glass slides and hydrophilic gold plated silicon wafers. These grids and films were exposed to controlled environments of oxygen, water, and a mixture of the two. For the oxygen
environment, research grade oxygen was flowed over desiccant phosphorous pentoxide before reaching the BP sample to eliminate water from the system. Distilled water was heated to 110 °C
parameters. Special apparatus was designed to load samples into each instrument under an inert environment. The samples were placed under vacuum and stored in inert conditions between exposures.
3. RESULTS AND DISCUSSION
3.1 Synthesis of Phosphorene
Figure 1 demonstrates the absorbance of liquid exfoliated black phosphorous for a series of seven cycles where a cycle is 99 minutes of bath sonication followed by 10 minutes of centrifugation at 4000 rpm. With each cycle the material gradually transforms from black to reddish brown (Fig. 1 inset, left to right) indicating a remarkable change in the electronic structure of the material. Various theoretical works predict the band gap of monolayer phosphorous to be in the 1.01 to 2.15 eV range, or 660-480 nm.15,17,22 We observed a steady increase in absorption over this region with increasing cycles, suggesting that sonication produces higher dispersed concentration with time.
Figure 1: UV-Vis-IR spectra for liquid exfoliated BP in NMP over seven cycles of sonication (90 minutes) and 4000 rpm centrifugation (10 minutes). From lowest absorbance to highest: the dotted line represents 1 cycle, the short dash line is 3 cycles, the solid line is 5 cycles, and the long dash is 7 cycles. Inset shows color change between unsonicated BP in NMP (left) and sonicated BP in NMP (right).
0 0.5 1 1.5 2 2.5 3 3.5
260 360 460 560 660 760 860 960
Ab so rb an ce U ni ts (AU )
Figure 2: TEM images of liquid-exfoliated 2D BP. (a) Trilayer BP flake. Inset shows contrast change between grid and flake. (b) 2D BP flake. (c) HR-TEM image of phosphorene, a
monolayer. (d) Fast Fourier Transform of the HR-TEM image in (d).
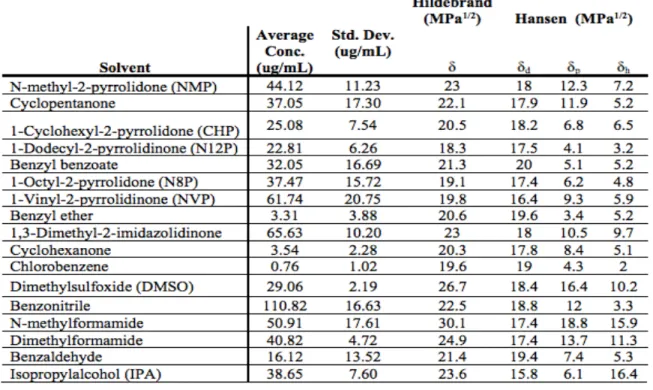
After successfully producing 2D BP via liquid exfoliation we turned our attention towards optimizing the exfoliation process. Hildebrand and Hansen solubility parameters are common starting points when determining suitable solvents to dissolve or disperse solutes.23 Hildebrand provides one parameter estimating the interaction between materials based off of the square root of the cohesive energy density of the materials in question.24 Hansen looks at three parameters: dispersion forces (δd), intermolecular forces (δp), and hydrogen bonding (δh) between
molecules.25 When these solubility parameters match between solvent and solute, mixing enthalpy is minimized and dispersion or dissolution is increased.23 Hughes et al. used these parameters to derive a general expression for mixing enthalpy, which takes into account the dimensionality of the solute (0D, 1D, 2D, 3D):
c d
∆"#$%
&#$% = 1 −
*
+ 𝜙 1 − 𝜙 [ 𝛿*,0− 𝛿*,1 3
+ 𝛿5,0−𝛿5,1 3] (1)
where d is dimensionality, 𝜙 is volume fraction, S corresponds to solvent, and N corresponds to nanomaterial.23
Coleman used this expression to create model which predicts that solvents best exfoliate materials when their surface energies match that of the layered material.26 Furthermore,
reaggregation is reduced in these suspensions.26 Hansen parameters 18, 10, and 7 MPa1/2 for δd,
δp, and δh, respectively, were shown to best exfoliate graphene and were the basis of our solvent
selections for this study.10 We surveyed 18 solvents (Table 1) for their ability to exfoliate BP using inductively coupled plasma mass spectroscopy (ICP-MS) and UV-Vis spectroscopy to measure a dispersed concentration. We concluded that benzonitrile, which obtained a mean concentration of 0.11 +/- 0.02 mg/ml, was the best solvent. By plotting phosphorous
Table 1: Liquid Exfoliation of BP and Hildebrand and Hansen parameters.25
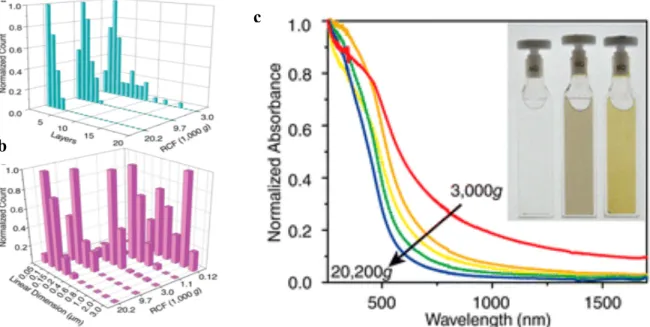
With the goal to isolate 2D BP flakes according to thickness and optical properties, we used centrifugation as a means of fractioning the liquid exfoliated BP suspensions. UV-Vis
spectroscopy demonstrated a profound change in absorption between fractions (Fig 4c), while a survey of thickness and lateral dimension via TEM showed distributions of size and thickness between fractions (Figure 4a-b). For example, high centrifugation speeds produced suspensions comprised primarily of mono and bilayers. These results demonstrate the ability of the
centrifugation approach to systematically separate flakes according to size and thickness.
Figure 4: Variation of centrifugation rate allows for control over (a) flake thickness, (b) flake lateral size, and (c) absorption. (c) Shows the absorbance of 2D phosphorus suspensions that were prepared by fractionation at rcf values near 3000, 5900, 9700, 14 500, and 20 200g (red to blue).
c a
3.2 Oxidation of 2D BP Using Controlled Environments
Although a reliable method for phosphorene synthesis has been established, the material’s susceptibility to oxidation under ambient conditions remains problematic. Knowing which conditions induce oxidation of 2D BP is essential in understanding how the material degrades and how its optoelectronic properties are effected. We turn now from production of 2D BP via liquid exfoliation to the effects of different environmental parameters on the oxidation and degradation of the material.
Figures 5a-b demonstrate the crystallinity of the 2D BP flakes via TEM imaging. The presence of the 002 and 200 coordinates confirm both crystallinity and monolayer thickness. The XPS spectra in Figure 1f displays a 2p doublet where the the 2p3/2 is centered at 130.1eV and the 2p1/2
is centered at 131.0 eV, showing only peaks which are characteristic of unoxidized black phosphorous.
Figure 5: Liquid exfoliated black BP and characterized thin films of 2D BP. (a) TEM image of pristine 2D BP flake. (b) Diffraction pattern of flake. (c) Centrifuged solution of exfoliated 2D BP suspended in NMP. (d) Thickness distribution of 2D suspension. (e) SEM image of topology of doctor bladed film of 2D BP. (f) XPS spectra for pristine 2D BP.
Figure 6: TEM images at 100 kV show time lapse of a 2D BP flake exposed to ambient
conditions and 460 nm light from 0 hours to 84 hours. (a) Pristine BP flake after 0 hours, (b) 42 hours, and (c) BP 84 hours of exposure.
Previous studies suggested that both oxygen and light must be present in order for the thin BP to undergo oxidation.19,20 This suggests that a minimum wavelength of around 660 nm would be required to damage bilayers, which have a band gap of 1.88 eV.18 In order to test the role that light plays in this process we repeated the above process for different energies of incident light. Four TEM grids were drop cast with 2D BP suspended in IPA. Images were taken of pristine flakes were taken before exposure (Fig. 7a-d). Each grid was then placed in ambient conditions and exposed to a different wavelength of light: 460 nm, 740 nm, 940 nm, and no light. TEM images were recorded at set time points leading up to 84 hours. The samples were placed under vacuum and stored in inert conditions between exposures. Due to a compromised TEM grid, BP flakes at 42 hours are shown. As expected the most significant amount of damage was found for the flakes that were exposed to the highest energy light (Fig. 7e). However, we also observed significant damage in flakes exposed to 740 nm and 940 nm (Fig. 7f-g), which were predicted to be too low to induce damage. Most surprisingly is the presence of noticeable damage in BP flakes that were exposed to ambient conditions in complete darkness (Fig. 7h). We conclude from these results that while light can increase the rate and amount of damage induced, it is not a necessary condition for the oxidation of 2D BP.
Figure 7: TEM images at 100 kV show time lapse of 2D BP flakes exposed to ambient
conditions and 460 nm light from 0 to 42 hours for varying energies of incident light. (a) Pristine BP flake at 0 hours and (b) BP flake at 42 hours, 460 nm. (c) Pristine BP flake at 0 hours. (d) BP flake at 60 hours, 740 nm. (e) Pristine BP flake at 0 hours. (f) BP flake at 42 hours, 940 nm. (g) Pristine BP flake at 0 hours. (h) BP flake at 42 hours, no incident light. Dashed lines highlight oxidation and degradation of material.
During the studies presented in Figures 6 and 7, it was observed that pieces that had been examined by TEM earlier in the process tended to be more damaged than pieces that were observed later in the process. For example, a piece that was examined several times over the 84- hour period was more damaged than a piece only examined once at 84 hours. Concerned with the possibility of knock-on damage introduced by the TEM, we explored the rate and amount of damage for varying accelerating voltages over a period of time. Three separate TEM grids were prepared. Images of pristine BP flakes were taken at 60 kV (Fig 8a), 80 kV (Fig 8b), and 100 kV (Fig 8c). Each grid was then subjected to ambient conditions and 460 nm. Images were taken at several time points leading up to 84 hours (Fig. 8d-f) for each voltage. The samples were placed under vacuum and stored under inert conditions between exposures. At 100 kV significantly more damage was observed, despite being exposed to air and 460 nm for the same amount of time as the 60 kV and 80 kV samples. Though 60 kV displayed the least amount of damage, the image resolution was consistently poor. As a result, 80 kV was chosen as the accelerating voltage for all future studies involving TEM to reduce knock-on damage while still obtaining high resolution images.
b
a c d
Figure 8: TEM images show time lapse of 2D BP flakes exposed to ambient conditions and 460 nm light from 0 to 84 hours for varying accelerating voltages. (a) Pristine BP flake at 0 hours, 60 kV (b) BP flake at 84 hours, 60 kV. (c) Pristine BP flake at 0 hours, 80 kV. (d) BP flake at 84 hours, 80 kV. (e) Pristine BP flake at 0 hours, 100 kV. (f) BP flake at 84 hours, 100 kV. Dashed lines highlight oxidation and degradation of material.
Up to this point, all of the work presented has dealt with the conditions necessary to induce oxidation in an ambient environment. We move now to a more in-depth discussion of how the environment plays an important role in where and how oxidation occurs.
XPS was used as a means of examining the 2p core electron binding energies in the thin film BP assemblies for each of the three environments. As previously mentioned, pristine 2D BP displays a 2p doublet at 130.1 eV (Fig 5f). We observed this doublet again for each set of environmental parameters, confirming that some amount of unoxidized BP is present and because of the
collection depth of electrons, the oxide layer is less than 5nm thick in most, if not all, cases (Fig. 9a-c). With increased exposure, higher core binding energies were observed with increasing intensity in the 132-134 eV range. As phosphorous oxide species appear on the surface of the film, the electron-withdrawing nature of the species make the removal of a core electron
progressively more difficult, as exhibited by the appearance of the higher binding energies. The increasing intensity of the peaks suggests an increasing number of species present with time. We conclude that specific environmental parameters play a significant role in the rate of oxidation and the resulting phosphorous-oxide species composition.
a
d
c
f
e
We also observed that environments containing only oxygen or only water (Fig. 9a-b) led to slower rates of oxidation, while a mixture led to accelerated oxidation (Fig 9c). This suggested a multi-step oxidative process, which was explored by exposing samples to a series of gases: water, nitrogen, then oxygen or oxygen, nitrogen, followed by water. Each sample was exposed to the first gas under dark conditions and then purge and resealed with nitrogen before being exposed to the third gas and illuminated by 460 nm light for one hour. The degradation rate was observed to be accelerated and the oxide more abundant in these series than in any of the single-component environments, confirming a multi-step mechanism.
Figure 9: XPS spectra of 2D BP in various environments: (a) oxygen, (b) water, and (c) water and oxygen. Pink line indicates 1 hour exposure, green is 6 hours, and purple line is for 18 hour exposures. Relative amount of oxidation over time is shown for (d) oxygen, (e) water, and (f) water and oxygen. TEM images at 80 kV show the time lapse of 2D BP flakes from 0 to 18 hours for each environment, (g) oxygen, (h) water, (i) water and oxygen, corresponding to the XPS data.
A TEM time-series was used to explore the physical signs of oxidation such as pitting and material loss in each controlled environment. 2D BP was drop cast onto three separate TEM grids and exposed to the environmental conditions using the same procedure as for the films. Images were acquired at 1, 6, and 18 hours and were vacuumed and stored under inert
environments between exposures and imaging. Fig. 10b-d shows the time series for the oxygen-only environment. Despite some knock-on damage induced by the TEM and in stark contrast to flakes observed under ambient conditions (Fig. 6-9), no significant areas of pitting or loss of material were observed for flakes in the oxygen-only environment. This in conjunction with the oxide peaks observed in figure 5a suggest that a self-passivating oxide layer forms on
phosphorene when oxygen is the only atmospheric agent. However, a flake in the water-only environment displayed pitting at ledges on the thicker regions and a general loss of definition after only one hour of exposure (Fig. 10e). These results suggest that a phosphoric
oxide/phosphoric acid mixture is formed on the surface, which could only be possible if the BP flake has successfully reduced water. Furthermore, exposure to ambient conditions over time showed pitting in addition to edge loss as shown in Fig. 10f-g. Extended oxidation showed an increased diameter of pitting sites in thicker regions (Fig. 10h), indicating that both the electrons and holes were funneled into these regions from thinner areas. This is consistent with the
Figure 10: TEM images at 80 kV of show 2D BP flakes exposed to different environments from 0 to 18 hours. (a) Pristine 2D BP flake is exposed to a pure O2 environment for (b) 1 hour (c) 6
hours, and (d) 18 hours; dashed lines indicate edges. (e) 2D BP flake exposed to pure H2O
environment for 6 hours. (f) Pristine 2D BP flake with edge outlined by dashed line is exposed to ambient conditions for (g) 18 hours. Red highlight indicates position of new edge with respect to pristine edge. (h) 2D BP exposed to ambient conditions for 76 hours.
4. CONCLUSION
In this work I have presented our procedure for preparing and isolating monolayers, bilayers, and few-layer flakes of BP. Benzonitrile was found to be the best solvent for this method. Using UV– Vis spectroscopy, TEM, and HR-TEM, we confirmed the presence of 2D BP in liquid-exfoliated samples and the ability of centrifugation to isolate flakes of a desired thickness. This work presents the first method which allows for the acquisition and characterization of large quantities of 2D BP.
Using these methods, we were able observe flakes over extended periods of exposure.
As expected, extended exposure produced led to more oxidation and degradation. Though high energy light proved to be the most damaging to the 2D BP flakes, we find that light is not a requirement for oxidation and degradation. We found that TEM knock-on damage is
degradation; specifically, oxygen-only environments produce self-passivating oxide layers. Most interestingly, we observe the funneling of electrons and holes to thicker regions, allowing for the reduction of water.
5. OUTLOOK
Our work provides a basis for large scale production of 2D BP, enabling in-depth studies into the material’s chemical and physical properties. Future work will need to explore more of these properties and continue its application to optoelectronic devices. This detailed exploration of oxidation provides a starting point for chemical modification and functionalization. Controlled functionalization will necessary to employ the material in practical applications. This will also provide insight into doping, site defects, and electron-hole recombination. Initial reports in the literature have shown that controlling site defects produces high performance in transistors.29 Additional studies should be completed to further explore BP’s abilities to absorb light and reduce water, key components for water-splitting devices. These and other studies are now feasible because of the methods and materials developed in this thesis.
ACKNOWLEDGEMENTS
Special thanks to Scott Warren, principle investigator, mentor, and editor.
Kaci Kuntz graduate student mentor and co-worker throughout BP oxidation studies. Responsible for the oxidation study images in Figures 5, 9, 10.
Adam Woomer, Tyler Farnsworth graduate student mentors and co-workers throughout work in liquid exfoliation. Responsible for liquid exfoliation images in Figures 2-4.
I acknowledge support of this work by the Carrie Ann Largent Scholarship Fund in Chemistry through the University of North Carolina at Chapel Hill.
Sciences under Award Number DE-SC0001011) and the UNC SERC (“Solar Energy Research Center Instrumentation Facility” funded by the U.S. Department of Energy, Office of Energy Efficiency & Renewable Energy, under Award Number DE-EE0003188).
REFERENCES
[1] Thompson, B. C.; Fréchet, J. M. J. Polymer-Fullerene Composite Solar Cells Angew. Chem.,
Int. Ed.2008, 47, 58– 77, DOI: 10.1002/anie.200702506
[2] Talapin, D. V.; Murray, C. B. PbSe Nanocrystal Solids for N- and P-Channel Thin Film Field-Effect Transistors Science2005, 310, 86– 89, DOI: 10.1126/science.1116703
[3] Wu, J.; Agrawal, M.; Becerril, H. A.; Bao, Z.; Liu, Z.; Chen, Y.; Peumans, P.Organic Light-Emitting Diodes on Solution-Processed Graphene Transparent Electrodes ACS Nano2010, 4, 43– 48, DOI: 10.1021/nn900728d
[4] Park, C.-M.; Sohn, H.-J. Black Phosphorus and Its Composite for Lithium Rechargeable Batteries Adv. Mater.2007, 19, 2465–2468, DOI: 10.1002/adma.200602592
[5] Cunningham, G.; Lotya, M.; Cucinotta, C. S.; Sanvito, S.; Bergin, S. D.; Menzel, R.; Shaffer, M. S. P.; Coleman, J. N.Solvent Exfoliation of Transition Metal Dichalcogenides: Dispersibility of Exfoliated Nanosheets Varies Only Weakly Between Compounds ACS Nano2012, 6, 3468– 3480, DOI: 10.1021/nn300503e
[6] Buscema, M.; Groenendijk D.J.; Blanter, S.I.; Steele, G.A.; S.J. vander Zant, and H,, Castellanos-Gomez, A. Photovoltaic Effect in Few-Layer Black Phosphorus PN Junctions Jefined by Local Electrostatic Gating Nat. Commun.2014, 5, 1- 6, DOI: 10.1038/ncomms5651
[7] Bab, M.; Takeda, Y.; Shibata, K.; Ikeda, T.; and Morita, A. Optical Properties of Black Phosphorous and its Application to the Infrared Detector Jpn. J. of Appl. Phys. 1989, 28, 2104-2106, DOI: 10.1143/JJAP.28.L2104
[8] Akinwande, D., Petrone, N. & Hone, J. Two-Dimensional Flexible Nanoelectronics Nat.
Commun. 2014, 5, 5678 DOI: 10.1038/ncomms6678
[9] Lee, H. U.; Lee, S. C.; Won, J.; Son, B.; Choi, S.; Kim, Y.; Park, S. Y.; Kim, H.; Lee, Y.; Lee, J. Stable Semiconductor Black Phosphorus (BP)@Titanium Dioxide (TiO2) Hybrid Photocatalysts Sci. Rep. 2015, 5, 8691, DOI: 10.1038/srep08691
[11] Kou, L.; Frauenheim, T.; Chen, C.Phosphorene as a Superior Gas Sensor: Selective Adsorption and Distinct I - V Response J. Phys. Chem. Lett.2014, 5, 2675– 2681, DOI: 10.1021/jz501188k
[12] Favron, A.; Gaufrès, E.; Fossard, F.; Phaneuf-L’Heureux, A.-L.; Tang, N.
Y.-W.; Lévesque, P. L.; Loiseau, A.; Leonelli, R.; Francoeur, S.; Martel, R.Photooxidation and Quantum Confinement Effects in Exfoliated Black Phosphorus Nat.
Mater. 2015, 14, 826– 832, DOI: 10.1038/nmat4299
[13] Jiang, J.-W.; Park, H. S.Mechanical Properties of Single-Layer Black Phosphorus J. Phys.
D: Appl. Phys. 2014, 47, 385304, DOI: 10.1088/0022-3727/47/38/385304
[14] Low, T.; Rodin, A. S.; Carvalho, A.; Jiang, Y.; Wang, H.; Xia, F.; Neto, A. H. C.Tunable Optical Properties of Multilayers Black Phosphorus Phys. Rev. B 2014, 90, 075434, DOI: 10.1103/PhysRevB.90.075434
[15] Castellanos-Gomez, A.; Vicarelli, L.; Prada, E.; Island, J. O.; Narasimha-Acharya, K. L.; Blanter, S. I.; Groenendijk, D. J.; Buscema, M.; Steele, G. A.; Alvarez, J. V.Isolation and Characterization of Few-Layer Black Phosphorus 2D Mater. 2014, 1, 025001, DOI:
10.1088/2053-1583/1/2/025001
[16] Takao, Y.; Asahina, H.; Morita, A.Electronic Structure of Black Phosphorus in Tight Binding Approach J. Phys. Soc. Jpn.1981, 50, 3362– 3369, DOI: 10.1143/JPSJ.50.3362
[17] Liu, H.; Neal, A. T.; Zhu, Z.; Luo, Z.; Xu, X.; Tománek, D.; Ye, P. D. Phosphorene: An Unexplored 2D Semiconductor with a High Hole Mobility, ACS Nano, 2014, 8, 4033– 404, DOI: 10.1021/nn501226z
[18] Woomer, A. H.; Farnsworth, T. W.; Hu, J.; Wells, R. A.; Donley, C. L.; Warren, S. C. Phosphorene: Synthesis, Scale-Up, and Quantitative Optical Spectroscopy. ACS Nano,2015, 9, 8869-8884, DOI: 10.1021/acsnano.5b02599
[19] Favron, A. et al. Photooxidation and Quantum Confinement Effects in Exfoliated Black Phosphorus. Nat. Mater. 2014, 14, 826–832.
[20] Wood, J. D. et al. Effective Passivation of Exfoliated Black Phosphorus Transistors against Ambient Degradation. Nano Lett,2014, 14, 6964–6970, DOI: 10.1021/nl5032293
[21] Köpf, M.; Eckstein, N.; Pfister, D.; Grotz, C.; Krüger, I.; Greiwe, M.; Hansen, T.; Kohlmann, H.; Nilges, T.Access and In Situ Growth of Phosphorene-Precursor Black Phosphorus. J. Cryst. Growth2014, 405, 6– 10, DOI: 10.1016/j.jcrysgro.2014.07.029
[22] Liang, L.; Wang, J.; Lin, W.; Sumpter, B. G.; Meunier, V.; Pan, M.Electronic Bandgap and Edge Reconstruction in Phosphorene Materials Nano Lett.2014, 14, 6400– 6406, DOI:
[23] Hughes, J. M.; Aherne, D.; Coleman, J. N. Generalizing Solubility Parameter Theory to Apply to One- and Two-Dimensional Solutes and to Incorporate Dipolar Interactions. J. Appl.
Polym. Sci. 2012, 127, 4483-4491, DOI: 10.1002/app.38051
[24] The Oaklnad Museum of California. Part 2 - The Hildebrand Solubility Parameter.
http://www.cool.conservation-us.org/byauth/burke/solpar/solpar2.html (accessed Apr 06, 2016).
[25] Hansen, C. M. Hansen Solubility Parameters: A User’s Handbook, 2nd ed.; CRC Press: New York 2007.


![1,2 Dimethoxy 3 [(E) 2 nitroethenyl]benzene](data:image/gif;base64,R0lGODlhAQABAIAAAP///wAAACH5BAEAAAAALAAAAAABAAEAAAICRAEAOw==)