Sharif University of Technology
Scientia IranicaTransactions E: Industrial Engineering www.scientiairanica.com
An evidential reasoning approach for the earned value
management
H. Forouzanpour, A. Mirzazadeh and S. Nodoust
Department of Industrial Engineering, Kharazmi University, Mofatteh Ave., Tehran, Iran. Received 13 March 2013; received in revised form 24 November 2014; accepted 13 April 2015
KEYWORDS Evidential reasoning; Earned value management; Earned schedule; Project progress; Interval;
Uncertainty modeling.
Abstract. Earned Value Management (EVM) is a project management technique used to measure project progress by integrating ecient management of the most important three elements in a project i.e. cost, schedule, and scope. This paper presents an Evidential Reasoning (ER) based model for estimating the Earned Value (EV) of the projects activities with uncertainties in progress data. Since the subjective nature of EV measurement can incorporate errors and uncertainties which cause biased judgments, and as the uncertainty is inherent in real-life activities, the developed ER based model is very useful to evaluate the EV of a project wherein uncertainty arises. A case study is provided to illustrate how the new model will be used and can be implemented in reality.
© 2016 Sharif University of Technology. All rights reserved.
1. Introduction
According to Project Management Institute [1,2], Earned Value Management (EVM) is a management methodology for objectively measuring project perfor-mance and progress, and forecasting project outcome. Estimating EV is the basis of EVM and hereby, other cost and time indices in EVM can be calculated. Also, progress of a project could be measured by comparing the planned and actual data of activities to their corresponding EVs. The \Earned Value" of a project at a point in time is the estimated amount of work done up to that point [3]. EVM advantages in projects are widely investigated and studied by many experts and practitioners. Earned Value Method (EVM) is one such multidimensional project control method that integrates cost, schedule, technical performance, and scope [1,2,4-6]. VM can be said to bring cost and
sched-*. Corresponding author. Tel.: +98 21 4445 1990; Fax: +98 21 4445 1990
E-mail addresses: hr forouzanpour@yahoo.com (H. Forouzanpour); a.mirzazadeh@aut.ac.ir (A. Mirzazadeh); sara arezoo n@yahoo.com (Sara Nodoust)
ule variance analyses together to provide managers with a more accurate status of a project. Mirzazadeh and Safari [7] studied project risks assessment by using the mathematical theory of evidence under uncertainty conditions.
Anbari [8] enhanced the eectiveness of EV im-plementation. Kim et al. [9] studied implementation of the EV in dierent types of organizations and projects. Cio [4] presented a new notation for the EV analysis to make EV mathematics more trans-parent and exible. Pajares and Lopez-Paredes [10] proposed two new metrics that combine Earned Value Management (EVM) and Project Risk Management for project controlling and monitoring, Cost Control Index (CCoI), and Schedule Control Index (SCoI). Moslemi et al. [11] incorporated the fuzzy principles into Earned Value (EV) calculations, developing a technique to measure and evaluate the performance and progress of a project and its activities under uncertainty, using linguistic terms for measuring the Schedule and Cost Performance Indices (SPI/CPI), and introducing the problem of calculating the fuzzy ESch. Maravas and Pantouvakis [12] introduced S-surface (as opposed to the traditional S-curve) in a
cash ow calculation methodology for projects includ-ing activities with fuzzy durations and/or costs that can be useful for performing earned value analysis. Bagherpour et al. [13] modeled the uncertainty as-sociated with activity duration in earned value to design a control mechanism, which was applicable through production control. Ponz-Tienda et al. [14] took into consideration not only the duration, but also the cost and production in the formulation of the fuzzy EV. Lipke et al. [15] used mathematics of statistics for analyzing cost and duration of project to improve a solution to the problem of uncertainty and imprecision in predictions. Lipke [16] introduced the Earned Schedule Method (ESM) and calculated two alternative schedule performance measures, referred to as SV(t) and SPI(t). Since then, various authors have validated the new earned schedule method on both ctitious and real life project data. The applicability and reliability of ES has been studied and approved by many experts [17-19]. Other eorts on earned value management in recent years are Hunter et al. [20], Acebes et al. [21], Khamooshi and Golafshani [22], etc.
Measuring EV is not simple and how to determine it is a matter of discussion between EVM practition-ers. The subjective nature of EV measurement can incorporate errors and uncertainties which cause biased judgments. The idea to overcome this problem is to use Evidential Reasoning Approach in estimating the EV of each activity as the imprecise and uncertain data of activity performance and progress, which is common to arise. Using ER approach in EVM forms the basis of our novel idea.
The remaining of this paper is organized as fol-lows. Section 2 brings an introduction into the EV mea-surement methods, their advantages, and applications. Section 3 reviews the Evidential Reasoning approach and explains, briey, an innovation to ER concept i.e., the IER algorithm. Developing the ER based model for EV estimation and its corresponding indices and estimates is presented in Section 4. A simple example is studied in details in Section 5. Finally, this paper ends with the conclusion.
2. Earned value measurement methods
PMI [2] states that the methods for measuring the per-formed work are selected during project planning prior to commencing the work, and they are the basis for performance measurement during project execution.
According to Project Management Institute Prac-tice Standard for Earned Value Management [2], there are three classes of work, as follows:
Discrete eort (Fixed Formula, Weighted Milestone, Percent Complete, Physical Measurement);
Apportioned eort; Level of eort.
There is not so much uncertainty in estimating EV by the xed formula method. Therefore, it is not mentioned in this paper. Incorporating uncertainties in Weighted Milestone EV measurement method results in interval Planned Value which is not in scope of this research and could be studied in future research. Apportioned Eort is a rarely used technique for special related work packages [6]. Because of their small role in the overall calculated EV of project, we ignore uncertainties in this method of EV measurement.
We disregard studying Physical Measurement method to make our research shorter, and as it is stated in conclusion and future research section, it is better to be discussed in future studies.
The EV measurement of LOE activities is not considered to have uncertainties, because these kinds of activities do not directly produce denitive end products that can be delivered or measured objectively; LOE activities will not have a schedule variance, too.
So, this paper studies uncertainty in estimating EV of activities with Percent Complete EV Measure-ment Method, which is the most used technique in this area.
3. Evidential reasoning
In this paper, assessments of beliefs about subsets of adjacent grades (or intervals of grades) will be used in the context of MCDM (Multi Criteria Decision Making). The Evidential Reasoning (ER) approach is the latest development in the MCDM area [23].
The ER approach is developed for handling Multi-ple Criteria Decision Analysis (MCDA) problems hav-ing both quantitative and qualitative information with uncertainties and subjectivity [23-25]. Its algorithm is developed for aggregating multiple attributes based on a belief decision matrix and the evidence combination rule of the Dempster-Shafer (D-S) theory [26].
Since, in addition to singletons set of hypotheses, the D-S theory allows belief degrees to be assigned to any subsets of hypotheses, and also ignorance can be modeled, the D-S theory is regarded to be more exible than traditional Bayes theory in modeling uncertainties. The D-S combination rule can also provide more rigorous yet useful results. For example, it can generate a lower bound and an upper bound of a belief degree to which a hypothesis is believed to be true. More discussion on the potential and advantages of the D-S theory in decision making under uncertainty can be found in [27].
Extensive research dedicated to the ER approach has been conducted in recent years, and it has been applied with some successes to such topics as face
recognition, statistical classication, and target iden-tication. Additional applications center on multi-source information, including medical diagnosis and plan recognition [27]. But it has not been used widespread in topics such as project management, in which many uncertainty and vagueness could arise in the real data of projects; especially, it could be more useful when, based on these kinds of data, a decision should be made by the project management team.
In real situations, however, experts or decision makers may often feel it too restrictive and dicult to give precise (crisp) assessments due to incompleteness or lack of information [28-30]. To deal with these situations, experts are encouraged to give interval-valued assessments which are Interval-interval-valued Belief Structures (IBSs). Correspondingly, the ER approach is extended as the Interval-valued ER (shortly called IER) approach [31]. The IER algorithm provides a general modeling framework and an attribute aggrega-tion process to deal with both local ignorance (where decision makers may not always be condent enough to provide subjective assessments to individual grades only, but at times wish to be able to assess beliefs of subsets of adjacent grades), and global ignorance (situations where decision makers are restricted to provide assessments for individual assessment grades only and any ignorance is assigned to the whole space of grades) in MADA (Multi Attribute Decision Analysis). 4. Using evidential reasoning in estimating
earned value management indices
The application of the proposed method arises in situations where the activity progress cannot be clearly estimated or the total amount of the work required to perform the activities is unknown or uncertain and it is out of control. It is because of uncertainty in subjective judgments and/or uncertainty due to lack of data or incomplete information. In projects such as research and developments, these uncertainties are so common and determining an absolute value as earned value is not reliable. Our proposed method transforms uncertainties into an Interval Earned Value (IEV). 4.1. Estimating earned value
The complete percent EV measurement method is one of the simplest and mostly used techniques for measuring the EV, in each measurement period. The project management team is responsible for deter-mining earned value and makes an estimate of the percentage of the completed activity. This technique can incorporate errors and uncertainty which cause biased judgments. An idea to overcome this problem is to use belief degrees in estimating the completion percent of each activity, as the imprecise and uncertain data of activity performance and activity progress
are common to arise. This forms the basis of our proposed method. Note that our proposed evidential reasoning model consists of two attributes (Am and
An) as decision makers. The IER aggregation process
described below can be done recursively until all M basic attribute assessments are aggregated that means all DMs make their decisions without any limitation.
Project management team should determine these inputs to build the model:
1. The evaluation grades Hii (i = 1; ; N). Bigger
N means less uncertainty in EV estimation and vice versa;
2. The utility value is the measure of preference of the decision maker. It is a number within a predened range assigned by the decision maker to an assessment grade if the attribute is quali-tative, or to an attribute value if the attribute is quantitative. Normally, the range can be one of the following: [0,1], [0,10], or [0,100]. The highest number is assigned to the most preferred grade or value while the lowest number is assigned to the least preferred grade or value.
Utility Values fu(Hii) and u(Hjj) (i =
1; ; N; j = i; ; N)g should be determined by project management team to be used in Eqs. (13) and (14);
3. The assessment of an activity progress by project management team as one of our decision makers (Am) is then given by:
S(Am) = f(Hij; ij; m); i = 1; ; N;
j = i; ; N; i jg; (1)
and that of another project management team (An)
is given by:
S(An) = f(Hij; ij;n); i = 1; ; N;
j = i; ; N; i jg; (2)
where ij;m, ij;n 0 is the belief degree associated
with the grade interval Hij and, by denition, the
total belief degrees should be 1, i.e.:
N
X
i=1 N
X
j=i
ij;m = 1; (3)
N
X
i=1 N
X
j=i
ij;n= 1: (4)
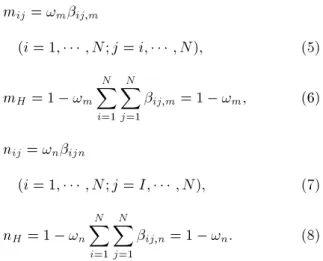
4. !m and !n are the normalized weights for project
management team as our decision makers (Amand
An), see Eqs. (5)-(8). The weight of each project
charge of activity EV estimation) as !ican be
eval-uated based on many factors such as organizational management policy, project management strategy, the opinion of project stakeholders, etc.
mij= !mij;m
(i = 1; ; N; j = i; ; N); (5)
mH= 1 !m
N
X
i=1 N
X
j=1
ij;m = 1 !m; (6)
nij = !nijn
(i = 1; ; N; j = I; ; N); (7)
nH = 1 !n N
X
i=1 N
X
j=1
ij;n= 1 !n: (8)
The combined probability mass for each grade interval fHijg with i j, denoted by Cij, is presented in
Eq. (9):
Cij =1 K1 mijnij+ i
X
k=1 N
X
l=j
(mklnij+mijnkl)
+Xi 1
k=1 N
X
l=j+1
(mkjnil+ milnkj)
+ mHnij+ mijnH
!
; (9)
and the probability mass is given by:
CH =m1 KHnH; (10)
where K is the combined probability mass assigned to the empty set fg:
K =
N
X
i=1 N
X
j=i i 1
X
k=1 i 1
X
l=k
(mklnij+ mijnkl): (11)
By applying the above aggregation process, recursively, until all the M basic attribute assessments are aggre-gated and assuming that the nal resultant probability masses are shown as in Eqs. (9)-(11), the overall assessment of an activity progress (A) can be expressed as:
S(A) = f(Hij; ij)(i = 1; ; N; j = i; ; N)g;
with ij=1 CCij
H (i = 1; ; N; j = I; ; N):(12)
And nally, the activity progress is determined by upper and downer limits as follows:
umax(A) = N
X
i=1 N
X
j=i
iju(Hjj); (13)
umin(A) = N
X
i=1 N
X
j=i
iju(Hii): (14)
For more information about IER algorithm, study Xu et al. [31]. Although implementation of the above algorithm seems to be time consuming, by using Excel software, all the calculations can be quickly done.
To make our model understandable, it is better to have a simple example. Suppose the earned value mea-surement method for activity B is percent complete. The budget of this activity is $10,000. Two project management team members as our decision makers (DM1 & DM2) want to determine the progress (percent complete) of activity at rst measurement point. The evaluation grades are provided in Table 1.
Normalized weight for DM1 (!1) is 0.55 and for
DM2 (!2) is 0.45.
Table 2 shows the assessment of attributes. In this case, DM1 and DM2 estimate the progress of activity B by belief degrees; see Eqs. (1)-(4).
The result of Eqs. (5)-(8) (basic probability masses assigned to the grade interval) is shown in Table 3.
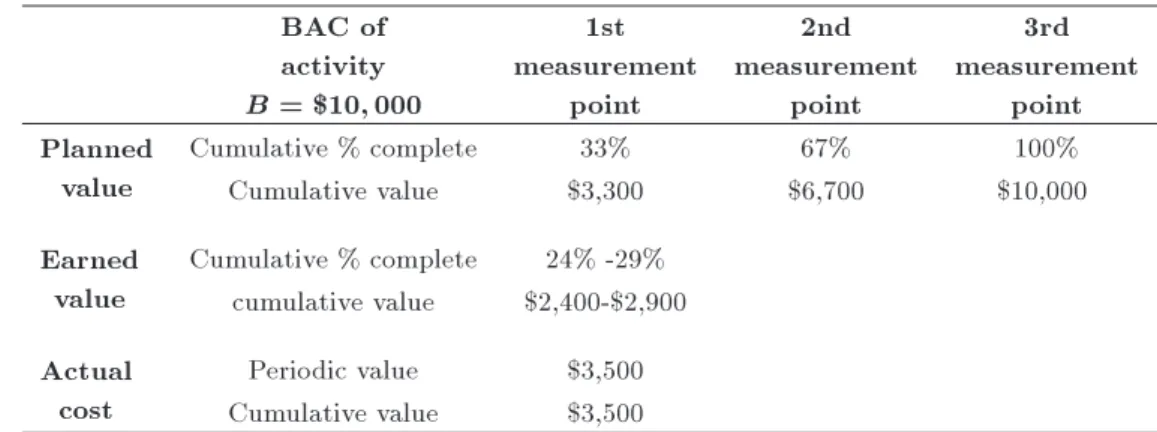
Based on Eqs. (9)-(14), the percent complete is [24% - 29%]. IEV summary of activity B is provided in Table 4.
Table 1. Evaluation grades, grades description, and utility values.
Evaluation grades (H11; ;
H1212)
1 2 3 4 5 6 7 8 9 10 11 12
Grades
description 0% 1%-10% 11%-20% 21%-30% 31%-40% 41%-50% 51%-60% 61%-70% 71%-80% 81%-90% 91%-99% 100% Utility values
u(H11); ;
u(H1212)
Table 2. Belief degrees. Belief degrees
S(A1) DM1f(Hij; ij;DM1); i = 1; ; 12; j = i; ; 12; i jg (3-4, 0.8) (5, 0.2)
S(A2) DM2f(Hij; ij;DM2); i = 1; ; 12; j = i; ; 12; i jg (4, 0.6) (5-6, 0.4)
Table 3. Basic probability masses assigned to the grade interval.
Basic probability masses
DM1 DM134 DM155 DM1H
0:55 0:8 = 0:44 0:55 0:2 = 0:11 0.45
DM2 DM244 DM256 DM2H
0:45 0:6 = 0:27 0:45 0:4 = 0:18 0.55
4.2. Estimating the main earned value management indices and estimates
Now, we can determine the main earned value man-agement indices and estimates by applying IEV in EVM formulae. Because of uncertainties that result in interval earned values, these indices and estimates have to be expressed as interval values, too. Planned Value (PV) is also known as the Budgeted Cost of Work Scheduled (BCWS) and is planned by project management team to be used during the project. Actual Cost (AC) is also known as the Actual Cost of Work Performed (ACWP) and is an indication of the resources that have been used to achieve the actual work performed.
Schedule Variance (SV) SV = EV PV;
SV = [EVmin; EVmax] PV = [SVmin; SVmax]: (15)
Schedule Performance Index (SPI) SPI = EVPV;
SPI = [EVminPV; EVmax] = [SPImin; SPImax]: (16)
Cost Variance (CV) CV = EV AC;
CV = [EVmin; EVmax] AC = [CVmin; CVmax]:
(17) Cost Performance Index (CPI)
CPI = EVAC;
CPI = [EVminAC; EVmax] = [CPImin; CPImax]: (18)
4.3. Interpretation of the main earned value management indices
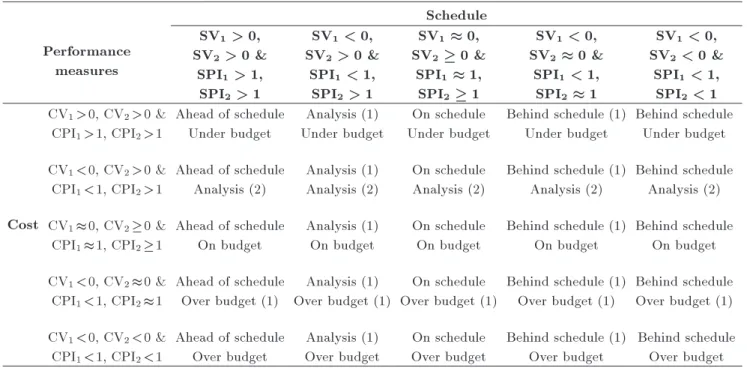
The (EVM) information obtained during project con-trol serves as early warning concon-trol parameters that trigger corrective actions to bring projects back on track in case of problems [32]. The interpretation of SV [SVmin, SVmax], SPI [SPImin, SPImax], CV [CVmin,
CVmax], CPI [CPImin, CPImax] in the proposed model
is provided in Table 5. By extending EV indices in-terpretations in this paper, project management team can make further analysis and incorporate uncertainty in their decisions.
Each project can have its own thresholds and interpretations of EV indices and estimates according to organizational policy, project management strategy, etc., but our model has extended the framework of these interpretations by taking into account lower and upper limits based on the interval earned value.
Table 4. IEV summary of activity B. BAC of
activity B = $10; 000
1st measurement
point
2nd measurement
point
3rd measurement
point Planned
value
Cumulative % complete 33% 67% 100%
Cumulative value $3,300 $6,700 $10,000
Earned value
Cumulative % complete 24% -29% cumulative value $2,400-$2,900 Actual
cost
Periodic value $3,500 Cumulative value $3,500
Table 5. Interpretation of SV, SPI, CV, and CPI in IEV model.
Performance measures
Schedule SV1 > 0,
SV2> 0 &
SPI1> 1,
SPI2> 1
SV1< 0,
SV2 > 0 &
SPI1 < 1,
SPI2> 1
SV1 0,
SV2 0 &
SPI1 1,
SPI2 1
SV1 < 0,
SV2 0 &
SPI1< 1,
SPI2 1
SV1 < 0,
SV2< 0 &
SPI1< 1,
SPI2< 1
Cost
CV1>0, CV2>0 &
CPI1>1, CPI2>1
Ahead of schedule Under budget
Analysis (1) Under budget
On schedule Under budget
Behind schedule (1) Under budget
Behind schedule Under budget CV1<0, CV2>0 &
CPI1<1, CPI2>1
Ahead of schedule Analysis (2)
Analysis (1) Analysis (2)
On schedule Analysis (2)
Behind schedule (1) Analysis (2)
Behind schedule Analysis (2) CV10, CV20 &
CPI11, CPI21
Ahead of schedule On budget
Analysis (1) On budget
On schedule On budget
Behind schedule (1) On budget
Behind schedule On budget CV1<0, CV20 &
CPI1<1, CPI21
Ahead of schedule Over budget (1)
Analysis (1) Over budget (1)
On schedule Over budget (1)
Behind schedule (1) Over budget (1)
Behind schedule Over budget (1) CV1<0, CV2<0 &
CPI1<1, CPI2<1
Ahead of schedule Over budget
Analysis (1) Over budget
On schedule Over budget
Behind schedule (1) Over budget
Behind schedule Over budget
Analysis (1): If (SVmin+SVmax)=2 < 0 or (SPImin+
SPImax)=2 < 1, it should be determined that how
much we are behind schedule. In such cases, further analysis, like monitoring project schedule and critical path, is done, and appropriate corrective action should be taken into account. If (SVmin + SVmax)=2 > 0
or (SPImin+ SPImax)=2 > 1, further analysis is not
needed, unless in some critical conditions. But the project management team should monitor the EVM SV and SPI indices trend more carefully to implement appropriate preventive actions if required.
Analysis (2): If (CVmin + CVmax)=2 < 0 or
(CPImin+CPImax)=2 < 1, it should be determined that
how much we are over budget. In such cases, further analysis like monitoring project budget and activity planned values is done and appropriate corrective action should be taken into account. If (CVmin +
CVmax)=2 > 0 or (CPImin+ CPImax)=2 > 1, further
analysis is not needed, unless in some critical con-ditions. But the project management team should monitor the EVM CV and CPI indices trend more carefully to implement appropriate preventive actions if required.
Behind schedule (1): In such situations, further analysis, like monitoring project schedule and critical path, is done. If required, appropriate corrective action should be taken into account. The project management team should monitor the EVM SV and SPI indices trend more carefully to implement appropriate preven-tive actions if required.
Over budget (1): In such situations, further analy-sis, like monitoring project schedule and critical path, is done. If required, appropriate corrective action should be taken into account. The project management team should monitor the EVM CV and CPI indices trend more carefully to implement appropriate preventive actions if required.
According to Table 5 and EV indices calculation results of our example, SV=[-$900, -$400], SPI=[0.73, 0.88], CV=[-$1100, -$600], CPI=[0.69, 0.83], the activ-ity B is behind schedule and under budget.
4.4. Estimating other earned value management indices
There are other important EVM indices which can help the project management team to study current project progress and predict future of the project. By applying IEV, other EVM indices could be calculated as interval values, which means that uncertainty in the progress of project activities is incorporated.
Estimate To Complete (ETC) ETC =BAC EVCPI ;
ETC =
BAC EVmax
CPImax ;
BAC EVmin
CPImin
= [ETCmin; ETCmax]: (19)
Estimate At Completion (EAC) EAC =BACCPI;
EAC =
BAC CPImax;
BAC CPImin
= [EACmin; EACmax]:
(20) If we assume that EAC will be inuenced by a Per-formance Factor (PF), which is derived of both cost performance and schedule performance or some other parameters decided by project management team, an-other equation to calculate the EAC is:
EACPF= AC + BAC EVPF ;
PF =[CPImin; CPImax]+[SPImin; SPImax]
=[PFmin; PFmax]; (21)
with + = 1; or PF = an estimated performance factor by project management team for doing remain-ing work. Note that if PF is equal to 1, the cost of the remained activities is as planned:
EACPF= AC +
BAC EVmax
PFmax ;
BAC EVmin
PFmin
= [EACmin; EACmax]: (22)
Variance At Completion (VAC) VAC = BAC EAC;
VAC = [(BAC EACmax); (BAC EACmin)]
= [VACmin; VACmax]: (23)
To-Complete Performance Index (TCPI) TCPI(EAC) = BAC EVEAC AC;
TCPI(EAC) =
BAC EV
max
EACmax AC;
BAC EVmin
EACmin AC
= [TCPI(EAC)min; TCPI(EAC)max]; (24) with EACmin6= AC, EACmax6= AC.
The TCPI for achieving BAC is calculated by: TCPI(BAC) = BAC EVBAC AC;
TCPI(BAC) =
BAC EVmax
BAC AC ;
BAC EVmin
BAC AC
= [TCPI(BAC)min; TCPI(BAC)max];
(25) with BAC 6= AC.
4.5. Estimating earned schedule indices by using IEV
The ES concept, as described by Lipke, is as follows. The idea of Earned Schedule is similar to that of Earned Value. However, instead of using cost for measuring schedule performance, we would use time. Earned Schedule is determined by comparing the earned cu-mulative EV to the performance baseline. The time associated with EV, i.e. Earned Schedule, is found from the PV S-curve. This concept of projecting EV onto PV is not truly new. It is illustrated in many books dealing with EVM. The signicance of using the Earned Schedule concept is that the associated schedule indicators behave appropriately throughout the entire period of project performance.
The formulae used for earned schedule are:
ES = C + I; I = EV PVC
PVC+1 PVC;
where C is the number of time increments of the PMB for which EV is greater than or equal to PV; and I is the calculation for the fraction of the subsequent PV increment.
ESperiodn= ESn ESn 1;
where n is the number of time periods from the beginning of the project.
Schedule Variance (time) is obtained by the fol-lowing equation:
SVt= ES AT:
Schedule Performance Index (time) is obtained by the following equation:
SPIt= ATES;
where AT is the Actual Time.
The ES Planned Duration for Work Remaining (PDWR) is:
PDWR = PD EScum:
PD is the Planned duration for the project.
To determine the future schedule eciency re-quired to achieve projected schedule outcomes, the ES \to complete" indices, which are similar to the EVM TCPI for cost, are:
TSPI = PD ATPD ES:
ES provides two formulae for statistically predicting an Independent Estimate At Complete time (IEACt):
IEACt=SPIPD t;
IEACt= ES + PDWRPF t :
PFt is a time-based performance factor. So that the
Independent Estimate of Completion Date (IECD) would be:
IECD = Project Start Date + IEACt:
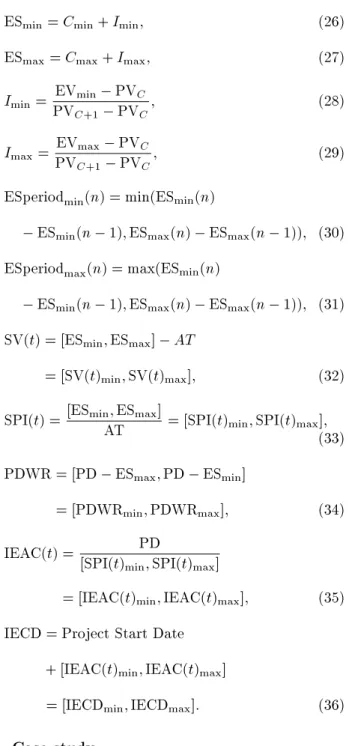
In our proposed model, because of the interval value of EV, we should use the following formula:
ESmin= Cmin+ Imin; (26)
ESmax= Cmax+ Imax; (27)
Imin=PVEVmin PVC
C+1 PVC; (28)
Imax= PVEVmax PVC
C+1 PVC; (29)
ESperiodmin(n) = min(ESmin(n)
ESmin(n 1); ESmax(n) ESmax(n 1)); (30)
ESperiodmax(n) = max(ESmin(n)
ESmin(n 1); ESmax(n) ESmax(n 1)); (31)
SV(t) = [ESmin; ESmax] AT
= [SV(t)min; SV(t)max]; (32)
SPI(t) =[ESminAT; ESmax] = [SPI(t)min; SPI(t)max];
(33) PDWR = [PD ESmax; PD ESmin]
= [PDWRmin; PDWRmax]; (34)
IEAC(t) = [SPI(t) PD
min; SPI(t)max]
= [IEAC(t)min; IEAC(t)max]; (35)
IECD = Project Start Date + [IEAC(t)min; IEAC(t)max]
= [IECDmin; IECDmax]: (36)
5. Case study
In this section, an example is studied to illustrate the basis of the new evidential reasoning based EV calcu-lations. The project is designing and manufacturing
an engineering model of Reaction Wheel, which is a module in ADCS sub-system of a satellite design and manufacturing program called Sat-1.
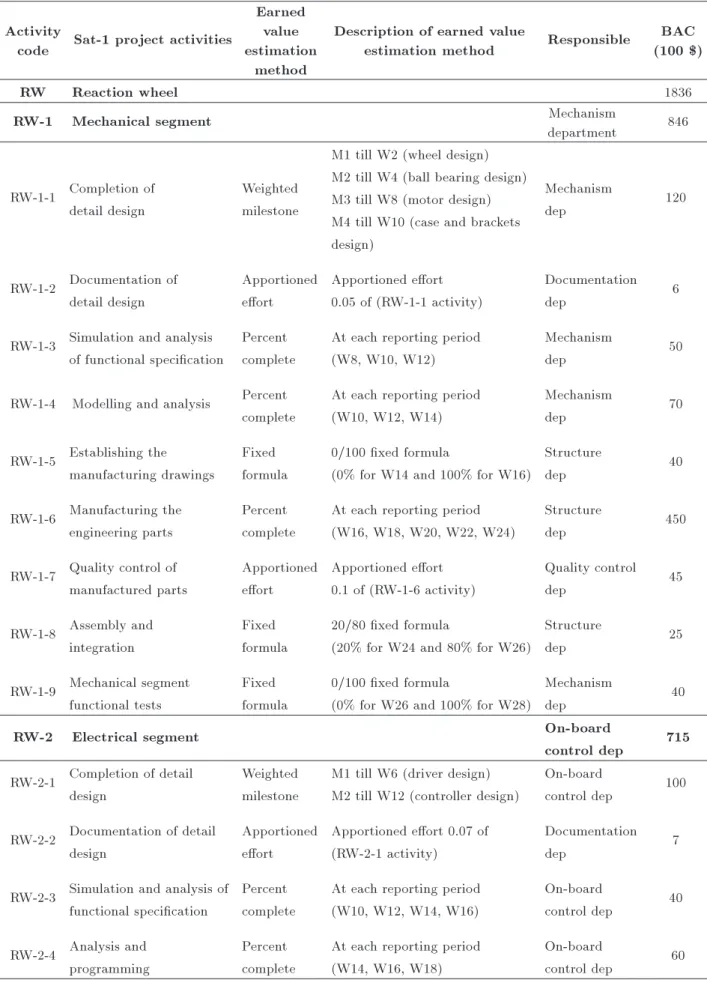
The Earned Value reporting period is every two weeks and this project has 18 planned reporting pe-riods. The current date is on week 22 reporting period. The information about activities is available in Table 6.
As it is clear, our method is useful in EV estima-tion of activities with Percent Complete EV Estimaestima-tion Method, RW-1-3, RW-1-4, RW-1-6, 3, RW-2-4, and RW-2-6. The calculation of Activity RW-1-3 EV is shown in Table 7. In this case, there are two decision makers who are the mechanical manager and project manager, each having their own estimation of EV based on belief degrees. Beside these DMs, for other activities, decision makers are On-Board Computer Manager (OBC Man), Structure Manager (STR Man), and Electrical Manager (ELC Man). Other IEV calculations for activities are presented in Appendix A.
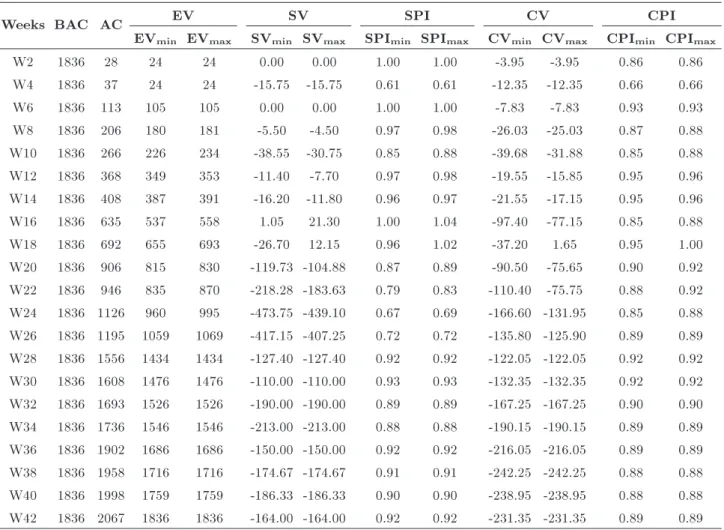
The result of EV calculation for RW Project is shown in Tables 8 and 9. Because of uncertainty in EV estimation for just 6 activities among RW project activities, the uncertainty of overall project EV indices and estimates is low. The wider an interval is, the greater the uncertainty associated with that measurement will be. It is clear that because of real data outbreak, the closer the project to its end, the lower uncertainties in the overall EV indices and estimates. Since the RW project management team has considered uncertainties in EV estimation, they are more condent about the EVM results.
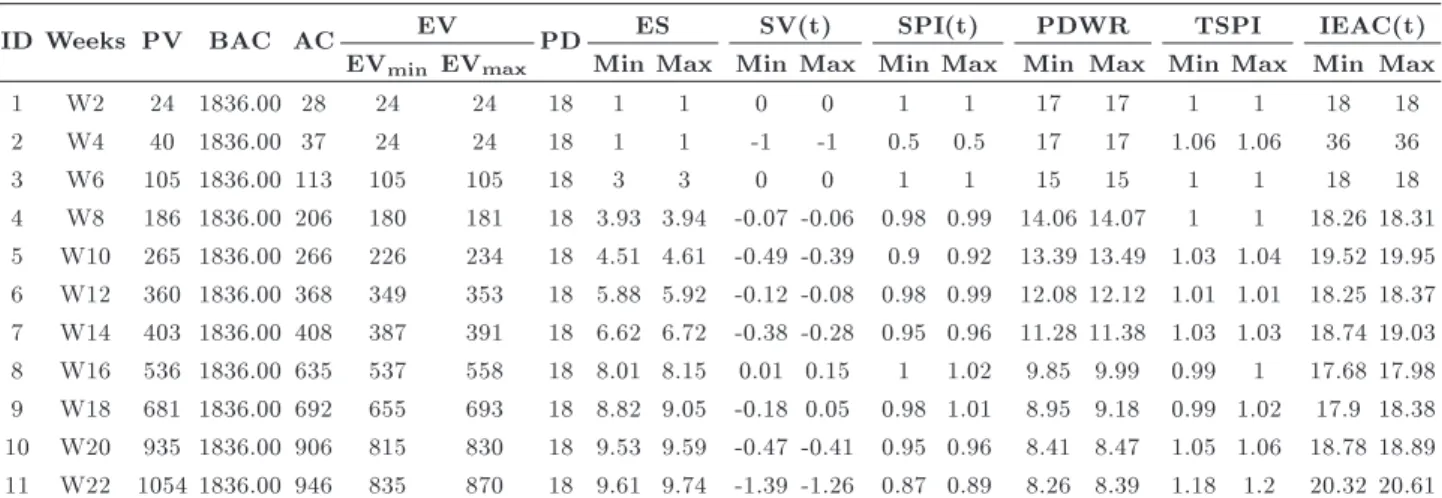
The Earned Schedule calculation results are pro-vided in Table 10. In period 11 (Week 22), the planned value is 1054 and The IEV calculation in ES Concept is depicted in Figure 1. Because of IEV, our
Figure 1. The IEV calculation in ES Concept at period 11.
Table 6. Reaction wheel project activities description. Activity
code Sat-1 project activities
Earned value estimation
method
Description of earned value
estimation method Responsible
BAC (100 $)
RW Reaction wheel 1836
RW-1 Mechanical segment Mechanism
department 846
RW-1-1 Completion of detail design
Weighted milestone
M1 till W2 (wheel design) M2 till W4 (ball bearing design) M3 till W8 (motor design) M4 till W10 (case and brackets design)
Mechanism
dep 120
RW-1-2 Documentation of detail design
Apportioned eort
Apportioned eort 0.05 of (RW-1-1 activity)
Documentation
dep 6
RW-1-3 Simulation and analysis of functional specication
Percent complete
At each reporting period (W8, W10, W12)
Mechanism
dep 50
RW-1-4 Modelling and analysis Percent complete
At each reporting period (W10, W12, W14)
Mechanism
dep 70
RW-1-5 Establishing the manufacturing drawings
Fixed formula
0/100 xed formula
(0% for W14 and 100% for W16)
Structure
dep 40
RW-1-6 Manufacturing the engineering parts
Percent complete
At each reporting period (W16, W18, W20, W22, W24)
Structure
dep 450
RW-1-7 Quality control of manufactured parts
Apportioned eort
Apportioned eort 0.1 of (RW-1-6 activity)
Quality control
dep 45
RW-1-8 Assembly and integration
Fixed formula
20/80 xed formula
(20% for W24 and 80% for W26)
Structure
dep 25
RW-1-9 Mechanical segment functional tests
Fixed formula
0/100 xed formula
(0% for W26 and 100% for W28)
Mechanism
dep 40
RW-2 Electrical segment On-board
control dep 715 RW-2-1 Completion of detail
design
Weighted milestone
M1 till W6 (driver design) M2 till W12 (controller design)
On-board
control dep 100 RW-2-2 Documentation of detail
design
Apportioned eort
Apportioned eort 0.07 of (RW-2-1 activity)
Documentation
dep 7
RW-2-3 Simulation and analysis of functional specication
Percent complete
At each reporting period (W10, W12, W14, W16)
On-board
control dep 40 RW-2-4 Analysis and
programming
Percent complete
At each reporting period (W14, W16, W18)
On-board
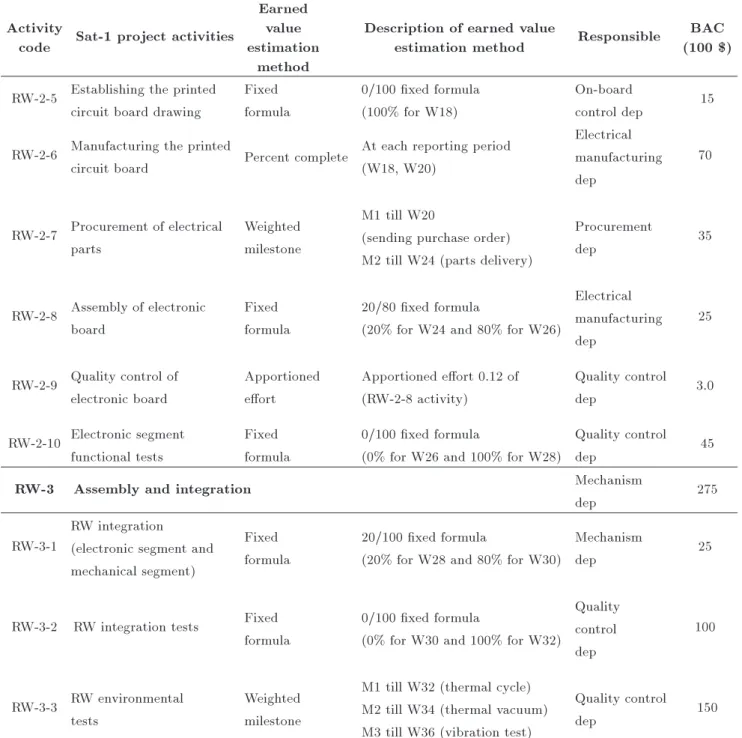
Table 6. Reaction wheel project activities description (continued). Activity
code Sat-1 project activities
Earned value estimation
method
Description of earned value
estimation method Responsible
BAC (100 $)
RW-2-5 Establishing the printed circuit board drawing
Fixed formula
0/100 xed formula (100% for W18)
On-board
control dep 15 RW-2-6 Manufacturing the printed
circuit board Percent complete
At each reporting period (W18, W20)
Electrical manufacturing dep
70
RW-2-7 Procurement of electrical parts
Weighted milestone
M1 till W20
(sending purchase order) M2 till W24 (parts delivery)
Procurement
dep 35
RW-2-8 Assembly of electronic board
Fixed formula
20/80 xed formula
(20% for W24 and 80% for W26)
Electrical manufacturing dep
25
RW-2-9 Quality control of electronic board
Apportioned eort
Apportioned eort 0.12 of (RW-2-8 activity)
Quality control
dep 3.0
RW-2-10 Electronic segment functional tests
Fixed formula
0/100 xed formula
(0% for W26 and 100% for W28)
Quality control
dep 45
RW-3 Assembly and integration Mechanism
dep 275
RW-3-1
RW integration (electronic segment and mechanical segment)
Fixed formula
20/100 xed formula
(20% for W28 and 80% for W30)
Mechanism
dep 25
RW-3-2 RW integration tests Fixed formula
0/100 xed formula
(0% for W30 and 100% for W32)
Quality control dep
100
RW-3-3 RW environmental tests
Weighted milestone
M1 till W32 (thermal cycle) M2 till W34 (thermal vacuum) M3 till W36 (vibration test)
Quality control
dep 150
model has introduced Interval Earned Schedule (IES) incorporating uncertainties into crisp estimated earned schedule value.
6. Conclusion
Measuring the Earned Value (EV) is one of the most important parts of earned value management technique implementation. The simplest and mostly used method in EV measurement is Percent Complete. Because of subjective judgment of this method in estimation of completed work, this paper incorporated evidential
reasoning approach to model EV measurement uncer-tainties in real project data. This paper explained how the IEV (Interval Earned Value) and other EVM indices and estimates can be developed by using ER approach.
Future research can focus on studying estimation of other EV measurement methods, such as physical measurement and weighted milestone in evidential rea-soning space. On the other hand, evidential rearea-soning can also be applicable in estimating other EVM param-eters like Planned Value (PV) and Planned Duration (PD) estimation.
Table 7. Calculation of activity RW-1-3 earned value. RW-1-3: Simulation and analysis of
functional specication Budget At completion (100 $): 50
Percent
complete Earned value
Weight W8 M1 Hij ij Hij ij DM144 DM155 Min Max Min Max
0.6 MC Man DM1 4 0.6 5 0.4 0.36 0.24 0.26 0.28 13.00 14.00
DM234 DM155
0.4 PRJ Man DM2 3-4 0.75 5 0.25 0.3 0.1
Weight W10 M2 Hij ij Hij ij DM189 DM11010
0.6 MC Man DM1 8-9 0.5 10 0.5 0.3 0.3 0.71 0.75 35.50 37.50
DM278 DM199
0.4 PRJ Man DM2 7-8 0.6 9 0.4 0.24 0.16
Weight W12 M3 Hij ij Hij ij DM11010 DM11111
0.6 MC Man DM1 10 0.7 11 0.3 0.42 0.18 0.87 0.89 43.50 44.50
DM21011
0.4 PRJ Man DM2 10-11 1 0.4
Weight W14 M4 Hij ij DM11212
0.6 MC Man DM1 12 1 0.6 1.00 1.00 50.00 50.00
DM21212
0.4 PRJ Man DM2 12 1 0.4
Table 8. Results of RW project earned value calculation (main EVM indices).
Weeks BAC AC EV SV SPI CV CPI
EVmin EVmax SVmin SVmax SPImin SPImax CVmin CVmax CPImin CPImax
W2 1836 28 24 24 0.00 0.00 1.00 1.00 -3.95 -3.95 0.86 0.86
W4 1836 37 24 24 -15.75 -15.75 0.61 0.61 -12.35 -12.35 0.66 0.66
W6 1836 113 105 105 0.00 0.00 1.00 1.00 -7.83 -7.83 0.93 0.93
W8 1836 206 180 181 -5.50 -4.50 0.97 0.98 -26.03 -25.03 0.87 0.88 W10 1836 266 226 234 -38.55 -30.75 0.85 0.88 -39.68 -31.88 0.85 0.88 W12 1836 368 349 353 -11.40 -7.70 0.97 0.98 -19.55 -15.85 0.95 0.96 W14 1836 408 387 391 -16.20 -11.80 0.96 0.97 -21.55 -17.15 0.95 0.96 W16 1836 635 537 558 1.05 21.30 1.00 1.04 -97.40 -77.15 0.85 0.88 W18 1836 692 655 693 -26.70 12.15 0.96 1.02 -37.20 1.65 0.95 1.00 W20 1836 906 815 830 -119.73 -104.88 0.87 0.89 -90.50 -75.65 0.90 0.92 W22 1836 946 835 870 -218.28 -183.63 0.79 0.83 -110.40 -75.75 0.88 0.92 W24 1836 1126 960 995 -473.75 -439.10 0.67 0.69 -166.60 -131.95 0.85 0.88 W26 1836 1195 1059 1069 -417.15 -407.25 0.72 0.72 -135.80 -125.90 0.89 0.89 W28 1836 1556 1434 1434 -127.40 -127.40 0.92 0.92 -122.05 -122.05 0.92 0.92 W30 1836 1608 1476 1476 -110.00 -110.00 0.93 0.93 -132.35 -132.35 0.92 0.92 W32 1836 1693 1526 1526 -190.00 -190.00 0.89 0.89 -167.25 -167.25 0.90 0.90 W34 1836 1736 1546 1546 -213.00 -213.00 0.88 0.88 -190.15 -190.15 0.89 0.89 W36 1836 1902 1686 1686 -150.00 -150.00 0.92 0.92 -216.05 -216.05 0.89 0.89 W38 1836 1958 1716 1716 -174.67 -174.67 0.91 0.91 -242.25 -242.25 0.88 0.88 W40 1836 1998 1759 1759 -186.33 -186.33 0.90 0.90 -238.95 -238.95 0.88 0.88 W42 1836 2067 1836 1836 -164.00 -164.00 0.92 0.92 -231.35 -231.35 0.89 0.89
Table 9. Results of RW project earned value calculation (other EVM indices).
Weeks
EAC (BAC/CPI)
TCPI (EAC)
TCPI
(BAC) ETC
PF (0.6 CPI+
0.4 SPI)
EAC
AC+(BAC-EV)/PF
EACmin EACmax Min Max Min Max Min Max Min Max Min Max
W2 2136.30 2136.30 0.86 0.86 1.00 1.00 2108.20 2108.20 0.916 0.916 2,006.17 2,006.17 W4 2774.91 2774.91 0.66 0.66 1.01 1.01 2738.41 2738.41 0.64 0.64 2,868.25 2,868.25 W6 1972.69 1972.69 0.93 0.93 1.00 1.00 1859.69 1859.69 0.958 0.958 1,919.89 1,919.89 W8 2089.73 2101.33 0.87 0.88 1.02 1.02 1883.58 1895.18 0.91 0.92 2,004.91 2,025.78 W10 2086.22 2158.19 0.85 0.88 1.02 1.03 1820.42 1892.39 0.85 0.88 2,086.45 2,160.12 W12 1918.55 1938.91 0.94 0.96 1.01 1.01 1550.20 1570.56 0.958 0.968 1,900.02 1,920.19 W14 1916.53 1938.34 0.94 0.96 1.01 1.02 1508.38 1530.19 0.954 0.964 1,906.96 1,926.87 W16 2090.08 2168.86 0.83 0.89 1.06 1.08 1455.43 1534.21 0.91 0.944 1,988.81 2,062.47 W18 1831.63 1940.35 0.92 1.04 1.00 1.03 1139.88 1248.60 0.954 1.008 1,825.93 1,929.95 W20 2003.34 2039.84 0.89 0.93 1.08 1.10 1097.69 1134.19 0.888 0.908 2,013.93 2,055.77 W22 1995.85 2078.63 0.85 0.95 1.09 1.12 1050.05 1132.83 0.844 0.884 2,038.76 2,132.02 W24 2079.60 2154.67 0.82 0.92 1.19 1.23 953.15 1028.22 0.778 0.804 2,172.02 2,251.96 W26 2052.28 2071.47 0.88 0.91 1.20 1.21 857.63 876.82 0.822 0.822 2,128.09 2,140.26 W28 1992.31 1992.31 0.92 0.92 1.44 1.44 436.66 436.66 0.92 0.92 1,992.96 1,992.96 W30 2000.63 2000.63 0.92 0.92 1.58 1.58 392.28 392.28 0.924 0.924 1,997.61 1,997.61 W32 2037.23 2037.23 0.90 0.90 2.17 2.17 343.98 343.98 0.896 0.896 2,038.98 2,038.98 W34 2061.82 2061.82 0.89 0.89 2.90 2.90 325.67 325.67 0.886 0.886 2,063.31 2,063.31 W36 2071.27 2071.27 0.89 0.89 -2.27 -2.27 169.22 169.22 0.902 0.902 2,068.30 2,068.30 W38 2095.19 2095.19 0.88 0.88 -0.98 -0.98 136.94 136.94 0.892 0.892 2,092.53 2,092.53 W40 2085.41 2085.41 0.88 0.88 -0.48 -0.48 87.46 87.46 0.888 0.888 2,084.71 2,084.71 W42 2067.35 2067.35 0.00 0.00 0.00 0.00 0.00 0.00 0.902 0.902 2,067.00 2,067.00
Table 10. Earned schedule calculation results until period 11.
ID Weeks PV BAC AC EV PD ES SV(t) SPI(t) PDWR TSPI IEAC(t)
EVmin EVmax Min Max Min Max Min Max Min Max Min Max Min Max
1 W2 24 1836.00 28 24 24 18 1 1 0 0 1 1 17 17 1 1 18 18
2 W4 40 1836.00 37 24 24 18 1 1 -1 -1 0.5 0.5 17 17 1.06 1.06 36 36
3 W6 105 1836.00 113 105 105 18 3 3 0 0 1 1 15 15 1 1 18 18
4 W8 186 1836.00 206 180 181 18 3.93 3.94 -0.07 -0.06 0.98 0.99 14.06 14.07 1 1 18.26 18.31 5 W10 265 1836.00 266 226 234 18 4.51 4.61 -0.49 -0.39 0.9 0.92 13.39 13.49 1.03 1.04 19.52 19.95 6 W12 360 1836.00 368 349 353 18 5.88 5.92 -0.12 -0.08 0.98 0.99 12.08 12.12 1.01 1.01 18.25 18.37 7 W14 403 1836.00 408 387 391 18 6.62 6.72 -0.38 -0.28 0.95 0.96 11.28 11.38 1.03 1.03 18.74 19.03 8 W16 536 1836.00 635 537 558 18 8.01 8.15 0.01 0.15 1 1.02 9.85 9.99 0.99 1 17.68 17.98 9 W18 681 1836.00 692 655 693 18 8.82 9.05 -0.18 0.05 0.98 1.01 8.95 9.18 0.99 1.02 17.9 18.38 10 W20 935 1836.00 906 815 830 18 9.53 9.59 -0.47 -0.41 0.95 0.96 8.41 8.47 1.05 1.06 18.78 18.89 11 W22 1054 1836.00 946 835 870 18 9.61 9.74 -1.39 -1.26 0.87 0.89 8.26 8.39 1.18 1.2 20.32 20.61
References
1. PMI, Project Management Body of Knowledge (PM-BOK), Project Management Institute Publication (2008).
2. PMI, Practice Standard for Earned Value Manage-ment, PMI Publication (2011).
3. Plaza, M. and Turetken, O. \A model-based DSS for
integrating the impact of learning in project control", Decision Support Systems, 47, pp. 488-499 (2009). 4. Cio, D.F. \Designing project management: A
scien-tic notation and an improved formalism for earned value calculations", International Journal of Project Management, 24, pp. 136-144 (2006).
Project Management, 3rd Ed., Project Management Institute, Newton Square, Pennsylvania (2000). 6. Kerzner, H., Project Management: A Systems
Ap-proach to Planning, Scheduling and Controlling, 10th Ed. John Wiley and Sons, Inc., New York (2009). 7. Mirzazadeh, A. and Safari, M. \Project risks
assess-ment by using mathematical theory of evidence under uncertainty conditions", Fourth International Confer-ence of Project Management, Tehran, Iran, August, pp. 19-20 (2008).
8. Anbari, F.T. \Earned value project management method and extensions", Project Management Jour-nal, 34(4), pp. 12-23 (2003).
9. Kim, E.H., Wells Jr, W.G. and Duey, M.R. \A model for eective implementation of earned value management methodology", International Journal of Project Management, 21, pp. 375-382 (2003).
10. Pajares, J. and Lopez-Paredes, A. \An extension of the EVM analysis for project monitoring: The cost control index and the schedule control index", International Journal of Project Management, 29, pp. 615-621 (2011).
11. Moslemi, N.L., Shadrokh, S. and Salehipour, A. \A fuzzy approach for the earned value management", International Journal of Project Management, 29(6), pp. 764-772 (2011).
12. Maravas, A. and Pantouvakis, J.P. \Project cash ow analysis in the presence of uncertainty in activity duration and cost", International Journal of Project Management, 30, pp. 374-384 (2012).
13. Bagherpour, M., Zareei, A., Noori, S. and Heydari, M. \Designing a control mechanism using earned value analysis: an application to production environment", The International Journal of Advanced Manufacturing Technology, 49, pp. 419-429 (2010).
14. Ponz-Tienda, J.L., Pellicer, E. and Yepes, V. \Com-plete fuzzy scheduling and fuzzy earned value manage-ment in construction projects", Journal of Zhejiang University - Science A (Applied Physics & Engineer-ing), 13(1), pp. 56-68 (2012).
15. Lipke, W., Zwikael, O., Henderson, K. and Anbari, F. \Prediction of project outcome, the application of statistical methods to earned value management and earned schedule performance indexes", Interna-tional Journal of Project Management, 27, pp. 400-407 (2009).
16. Lipke, W. \Schedule is dierent", The Measurable News, pp. 31-34 (2003).
17. Vandevoorde, S. and Vanhoucke, M. \A comparison of dierent project duration forecasting methods using earned value metrics", International Journal of Project Management, 24, pp. 289-302 (2006).
18. Henderson, K. \Earned schedule: a breakthrough extension to earned value theory? A retrospectiveanal-ysis of real project data", The Measurable News, pp. 13-23 (2003).
19. Henderson, K. \Further developments in earned sched-ule", The Measurable News, pp. 15-22 (2004).
20. Hunter, H., Fitzgerald, R. and Barlow, D. \Improved cost monitoring and control through the earned value management system", Acta Astronautica, 93, pp. 497-500 (2014).
21. Acebes. F., Pajares, J., Galan, J.M. and Lopez-Paredes, A. \Beyond earned value management: A graphical framework for integrated cost, schedule and risk monitoring", Procedia - Social and Behavioral Sciences, 74, pp. 181-189 (2013).
22. Kamooshi, H. and Golafshani, H. \EDM: Earned duration management, a new approach to schedule performance management and measurement", Inter-national Journal of Project Management, 32(6), pp. 1019-1044 (2014).
23. Xu, D.L. and Yang, J.B., Introduction to Multi-Criteria Decision Making and the Evidential Reasoning Approach, Manchester School of Management, Univer-sity of Manchester Institute of Science and Technology, PO Box 88, Manchester M60 1QD (2001).
24. Yang, J.B. \Rule and utility based evidential reason-ing approach for multiple attribute decision analysis under uncertainty", European Journal of Operational Research, 131(1), pp. 31-61 (2001).
25. Chin, K.S., Xu, D.L., Yang, J.B. and Lam, J.P.K. \Group-based ER-AHP system for product project screening", Expert Systems with Applications, 35(4), pp. 1909-1929 (2008).
26. Guo, M., Yang, J.B., Chin, K.S. and Wang, H. \Evidential reasoning based preference programming for multiple attribute decision analysis under uncer-tainty", European Journal of Operational Research, 182, pp. 1294-1312 (2007).
27. Beynon, M., Curry, B. and Morgan, P. \The Dempster-Shafer theory of evidence: an alternative approach to multicriteria decision modelling", Omega, 28, pp. 37-50 (2000).
28. Liu, H.C., Liu, L., Bian, Q.H., Lin, Q.L., Dong, N. and Xu, P.C. \Failure mode and eects analysis using fuzzy evidential reasoning approach and grey theory", Expert System With Applications, 38, pp. 4403-4415 (2011).
29. Fu, C. and Yang, S. \An evidential reasoning based consensus model for multiple attribute group decision analysis problems with interval-valued group consen-sus requirements", European Journal of Operational Research, 223, pp. 167-176 (2012).
30. Fu, C. and Yang, S. \The combination of dependence-based interval-valued evidential reasoning approach with balanced scorecard for performance assessment", Expert Systems with Applications, 39, pp. 3717-3730 (2012).
31. Xu, D.L., Yang, J.B. and Wang, Y.M. \The evidential reasoning approach for multi-attribute decision anal-ysis under interval uncertainty", European Journal of
Operational Research, 174(3), pp. 1914-1943 (2006). 32. Vanhoucke, M. \Measuring the eciency of project
control using ctitious and empirical project data", International Journal of Project Management, 30, pp. 252-263 (2012).
Appendix A
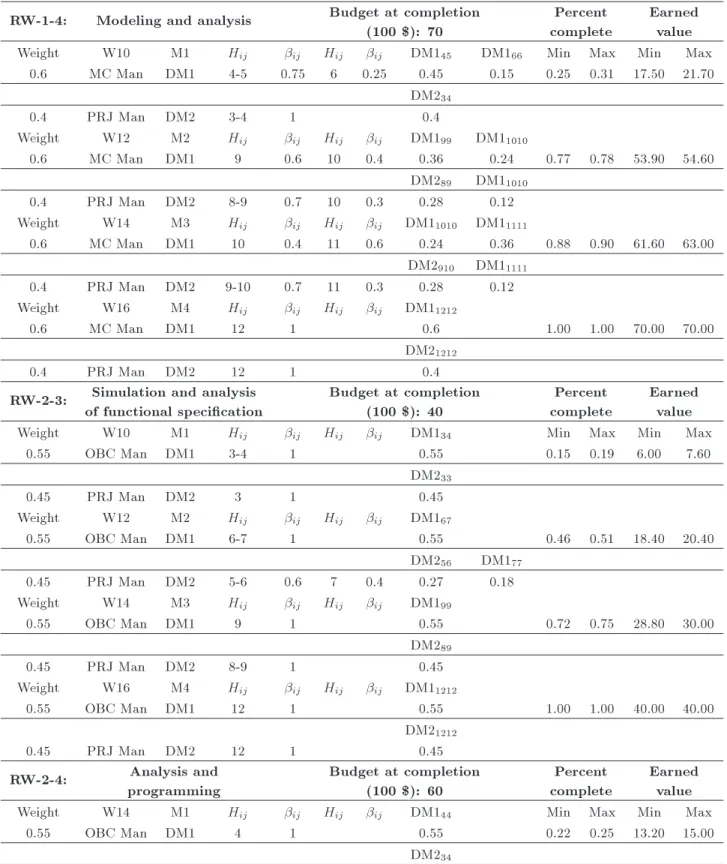
Activity IEV calculations
Table A.1 presents the results of EV and percent complete of IEV calculations.
Table A.1. Results of EV and percent complete of IEV calculations. RW-1-4: Modeling and analysis Budget at completion
(100 $): 70
Percent complete
Earned value
Weight W10 M1 Hij ij Hij ij DM145 DM166 Min Max Min Max
0.6 MC Man DM1 4-5 0.75 6 0.25 0.45 0.15 0.25 0.31 17.50 21.70
DM234
0.4 PRJ Man DM2 3-4 1 0.4
Weight W12 M2 Hij ij Hij ij DM199 DM11010
0.6 MC Man DM1 9 0.6 10 0.4 0.36 0.24 0.77 0.78 53.90 54.60
DM289 DM11010
0.4 PRJ Man DM2 8-9 0.7 10 0.3 0.28 0.12
Weight W14 M3 Hij ij Hij ij DM11010 DM11111
0.6 MC Man DM1 10 0.4 11 0.6 0.24 0.36 0.88 0.90 61.60 63.00
DM2910 DM11111
0.4 PRJ Man DM2 9-10 0.7 11 0.3 0.28 0.12
Weight W16 M4 Hij ij Hij ij DM11212
0.6 MC Man DM1 12 1 0.6 1.00 1.00 70.00 70.00
DM21212
0.4 PRJ Man DM2 12 1 0.4
RW-2-3: Simulation and analysis of functional specication
Budget at completion (100 $): 40
Percent complete
Earned value
Weight W10 M1 Hij ij Hij ij DM134 Min Max Min Max
0.55 OBC Man DM1 3-4 1 0.55 0.15 0.19 6.00 7.60
DM233
0.45 PRJ Man DM2 3 1 0.45
Weight W12 M2 Hij ij Hij ij DM167
0.55 OBC Man DM1 6-7 1 0.55 0.46 0.51 18.40 20.40
DM256 DM177
0.45 PRJ Man DM2 5-6 0.6 7 0.4 0.27 0.18
Weight W14 M3 Hij ij Hij ij DM199
0.55 OBC Man DM1 9 1 0.55 0.72 0.75 28.80 30.00
DM289
0.45 PRJ Man DM2 8-9 1 0.45
Weight W16 M4 Hij ij Hij ij DM11212
0.55 OBC Man DM1 12 1 0.55 1.00 1.00 40.00 40.00
DM21212
0.45 PRJ Man DM2 12 1 0.45
RW-2-4: Analysis and programming
Budget at completion (100 $): 60
Percent complete
Earned value
Weight W14 M1 Hij ij Hij ij DM144 Min Max Min Max
0.55 OBC Man DM1 4 1 0.55 0.22 0.25 13.20 15.00
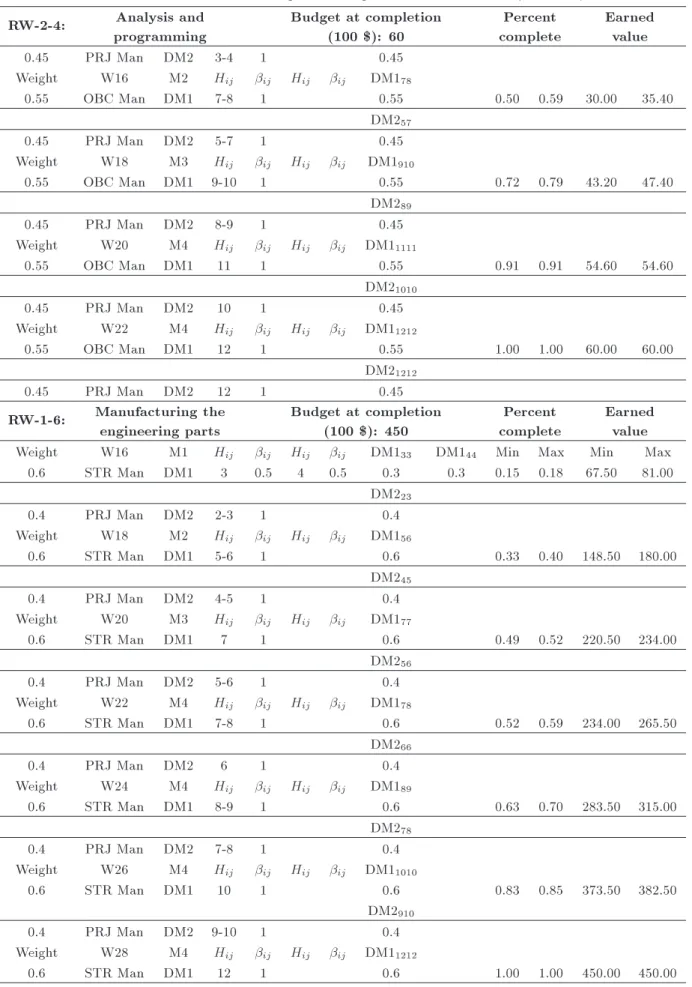
Table A.1. Results of EV and percent complete of IEV calculations (continued). RW-2-4: Analysis and
programming
Budget at completion (100 $): 60
Percent complete
Earned value
0.45 PRJ Man DM2 3-4 1 0.45
Weight W16 M2 Hij ij Hij ij DM178
0.55 OBC Man DM1 7-8 1 0.55 0.50 0.59 30.00 35.40
DM257
0.45 PRJ Man DM2 5-7 1 0.45
Weight W18 M3 Hij ij Hij ij DM1910
0.55 OBC Man DM1 9-10 1 0.55 0.72 0.79 43.20 47.40
DM289
0.45 PRJ Man DM2 8-9 1 0.45
Weight W20 M4 Hij ij Hij ij DM11111
0.55 OBC Man DM1 11 1 0.55 0.91 0.91 54.60 54.60
DM21010
0.45 PRJ Man DM2 10 1 0.45
Weight W22 M4 Hij ij Hij ij DM11212
0.55 OBC Man DM1 12 1 0.55 1.00 1.00 60.00 60.00
DM21212
0.45 PRJ Man DM2 12 1 0.45
RW-1-6: Manufacturing the engineering parts
Budget at completion (100 $): 450
Percent complete
Earned value Weight W16 M1 Hij ij Hij ij DM133 DM144 Min Max Min Max
0.6 STR Man DM1 3 0.5 4 0.5 0.3 0.3 0.15 0.18 67.50 81.00
DM223
0.4 PRJ Man DM2 2-3 1 0.4
Weight W18 M2 Hij ij Hij ij DM156
0.6 STR Man DM1 5-6 1 0.6 0.33 0.40 148.50 180.00
DM245
0.4 PRJ Man DM2 4-5 1 0.4
Weight W20 M3 Hij ij Hij ij DM177
0.6 STR Man DM1 7 1 0.6 0.49 0.52 220.50 234.00
DM256
0.4 PRJ Man DM2 5-6 1 0.4
Weight W22 M4 Hij ij Hij ij DM178
0.6 STR Man DM1 7-8 1 0.6 0.52 0.59 234.00 265.50
DM266
0.4 PRJ Man DM2 6 1 0.4
Weight W24 M4 Hij ij Hij ij DM189
0.6 STR Man DM1 8-9 1 0.6 0.63 0.70 283.50 315.00
DM278
0.4 PRJ Man DM2 7-8 1 0.4
Weight W26 M4 Hij ij Hij ij DM11010
0.6 STR Man DM1 10 1 0.6 0.83 0.85 373.50 382.50
DM2910
0.4 PRJ Man DM2 9-10 1 0.4
Weight W28 M4 Hij ij Hij ij DM11212
Table A.1. Results of EV and percent complete of IEV calculations (continued). RW-1-6: Manufacturing the
engineering parts
Budget at completion (100 $): 450
Percent complete
Earned value DM21212
0.4 PRJ Man DM2 12 1 0.4
RW-2-6: Manufacturing the printed circuit board
Budget at completion (100 $): 70
Percent complete
Earned value Weight W18 M1 Hij ij Hij ij DM11010 Min Max Min Max
0.55 ELM Man DM1 10 1 0.55 0.82 0.85 57.40 59.50
DM2910
0.45 PRJ Man DM2 9-10 1 0.45
Weight W20 M2 Hij ij Hij ij DM11212
0.55 ELM Man DM1 12 1 0.55 1.00 1.00 70.00 70.00
DM21212
0.45 PRJ Man DM2 12 1 0.45
Biographies
Hamidreza Forouzanpour received his MSc in In-dustrial Engineering from Kharazmi University, De-partment of Industrial Engineering, Tehran, Iran. His interested research areas are: uncertain conditions, in-ventory control, multiple criteria decision making, etc. Abolfazl Mirzazadeh is an Associate Professor of Industrial Engineering at Kharazmi University, Iran. He obtained his PhD degree from Amirkabir University of Technology, Iran. His interested research areas are: uncertain decision making, production/inventory control, supply and operations management, devel-opment of quality management and problem-solving tools, and stochastic processes. He has more than 40 research papers, published or forthcoming, in jour-nals such as International Journal of Systems Science, Computers and Mathematics with Applications, Ap-plied Mathematical Modeling, International Journal of Advanced Manufacturing Technology, Proc. IMcheE Part B: Journal of Engineering Manufacture,
Interna-tional Journal of Management Science and Engineering Management, International Journal of Industrial Engi-neering Computations, etc. Also, He has more than 35 international conference papers. He earned the second rank on the inationary inventory research in Scopus Report on January, 2014. He is now Editor-in-Chief of the International Journal of Supply and Operations Management.
Sara Nodoust received the MSc degree in Industrial Engineering from Kharazmi University, Iran. Her interested research backgrounds are: inventory control, uncertain evidential reasoning decision making, opti-mization, reliability, multi attribute decision making, development of quality management, and problem-solving tools. She has several research papers published or under review in journals like International Journal of Production Economics, Journal of Scientic on-line publishing Transactions on Applied Mathematics, Journals of Hindawi Publications, Journal of Academic Science, Segment journals, and several accepted confer-ence papers.