ISSN: 2252-8938, DOI: 10.11591/ijai.v8.i4.pp375-381 375
Feature selection for human membrane protein type classification using
filter methods
Glenda Anak Kaya, Nor Ashikin Mohamad Kamal
Faculty of Computer and Mathematical Sciences, Universiti Teknologi MARA, Shah Alam, Selangor
Article Info ABSTRACT
Article history: Received Jul 22, 2019 Revised Oct 2, 2019 Accepted Oct 16, 2019
As the number of protein sequences in the database is increasing, effective and efficient techniques are needed to make these data meaningful. These protein sequences contain redundant and irrelevant features that cause lower classification accuracy and increase the running time of the computational algorithm. In this paper, we select the best features using Minimum Redundancy Maximum Relevance (mRMR) and Correlation-based feature selection (CFS) methods. Two datasets of human membrane protein are used, S1 and S2. After the features have been selected by mRMR and CFS, K-Nearest Neighbor (KNN) and Support Vector Machine (SVM) classifiers are used to classify these membrane proteins. The performance of these techniques is measured using accuracy, specificity and sensitivity. and F-measure. The proposed algorithm managed to achieve 76% accuracy for S1 and 73% accuracy for S2. Finally, our proposed methods present competitive results when compared with the previous works on membrane protein classification
Keywords: CFS
Feature selection KNN
Membrane protein mRMR
Copyright © 2019 Institute of Advanced Engineering and Science. All rights reserved.
Corresponding Author: Nor Ashikin Mohamad Kamal, Department of Computer Science,
Faculty of Computer and Mathematical Sciences, Universiti Teknologi MARA, Shah Alam, Selangor. Email: [email protected]
1. INTRODUCTION
The three main classes of protein are globular, fibrous and membrane. Membranes are a universal feature of all cell types which separates the cells and the environment outside the cell. It protects the cell nucleus and survival systems that work in the cytoplasm. The membrane protein is an important class of protein that functions as receptors, energy transducers and channels in a cell membrane [1]. Most drugs aim at membrane proteins since the therapeutic effects of most medicines are achieved through interaction with the membrane protein. This makes them a desirable target for drug research and design. The membrane protein data have been rapidly increasing. Unfortunately, prior to restricted techniques for expressing membrane protein in big amounts, the structure and function of membrane proteins is not well understood [2-4]. It takes time and is expensive to determine the types of the unknown membrane protein by using the traditional method. An efficient computational method is really needed for membrane protein type classification and it is a big contribution to understand the membrane protein types and their functions.
Classification is the data mining function that helps to target the categories or classes and predict the class of the dataset. The classification of membrane protein sequences involves three phases which are feature extraction, feature selection, and classification. The feature extraction is the transformation of data into a set of features. The popular feature extraction method for the protein sequences are amino acid composition (AAC), pseudo amino acid composition (PseAAC), functional domain, position-specific scoring matrices (PSSM) and physicochemical properties of amino acids. The crucial problem in the biological data is high dimensional features [5]. Thus, it is important to select subset of the features available for the
application of learning algorithm. Feature selection methods choose a subset of features that can correctly categorize membrane protein to the target class [6]. Features selection can be split into three techniques which are filter method, wrapper method, and an embedded method. In this study, the method that will be used is the filter feature selection method. The filter method selects features independent of the classifiers. It calculates the feature score representing the relevance of the particular feature [7]. The advantages of using the filter method are the simple and fast method [7-9]. This filter method also can be easily scaled and applied to a very high-dimensional dataset [7-8].
Much of the existing research focuses only on feature extraction methods that operate on the membrane protein dataset [3, 10-13]. In [14] applied a type of feature that is derived from the wavelet feature analysis of the protein sequence and cascaded neural network classifier. The classification accuracy obtained was 81.3%. In [15] represented protein features by using Dipeptide decomposition method. The KNN classifier was implemented in order to classify the membrane protein with 82% accuracy. In [3] proposed three methods, real weighted combination (RWC), Nearest neighbor algorithm (NNA) and integrated method. Integrated method classified human membrane protein types using protein sequence homology and similar characteristics between interactive proteins. The results revealed that the procedure gave a maximum classification accuracy of 87.65%. In [13] predicted membrane proteins using three feature selection schemes, namely pseudo amino acid composition (PseAAC), amino acid composition (AAC) and split amino acid composition (SAAC). The experimental finding showed that SAAC feature space in combination with support vector machine providing the best predictive results. In [11] developed the multiclass support vector machine (MCSVM) technique using the two-step feature extraction method. In the first step, the feature extraction method was used individually. In the second step, the feature extraction methods were combined to produce optimal feature sets. The proposed algorithm obtained maximum accuracy of 86.11%. In [12] applied the pseudo amino acid composition and sequence homology for membrane protein type prediction. They developed a system named MemPred which achieve maximum accuracy of 88.17%. To fill the gap, this paper will focus on feature selection for membrane protein classification using Minimum Redundancy Maximum Relevance (mRMR) and Correlation-based Feature Selection (CFS) methods. We investigate here, whether feature selection method can be used to improve the performance of membrane protein type classification. This paper is organized as follows. Section 2 discusses the suggested methodology used in this research. Section 3 discusses the outcomes and evaluation. Finally, Section 4 concludes the study.
2. RESEARCH METHOD
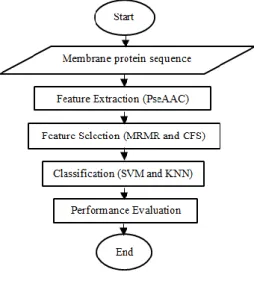
Themethodology of this study has four phases namely protein feature extraction, feature selection, classification and performance evaluation as shown in Figure 1.
Figure 1. Research methodology
The first step aims to create a feature matrix for each protein sequence. In this phase, we used Pseudo amino acid composition (PseAAC) approach to extract and convert the features for each membrane protein sequence into numerical values. Subsequently, the proposed Minimum Redundancy and Maximum
Relevance (mRMR) and Correlation-based feature selection (CFS) methods will select the best features from these extracted features. The selected features are inserted into Support Vector Machine (SVM) and k-Nearest Neighbour (kNN) classifiers to predict the class of these features. The results of classification are evaluated using accuracy, specificity, sensitivity and F-measure. The detail of each phase is described in the following subsections.
2.1. Data collection
This project used two dataset of membrane protein that is download from the UniProt [16] database that was released in October 2012. Six kinds of membrane protein are in each dataset. The first dataset, S1 includes 2876 protein sequences with 1,414 multipass, 140 lipid-anchored, 545 peripheral, 546 single pass type-I, 161 are single pass type-II and 70 GPI anchor membrane protein sequences. The second dataset, S2 consists of 2073 membrane protein sequences with 879 multipass, 84 lipid-anchored, 470 peripheral, 43 single-pass type-I, 144 single-pass type-II and 60 GPI-anchor membrane protein sequences. The same dataset has been used by researchers [11, 12, 17].
2.2. Feature extraction
The Pseudo Amino Acid Composition (PseAAC) is used to obtain the features of membrane proteins. PseAAC is the extension of the amino Acid (AA) composition that introduced by [18-19]. PseAAC incorporates sequence order and structure information of proteins [18-20]. It represents the protein sequence as shown in (1).
𝑃𝑠𝑒𝐴𝐴 = 𝑃1, 𝑃2, … , 𝑃ʌ (1)
where,
ʌ = 20 + 𝑛ʎ (2)
In the (2), the first 20 elements, that is, P1 to P20 in above are given by AA composition (frequency of
occurrence of 20 amino acids). ʎ (lambda) is the number of tiers used in the PseAA, ʎ = 1,…,m. The n represents the number of physiochemical properties. The features of membrane protein sequence is being extracted by using Pseudo Amino Acid Composition (PseAAC) technique that is available via http://www.csbio.sjtu.edu.cn/bioinf/PseAAC/ website. The parameter settings are Type 2 PseAAC, six types of physicochemical properties which are hydrophobicity, hydrophilicity, mass, pK1 (alpha-COOH), pK2 (NH3) and pI (at 25℃). The weight factor is 0.50 and lambda is 25 [20]. By using (2), the total number of features used in this work is 170.
2.3. Feature selection
We employed two feature selection techniques for this study which are Minimum Redundancy Maximum Relevance (mRMR) [31], and Correlation-based feature selection (CFS) [21]. Below are the descriptions of these two algorithms.
2.3.1. Minimum redundancy maximum relevance (mRMR)
The mRMR is one of the common filter feature selection methods [23]. It is a technique that trying to balance the minimum of redundancy and maximize the relevance of features [24]. The mRMR technique could classify the features according to their significance and redundancy amongst the features [25]. (3) shows the formula for mutual information; I that is used to evaluate the "similarity" level. The function P(x) and P(y) are the marginal probability density function.
𝐼(𝑥, 𝑦) = ∑𝑖,𝑗∈𝑁P(𝑥𝑖,𝑦𝑗)log 𝑃(𝑥𝑖,𝑦𝑗)
𝑃(𝑥𝑖)𝑃(𝑦𝑗) (3)
The idea of minimum redundancy is to identify features that differ from one another [12]. Minimum redundancy will improve the processing time of the entire dataset [30]. The minimum redundancy is calculated by using (4).
𝑚𝑖𝑛(𝑅) , 𝑅 = |𝑆|12∑𝑥𝑖,𝑥𝑗∈𝑆𝐼(𝑥𝑖, 𝑥𝑗) (4)
In 4, the I(xi,xj) represents the mutual information and R represent the notational simplicity score between the
of classification variable C with the independent variable xi [24]. The maximum relevance is calculated by
using (5).
𝑚𝑎𝑥(𝐷) , 𝐷 = 1
|𝑆|∑𝑥𝑖∈𝑆𝐼(𝐶, 𝑥𝑖) (5)
In the (5), D represents the mean value of the mutual information between target variable C with the features in S. |S| represent the number of features in S. The mRMR strategy is to optimize the requirements in (4) and (5) concurrently by integrating them to produce a single optimization problem [26].
These two methods actually to either use the difference or the ratio of the mRMR criteria. The following are the criteria of the mRMR:
max(𝐷 − 𝑅), (6)
max (𝐷/𝑅). (7)
In the (6) and (7), D is the redundancy and R is the relevance. (6) iscalled theMutual Information Difference (MID) criterion while (7) iscalled the Mutual Information Quotient (MIQ) criterion.
2.3.2. Correlation feature selection (CFS)
Correlation-based feature selection is an algorithm which ranks a subset based on heuristic based evaluation function. It is based on the hypothesis that a subset of good features contains features that have a high correlation to class and not with other features. High correlation with other features indicates the feature redundancy. Low correlation with class indicates the feature are nor relevant. Therefore, CFS removes the redundant and unrelated features. According to [21], the feature subset search formula is shown in (8).
𝑀𝑒𝑟𝑖𝑡𝑠=
𝑘𝑟̅̅̅̅̅𝑐𝑓
√𝑘+𝑘(𝑘−1)𝑟̅̅̅̅̅𝑓𝑓
(8)
where 𝑀𝑒𝑟𝑖𝑡𝑠 is the heuristic score for a feature subset S with k features, 𝑟̅̅̅̅𝑐𝑓 is the average correlation
between function and class, and 𝑟̅̅̅̅𝑓𝑓 is the average correlation between features. A greater score shows greater
correlation between the feature subsets to the target class and lesset inter-correlation between the features. a. Classification
The classification techniques used in this study are K-Nearest Neighbour (KNN) and Support Vector Machine (SVM). Below are the descriptions of these two classifiers.
2.4.1. K-nearest neighbor (KNN)
K-Nearest Neighbour (KNN) algorithm is a method that uses supervised algorithm. KNN belongs to instance-based learning group. This algorithm is done by searching the k-group in the training data similar or closest to the object in testing data. In this paper, the value of k is set to 1, and the Euclidean distance formula in (9) is used to define the distance between two objects x and y [28].
𝐷𝑥,𝑦 = √∑𝑛𝑖=1(𝑥𝑖− 𝑦𝑖)2 (9)
2.4.2. Support vector machine (SVM)
Support Vector Machine, presented by [29] is a technique that produce good predictions for classification and regression. This algorithm works by searching for separation between hyper planes denoted by categories of data. The objective is to measure the margin of the separation of the data. The best separator function is a function that is able to separate the data with the largest margin value, exactly between both data classes. Here, a linear function was chosen as the separator function.
2.5. Performance evaluation
In this paper, 5-fold cross-validation method is selected to test our proposed method. In addition, the frequently use measurement for classification which are sensitivity, specificity, accuracy and F-measure are also used. Sensitivity, specificity, accuracy and F-measure are defined as follows:
Sensitivity = 𝑇𝑃
𝑇𝑃+𝐹𝑁 (10)
Specificity = 𝑇𝑁
𝑇𝑁+𝐹𝑃 (11)
Accuracy = (𝑇𝑃+𝑇𝑁)
(𝑇𝑃+𝑇𝑁+𝐹𝑃+𝐹𝑁) (12)
F-measure = 2 ∗ 𝑝 𝑟𝑒𝑐𝑖𝑠𝑖𝑜𝑛 ∗ 𝑟𝑒𝑐𝑎𝑙𝑙
𝑝𝑟𝑒𝑐𝑖𝑠𝑖𝑜𝑛+𝑟𝑒𝑐𝑎𝑙𝑙 (13)
3. RESULTS AND ANALYSIS
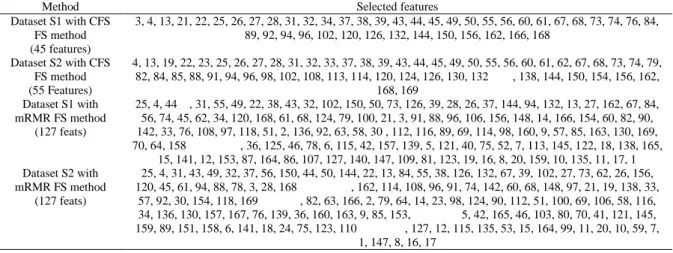
The purpose of the above experiments is to acquire a subset of optimum features. The experiments have been executed on a machine with 1.6 GHz CPU and 8GB of RAM. We implement the algorithms in Matlab 2017a. Table 1 shows the selected features for CFS and mRMR algorithms. The CFS algorithm selected 45 features for dataset S1 and 55 features for dataset S2. While mRMR selected 127 features for dataset S1 and S2 to achieve its maximum accuracy.
Table 1. The list of features selected for dataset SI and S2 using CFS and mRMR
Method Selected features
Dataset S1 with CFS FS method (45 features)
3, 4, 13, 21, 22, 25, 26, 27, 28, 31, 32, 34, 37, 38, 39, 43, 44, 45, 49, 50, 55, 56, 60, 61, 67, 68, 73, 74, 76, 84, 89, 92, 94, 96, 102, 120, 126, 132, 144, 150, 156, 162, 166, 168
Dataset S2 with CFS FS method (55 Features)
4, 13, 19, 22, 23, 25, 26, 27, 28, 31, 32, 33, 37, 38, 39, 43, 44, 45, 49, 50, 55, 56, 60, 61, 62, 67, 68, 73, 74, 79, 82, 84, 85, 88, 91, 94, 96, 98, 102, 108, 113, 114, 120, 124, 126, 130, 132 , 138, 144, 150, 154, 156, 162,
168, 169 Dataset S1 with
mRMR FS method (127 feats)
25, 4, 44 , 31, 55, 49, 22, 38, 43, 32, 102, 150, 50, 73, 126, 39, 28, 26, 37, 144, 94, 132, 13, 27, 162, 67, 84, 56, 74, 45, 62, 34, 120, 168, 61, 68, 124, 79, 100, 21, 3, 91, 88, 96, 106, 156, 148, 14, 166, 154, 60, 82, 90, 142, 33, 76, 108, 97, 118, 51, 2, 136, 92, 63, 58, 30 , 112, 116, 89, 69, 114, 98, 160, 9, 57, 85, 163, 130, 169, 70, 64, 158 , 36, 125, 46, 78, 6, 115, 42, 157, 139, 5, 121, 40, 75, 52, 7, 113, 145, 122, 18, 138, 165,
15, 141, 12, 153, 87, 164, 86, 107, 127, 140, 147, 109, 81, 123, 19, 16, 8, 20, 159, 10, 135, 11, 17, 1 Dataset S2 with
mRMR FS method (127 feats)
25, 4, 31, 43, 49, 32, 37, 56, 150, 44, 50, 144, 22, 13, 84, 55, 38, 126, 132, 67, 39, 102, 27, 73, 62, 26, 156, 120, 45, 61, 94, 88, 78, 3, 28, 168 , 162, 114, 108, 96, 91, 74, 142, 60, 68, 148, 97, 21, 19, 138, 33,
57, 92, 30, 154, 118, 169 , 82, 63, 166, 2, 79, 64, 14, 23, 98, 124, 90, 112, 51, 100, 69, 106, 58, 116, 34, 136, 130, 157, 167, 76, 139, 36, 160, 163, 9, 85, 153, 5, 42, 165, 46, 103, 80, 70, 41, 121, 145, 159, 89, 151, 158, 6, 141, 18, 24, 75, 123, 110 , 127, 12, 115, 135, 53, 15, 164, 99, 11, 20, 10, 59, 7,
1, 147, 8, 16, 17
Table 2 presents the results of classification methods on the S1 membrane protein dataset. In this table, the MRMR-KNN obtains 76% accuracy, 0.5071 sensitivity, 0.7467 specificity and 0.6037 F-measure by using 127 features, which is the highest from all the methods. However, SVM classifier produces 76% accuracy by using all the 170 features without feature selection. Therefore, between these two algorithms, mRMR-KNN is better since it can produce the same accuracy as SVM with fewer number of features. The CFS-SVM method produces the competitive result which is 75% accuracy by only using 45 features. Overall, mRMR-KNN method is suitable for membrane protein classification in dataset S1.
Table 2. Performance of S1
Method Selected Features Accuracy (%) Sensitivity Specificity F-Measure
KNN - 74% 0.4683 0.5667 0.5123
mRMR-KNN 127 76% 0.5071 0.7467 0.6037
CFS-KNN 45 72% 0.497 0.578 0.534
SVM - 76% 0.5317 0.5583 0.5447
mRMR-SVM 127 76% 0.555 0.565 0.556
CFS-SVM 45 75% 0.455 0.505 0.4786
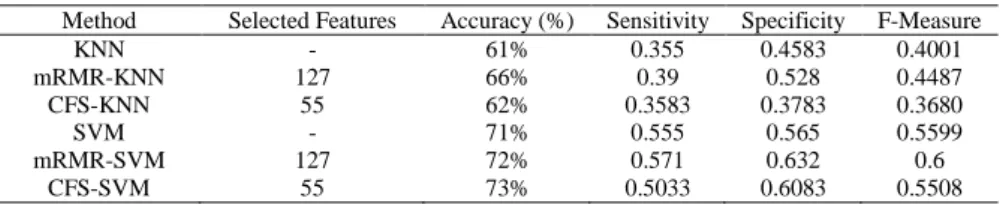
Table 3 shows the results of classification methods on S2 membrane protein dataset. In this table, CFS-SVM produces the highest accuracy which is 73%, 0.5033 sensitivity, 0.6083 specificity and 0.5508 F-measure by using only 55 features. MRMR-SVM produced competitive results with 72% accuracy, 0.571 sensitivity, 0.632 specificity and 0.6 F-measure by using 127 features. SVM classifier produces 71% accuracy, 0.555 sensitivity, 0.565 specificity and 0.5599 F-measure by using all 170 features. KNN classifier
is unsuitable because of low performances. Therefore, CFS-SVM algorithm is suitable for membrane protein classification in dataset S2.
Table 3. Performance of S2
Method Selected Features Accuracy (%) Sensitivity Specificity F-Measure
KNN - 61% 0.355 0.4583 0.4001
mRMR-KNN 127 66% 0.39 0.528 0.4487
CFS-KNN 55 62% 0.3583 0.3783 0.3680
SVM - 71% 0.555 0.565 0.5599
mRMR-SVM 127 72% 0.571 0.632 0.6
CFS-SVM 55 73% 0.5033 0.6083 0.5508
The performance of the suggested model was compared with prior models on the two datasets in Table 4. In the case of dataset S1, RWC [7], MCSVM [19] and Mempred [20] has yielded more than 80% accuracy. NNA based method [7] has obtained 70.4% accuracy. Our proposed method has obtained 76% accuracy, higher than NNA based method. The reason for this is because NNA based method [7] used the similar protein feature extraction strategy with our method. However, our method implemented the feature selection phase that improved the NNA based method [7] accuracy. Mempred [20] was able to obtain 88% accuracy which is the highest accuracy among the three methods. On the other hand, in the case of dataset S2, our proposed method has yielded 73% accuracy, higher than RWC [7] and NNA [7] methods. MCSVM [19] and Mempred [20] obtained 86.11% and 82% accuracy respectively. From the comparison, it shows that feature selection phase unable to improve the performance of human membrane protein classification.
Table 4. Comparison of proposed model with previous methods.
Dataset NNA based on PseAAC [7] RWC [7] MCSVM [19] Mempred [20] Proposed Method
SI 70.41% 81.34% 83.33% 88% 76%
S2 61.70% 71.40% 86.11% 82% 73%
4. CONCLUSION
This paper presents the filter feature selection method for human membrane protein classification. We applied two types of filter feature selection methods, mRMR and CFS. Two classifiers, KNN and SVM are used for classification. Compared with the previous methods on the same dataset, our proposed method reduced the number of features for classification. However, there have been no important changes to the predictive accuracy of the classification system by adding this feature selection phase. There are a lot of enhancements that can be made to this project in the future, the feature selection techniques could be hybrid to enhance the performance of the feature selection techniques. In addition, the features could be optimized by using metaheuristic algorithm and other classification techniques.
REFERENCES
[1] S.K. Golmohammadi, L. Kurgan, B. Crowley, M. Reformat, “Classification of cell membrane proteins,” In Frontiers in the Convergence of Bioscience and Information Technologies FBIT 2007, pp. 153-158, 2007.
[2] J. H. Kleinschmidt, "Membrane Proteins-Introduction," Cellular and Molecular Life Sciences CMLS, vol. 60, pp. 1527-1528, 2003.
[3] G. Huang, Y. Zhang, L. Chen, N. Zhang, T. Huang, Y.D. Cai, “Prediction of multi-type membrane proteins in human by an integrated approach.”, PloS One, vol. 9, no. 3, 2014.
[4] J. Qiu, X. Sun, J. Huang, R. Liang, “Prediction of the types of membrane proteins based on discrete wavelet transform and support vector machines,” The Protein Journal, vol. 29, no. 2, pp. 114-119, 2010.
[5] M.J. Iqbal, I. Faye, B.B. Samir, A.M. Said, “Efficient feature selection and classification of protein sequence data in bioinformatics”, The Scientific World Journal, 2014.
[6] F.R. Kamala, P.R. Thangaiah, “An improved hybrid feature selection method for huge dimensional datasets,” IAES International Journal of Artificial Intelligence (IJ-AI), vol. 8, no. 1, pp. 77-86, 2019.
[7] K. Kadam, S. Sawant, U. Kulkarni-Kale, V.K. Jayaraman, “Prediction of protein function based on machine learning methods: an overview,” Genomics III Methods, Techniques and Applications, iConcept Press Ltd, 2014. [8] B. Kumari, T. Swarnkar, “Filter versus wrapper feature subset selection in large dimensionality micro array: A
review,” International Journal of Computer Science and Information Technologies, vol. 2, no. 3, pp. 1048-1053, 2011.
[9] A. Adeleke, N.A. Samsudin, Z.A. Othman, S..K. Ahmad Khalid, “A two-step feature selection method for quranic text classification,” Indonesian Journal of Electrical Engineering and Computer Science, vol. 16, no.2, pp. 730-736, 2019.
[10] N.A.M. Kamal, A.A. Bakar, S. Zainudin, “Classification of Human Membrane Protein Types using Optimal Local Discriminant Bases Feature Extraction Method,” Journal of Theoretical and Applied Information Technology, vol. 96, no. 3, pp. 767-771, 2018.
[11] N. Raj, T. Mahalekshmi, “Human membrane protein classification using Multiclass Support Vector Machine (MCSVM),” International Journal of Technology and Science, vol. 5, no.1, pp. 1-5, 2018.
[12] H. Yanjun, H. Guohua, “A homology and pseudo-amino acid composition based multi-label model for predicting human membrane protein types,” Current Proteomics, vol. 15, no. 2, pp.135-141, 2018.
[13] M. Arif, M. Hayat, Z. Jan, “iMem-2LSAAC: A two-level model for discrimination of membrane proteins and their types by extending the notion of SAAC into Chou’s pseudo amino acid composition,” Journal of Theoretical Biology, vol. 442, pp. 11-21, 2018.
[14] M.A. Rezaei, P. Abdolmaleki, S. Jahandideh, Z. Karami, E.B. Asadabadi, M.A. Sherafat, H. Abrishami-Moghaddam, M. Fadaie, and M. Forouzanfar, “Prediction of membrane protein types by means of wavelet analysis and cascaded neural networks,” Journal of Theoretical Biology, vol. 254, no. 4, pp. 817-820, Oct. 2008.
[15] L. Wang, Z.Yuan, X.Chen, Z.Zhou, “The prediction of membrane protein types with NPE,” IEICE Electronics Express, vol. 7, no. 6, pp. 397-402, 2010.
[16] C. UniProt, “The Universal Protein Resource (UniProt) in 2010,” Nucleic Acids Res 38, pp. 142–148, 2010. [17] F. Ali, M. Hayat, “Classification of membrane protein types using voting feature interval in combination with
Chou’s pseudo amino acid composition,” Journal of Theoretical Biology, vol. 384, pp. 78-83, 2015.
[18] K.C. Chou, “Prediction of protein cellular attributes using pseudo-amino acid composition,” PROTEINS: Structure, Function, and Genetics, vol. 43, pp. 246-255, 2001a.
[19] K.C. Chou, “Using subsite coupling to predict signal peptides,” Protein Engineering, vol. 14, pp. 75-79. 2001b. [20] Q. B. Gao, X.F. Ye, J. He, “Classifying G-Protein-Coupled Receptors to the finest subtype level,” Biochemical and
Biophysical Research Communications, vol. 439(2), pp. 303-308, 2013.
[21] M. Hall, “Correlation-based feature subset selection for machine learning,” Ph.D dissertation, Univ. Waikato, Hamiltom, New Zealand, 1999.
[22] H.C. Peng, F. Long, C. Ding., “Feature selection based in mutual information:criteria of dependency max-relevance and min-redundancy,” 2nd IEEE Transcactions on Pattern Analysis and Machine Intelligence, vol. 27, no. 8, pp. 1226-1238, 2005.
[23] I. Jo, S. Lee, S. Oh, “Improved mesures of redundancy and relevance for mRMR feature selection,” Computers, vol. 8, no. 2, pp. 1-14, 2019.
[24] P. Jia, Z. Qian, K. Feng, W. Lu, Y. Li, Y. Cai, Y., “Prediction of membrane protein types in a hybrid space”,
Journal of Proteome Research, vol. 7, no. 3, pp. 1131-1137, 2008.
[25] B.Q. Li, L. Hu, L. Chen, K.Y. Feng, Y.D. Cai, K.C. Chou, “Prediction of protein domain with mRMR feature selection and analysis.”, PLoS One, vol. 7, no. 6, 2012.
[26] S. Khan, “Machine Learning Approaches for the Prediction of Protein Sequences,” Ph.D dissertation, Karachi Institute of Economics and Technology, 2014.
[27] C. Ding, & H. Peng, “Minimum redundancy feature selection from microarray gene expression data,” Journal of Bioinformatics and Computational Biology, vol. 3, no.2, pp. 185-205, 2005.
[28] W. Lumchanow, S. Udomsiri, “Image classification of malaria using hybrid algorithms: convolutional neural network and method to find appropriate K for K-Nearest Neighbour,” Indonesian Journal of Electrical Engineering and Computer Science, vol. 16, no. 1, pp. 382-388, 2019.
[29] V.N. Vapnik, The nature of statistical learning theory, Springer, 1995.
[30] C. Ding, & H. Peng, “Minimum redundancy feature selection from microarray gene expression data,” Journal of Bioinformatics and Computational Biology, vol. 3, no. 1, pp. 185-205, 2005.