ISSN: 2252-8938, DOI: 10.11591/ijai.v9.i1.pp65-72 65
Classification of multiclass imbalanced data using cost-sensitive
decision tree C5.0
M. Aldiki Febriantono1, Sholeh Hadi Pramono2, Rahmadwati3, Golshah Naghdy4
1Department of Electrical and Computer Engineering, Brawijaya University, Indonesia 2,3Faculty, Department of Electrical and Computer Engineering, Brawijaya University, Indonesia 4School of Electrical, Computer, Telecommunication Engineering. University of Wollongong, New South Wales
Australia
Article Info ABSTRACT
Article history: Received Sept 5, 2019 Revised Nov 25, 2019 Accepted Dec 10, 2019
The multiclass imbalanced data problems in data mining were interesting cases to study currently. The problems had an influence on the classification process in machine learning processes. Some cases showed that minority class in the dataset had an important information value compared to the majority class. When minority class was misclassification, it would affect the accuracy value and classifier performance. In this research, cost sensitive decision tree C5.0 was used to solve multiclass imbalanced data problems. The first stage, making the decision tree model uses the C5.0 algorithm then the cost sensitive learning uses the metacost method to obtain the minimum cost model. The results of testing the C5.0 algorithm had better performance than C4.5 and ID3 algorithms. The percentage of algorithm performance from C5.0, C4.5 and ID3 were 40.91%, 40, 24% and 19.23%
Keywords: Classification Decision Tree C5.0 Metacost
Multiclass
Particle Swarm Optimation This is an open access article under the CC BY-SA license.
Corresponding Author: M. Aldiki Febriantono, Research Scholar,
Department of Electrical and Computer Engineering, Brawijaya University, Indonesia
Email: [email protected]
1. INTRODUCTION
In the digital era nowadays, the amount of data available in the database is increasing time by time. However, not all of the data can be used and utilized even though a lot of data has important information as future knowledge. Based on classes’ distribution, the dataset is divided into two, namely binary data and multi-class data [1]. Binary data only has two classes while multi-class data has more than two classes [2]. Binary imbalanced data and multi-class imbalanced data are problems that must be faced nowadays [3]. The majority class is a class that has a ratio number of instances more than other classes, whereas the minority class is often considered not influential in the machine learning because it only has less ratio number of instances [4]. In the real world, minority class has an important impact because it contains useful knowledge information [5], such as diagnosis types of disease [6], predicting credit worthiness of bank [7], and telecom customer churn prediction [8].
In the classification process using machine learning, minority classes are often misclassified because machine learning prioritizes majority classes and ignores minority classes [9]. There have been many techniques carried out by researchers to solve problems in imbalanced data [10]. In classification process, the multi-class imbalanced data has more difficult level to solve rather than binary imbalanced data because multi-class imbalanced data can have more than one minority classes [11]. There are many ways and techniques that can be used for multi-class imbalanced data problems [12]. However, to obtain optimal
results, it needs new development techniques. Especially, techniques that are focus on the classification of minority classes without ignoring the majority classes.
One technique that is effective and efficient to handle the imbalanced data problem is cost sensitive decision tree [13-14]. The technique is two methods combination, namely cost-sensitive learning and decision tree. The technique works by making a decision tree model, in which calculates the most minimum cost of misclassification [15-16]. Thus, imbalanced data misclassification can be minimized by using cost sensitive learning techniques in the decision tree model. Therefore, it needs new development in making a decision trees model. The C5.0 algorithm is a development of the C4.5 and ID3 algorithms [17]. The C5.0 algorithm works by using information gain. It can make the decision tree model more effective and faster in making decisions [18-20]. In this research, we will focus on handling multiclass imbalanced data problems by using cost sensitive decision tree C5.0. Then, cost sensitive learning uses metacost method. The method works by re-labeling and pruning of a decision tree model to build a minimum cost model. The decision tree model has an impact to the performance and rate of the forward classification process. This paper aims to compare the performance of C5.0, C4.5 and ID3 algorithms in designing the decision tree model.
2. RESEARCH METHOD
2.1. Dataset
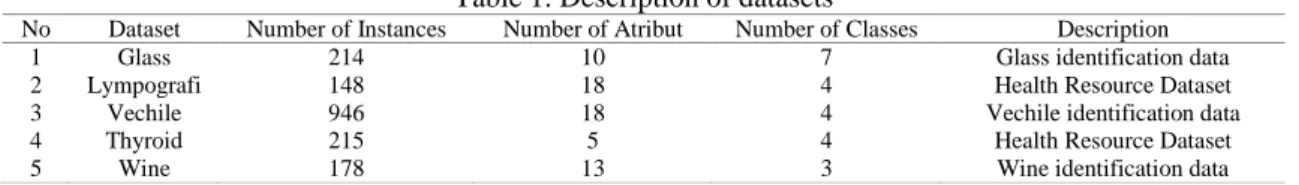
This research is using datasets from UCI Machine Learning Repository, namely: Glass, Lympography, Vechile, Thyroid, and Wine. The reason of choosing these five datasets because that the multi-class imbalanced data is often used in the problems of classification research [21-23]. The description of these dataset is listed in Table 1. 10-fold cross validation is used in machine learning process because it has become a standard for increasing classifier results, where the dataset is divided into two, namely 90% for training and 10% for testing [9].
Table 1. Description of datasets
No Dataset Number of Instances Number of Atribut Number of Classes Description
1 Glass 214 10 7 Glass identification data
2 Lympografi 148 18 4 Health Resource Dataset
3 Vechile 946 18 4 Vechile identification data
4 Thyroid 215 5 4 Health Resource Dataset
5 Wine 178 13 3 Wine identification data
2.2. Preprocessing
Preprocessing is the processing of datasets by analyzing and improving data so that it can produce new datasets that are good to use in the next process. The way to handle the problem is by going through several stages, including changing/cleaning data, reducing data and transforming data [24]. The next step is to normalize min-max by changing the value of the datasets by scaling 0-1 with the aim of weighting the information contained in balanced datasets to do the attribute selection process. Stated below is Min-max normalization (1).
min( )
max( ) min( )
i
x
x
y
x
x
(1)y is the result of scaling new values (0-1), xi is the data value that wants to be changed. Min (x) is
the minimum value of the attribute (x) and max (x) maximum value of the attribute (x). 2.3. Particle swarm optimization
Particle swarm optimization (PSO) is a method of optimization that is good at improving performance by selecting attributes based on the value of information weights in the datasets. Informative and relevant attributes will be closer to 1 while the attributes that are not needed are closer to 0. There are two parameters in determining the value of information weight, namely the velocity value and position value [25]. Below are the steps of selecting attributes using particle swarm optimization:
Step 1. Input the dataset.
Step 2. The velocity and initial position of the attribute are determined randomly. Step 3. Initial velocity at position 0 towards optimal point 1.
1
1
1
2
2
k k
id id id id id id
V
w V
c
rand
P
X
c
rand
G
X
(2) Step 5. Calculating the position of individual attributes i in d dimensions using the following (3):
1 1
k k k
id id id
X
X
V
(3) Step 6. Updating Pbest and Gbest to get the most optimal velocity and position on each attribute.
Step 7. Attributes whose position and initial velocity do not change/are worth 0 (zero) or have small value are removed after the update process is complete.
where,
Vid = Individual velocity component i in d dimension Xid = Position of individual i in d dimension
= Inertia weight parameter 1 2c c
= Constant acceleration (learning rate), the value is between 0 and 1 1,2rand = Random parameter between 0 and 1
id
P = Pbest (local best) individual i in d dimension id
G = Gbest (global best) individual i in d dimension 2.4. Decision tree
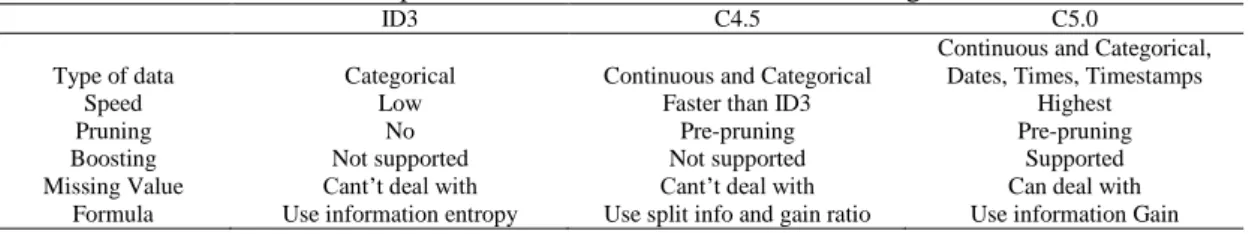
The Decision Tree is a classification method in data mining classification that can be used to solve classification problems both binary class and multi-class [26]. The concept of decision tree model is a top down structure that turn data into a decision tree then produce rules. The decision tree requires algorithm formula for determining the root node, internal node and leaf node to make a decision tree model [27]. Algorithms that are often used to solve classification problems are ID3, C4.5 and C5.0 [28]. Comparisons of each algorithm are shown in Table 2.
Table 2. Comparisons between different decision tree algorithm
ID3 C4.5 C5.0
Type of data Categorical Continuous and Categorical
Continuous and Categorical, Dates, Times, Timestamps
Speed Low Faster than ID3 Highest
Pruning No Pre-pruning Pre-pruning
Boosting Not supported Not supported Supported
Missing Value Cant’t deal with Cant’t deal with Can deal with
Formula Use information entropy Use split info and gain ratio Use information Gain
2.5. C5.0 Algorithm
C5.0 algorithm is a development of the previous algorithms, ID3 and C4.5 [17]. The advantages of C5.0 are that it is low memory usage, faster in making decisions and more effective in building decision tree models [18, 20]. C5.0 model works by calculating the entropy value and information gain on each attribute [19]. The attribute that has the largest information gain value then becomes the root node. Then the root node forms a new criteria branch called the internal node. The process will stop if no new criterion is generated. The down node then functions as an output called leaf node. The Leaf node work to predict the class of the classifier [26]. Below is the procedure of how to make the decision tree model using the C5.0 algorithm:
Step 1. Input dataset training
Step 2. Calculating the total entropy value of the dataset using the following (4):
(4) Step 3. Calculating the entropy value of each criterion.
Step 4. Calculating the information gain value for each attribute using the following (5):
2 1
( ) ( ) log ( ( ))
n
i i
i
H S p s p s
( , ) ( ) ( )
i
n i
A S
IG S A H S H S
S
(5)Step 5. The attribute that has the largest information gain value as the root node. Step 6. Creating a branch from the node’s criteria.
Step 7. Repeating the process of calculating the entropy value and information gain. The process will stop if all the attribute criteria have produced the predicted class.
where,
S = Set of cases
N = Number of partition attributes A Pi = Proportion of Si to S
A = Attribute
|S| = Number of cases on the i partition |S| = Number of cases in S
2.6. Cost-sensitive learning
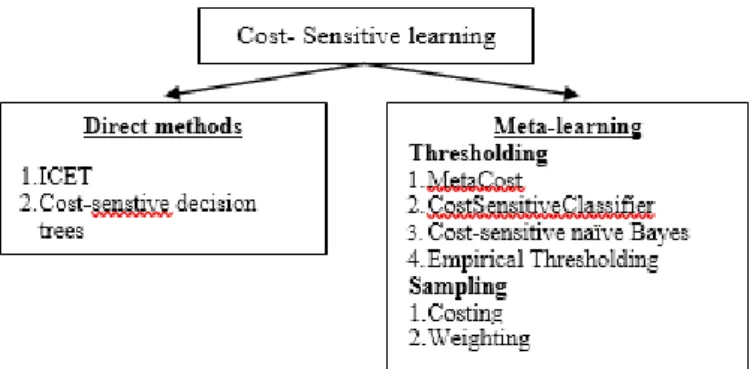
Cost-sensitive learning is a learning method that can solve imbalanced data problems [14]. The concept of the method is to reduce misclassification cost so that can improve the performance of the classifier. This method assumes that the minority class has a higher misclassification cost than the majority class. Therefore, machine learning will focus on accurately classifying minority class. Cost sensitive can be categorized into two criteria. The first criterion is the direct method which its classifier is cost sensitive to them such as ICET and cost-sensitive decision tree. The other category is the cost-sensitive meta-learning method. It is categorized into two techniques, namely thresholding and sampling. The thresholding technique has methods, namely MetaCost, CostSensitive Classifier, Cost-sensitive naïve Bayes and Empirical Thresholding [18]. Figure 1 show structure of cost sensitive learning
Figure 1. Structure of cost sensitive learning
2.7. MetaCost
Metacost is a cost-sensitive method that uses the thresholding meta-learning approach to minimize costs [15]. The working principle of metacost is calculating the probability value of each leaf node [16]. When the probability value of leaf node is > 1, re-learning of each node is done by pruning or relabeling until the minimum cost is obtained. The cost is denoted as C (i, j), where i is the actual class but is predicted to be class j which causes misclassification [22]. The cost with the minimum value will be used as the predicted class or new leaf node to get an optimal performance. Below is the procedure of applying the metacost algorithm.
Method : Metacost
Output : Decision Tree Step :
For i = 1 to m
LetSi be a leaf node of S with n node.
For each node x in S For each class j
Let
P j x
(
)
1
(
,
)
1
i ii
P j x M
if
P j x M
(
,
i)
0
is produced by MiElse
P j x M
(
,
i) 1
Let x’s class = argmini
(
) ( , )
j
P j x C i j
Let M = Model produced by applying L to S. ReturnM
where,
S = Training set
L = Classification learning algorithm C = Cost matrix
M = Number of leaf node to generate N = Number of node in each leaf node 2.8. Validation multiclass
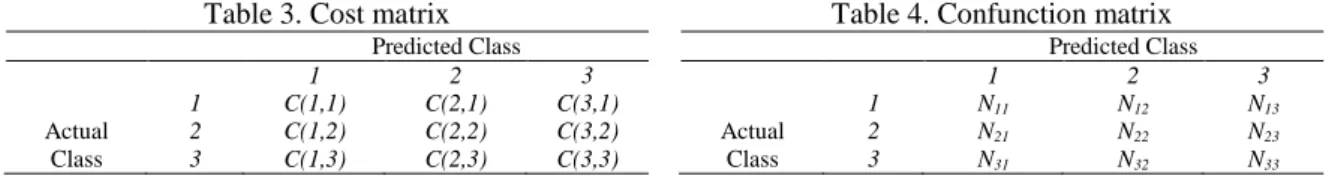
Cost matrix is a representation of the results of prediction errors (misclassification) in machine learning [8]. Cost matrix is defined as C (i: j) where i is the actual class and j is the predicted class [22]. Misclassification predictions cost of multi-class are presented such as C(2,1), C(3,1), C(1,2), C(3,2) ,C(1,3) , C(2,3), while correct classification cost of multi-class are presented such as C(1,1), C(2,2), C(3,3)that cost value are 0. Table of cost matrix is shown in the Table 3. Predicted data of the classification model are presented using the Confusion matrix table, which contains information about the actual class presented in the row of the matrix and predicted class on the column [15]. Confusion matrix is used to measure the performance of a classifier model based on TP, TN, FP and FN. True positive (TP) and true negative (TN) when the prediction results are true [8]. False positive (FP) when the actual prediction results are (-) but actually (+). False negative (FN) when the prediction results are (+) but actually (-). Table of confusion matrix is shown in the Table 4.
Table 3. Cost matrix
Predicted Class
1 2 3
1 C(1,1) C(2,1) C(3,1)
Actual 2 C(1,2) C(2,2) C(3,2)
Class 3 C(1,3) C(2,3) C(3,3)
Table 4. Confunction matrix
Predicted Class
1 2 3
1 N11 N12 N13
Actual 2 N21 N22 N23
Class 3 N31 N32 N33
The performance of classifier can be seen from the accuracy of classification, where the higher classification accuracy this means the better performance of the classification model [15]. The accuracy is a testing method based on the number of correct result prediction classification. The equation for calculating the value of accuracy is shown as follows:
TP Accuracy
TP TN FP FN
(6)
Misclassification cost is the value of class prediction errors because the classifier cannot predict the class correctly [8]. It is inversely proportional to the accuracy value if accuracy value is large, the performance of the classifier is good classification but if the cost has large value, the performance of the classifier is bad classification. The equation to calculate the cost is shown as follows:
2.9. Training process
In this research, there are several steps or stages of research, such as (i) data collection, (ii) preprocessing, (iii) attributes selection, (iv) training and testing process, (v) validation. These are the method solution steps that will be carried out to solve the problem on imbalanced multiclass data.
Step 1. Input the dataset for processing.
Step 2. Replacing the missing value and remove the outliner from the dataset and perform the min-max normalization process.
Step 3. Selecting the attribute that will be used using PSO.
Step 4. Creating the decision tree model using the ID3, C4.5, C5.0 algorithm.
Step 5. Performing a remodeling of the decision tree by minimizing the cost of using the metacost method. Step 6. Performing validation by calculating the value of accuracy and total cost.
3. RESULT AND DISCUSSION
The classifier model testing is carried out using an Intel Core i5 personal computer, 16 GB RAM, Windows 10 operating system and Rapid Miner version 7.3.0 testing the classification model is carried out using 5 datasets of UCI Repository Learning Repository (Glass, Lympografi, Vechile, Thyroid and Wine). There are three scenario of testing:
1. Performance of ID3, C4.5, and C5.0.
2. Performance of ID3 + PSO, C4.5 + PSO, C5.0 + PSO.
3. Performance of ID3 + PSO + MetaCost, C4.5 + PSO + MetaCost, C5.0 + PSO + MetaCost.
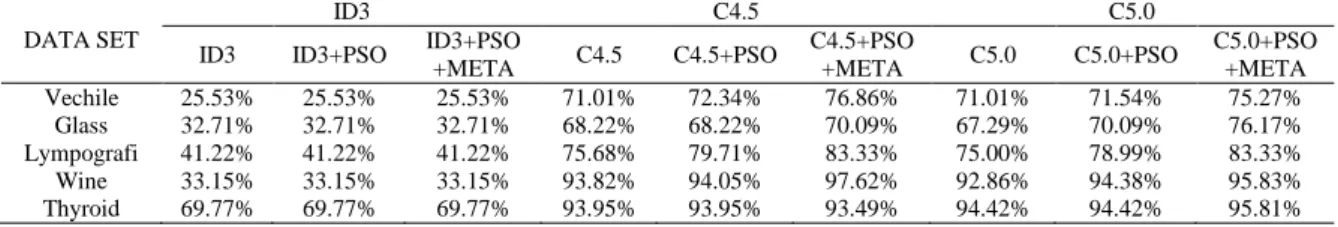
Table 5 is the result of testing performance accuracy using machine learning "rminner". The output of machine learning is a table confunction matrix that shows the performance of the classifier. This research uses 3 testing scenarios. The first scenario, testing uses the decision tree algorithm (ID3, C4.5, and C5.0). The second scenario, testing uses scenario 1 and PSO. The third scenario, testing uses scenario 2 and the metacost method.
Table 5. Result of accuary measurement
DATA SET
ID3 C4.5 C5.0
ID3 ID3+PSO ID3+PSO
+META C4.5 C4.5+PSO
C4.5+PSO
+META C5.0 C5.0+PSO
C5.0+PSO +META
Vechile 25.53% 25.53% 25.53% 71.01% 72.34% 76.86% 71.01% 71.54% 75.27%
Glass 32.71% 32.71% 32.71% 68.22% 68.22% 70.09% 67.29% 70.09% 76.17%
Lympografi 41.22% 41.22% 41.22% 75.68% 79.71% 83.33% 75.00% 78.99% 83.33%
Wine 33.15% 33.15% 33.15% 93.82% 94.05% 97.62% 92.86% 94.38% 95.83%
Thyroid 69.77% 69.77% 69.77% 93.95% 93.95% 93.49% 94.42% 94.42% 95.81%
In the first scenario, (1) ID3 has the smallest performance because it is not able to certify continue data. (2) Testing using C4.5 has good performance in data glass, lympografi, and wine with a value of 68.22%, 75.68%, and 93.82%. (3) Testing using C5.0 has good performance on thyroid data with an accuracy value of 94.42%. In the second scenario, (1) PSO cannot improve ID3 performance. (2) PSO can improve the performance of C4.5 in 4 datasets namely Vechile, lympografi, wine, thyroid with a value of 72.34%, 79.71%, 94.05%, 93.95%. (3) PSO can improve the performance of C5.0 in all datasets with a value of 71.54%, 70.09%, 78.99%, 94.38%, 94.42%. In the third scenario, (1) combining ID3 and MetaCost cannot improve the performance of the classifier. (2) Combining C4.5 and Metacost can improve the performance of 4 datasets namely Vechile, glass, lympography, wine with a value of 76.86%, 70.09%, 83.33%, and 97.62%. (3) Combining C5.0 and Metacost can improve all datasets with values of 75.27%, 76.17%, 83.33%, 95.83%, 95.81% respectively.
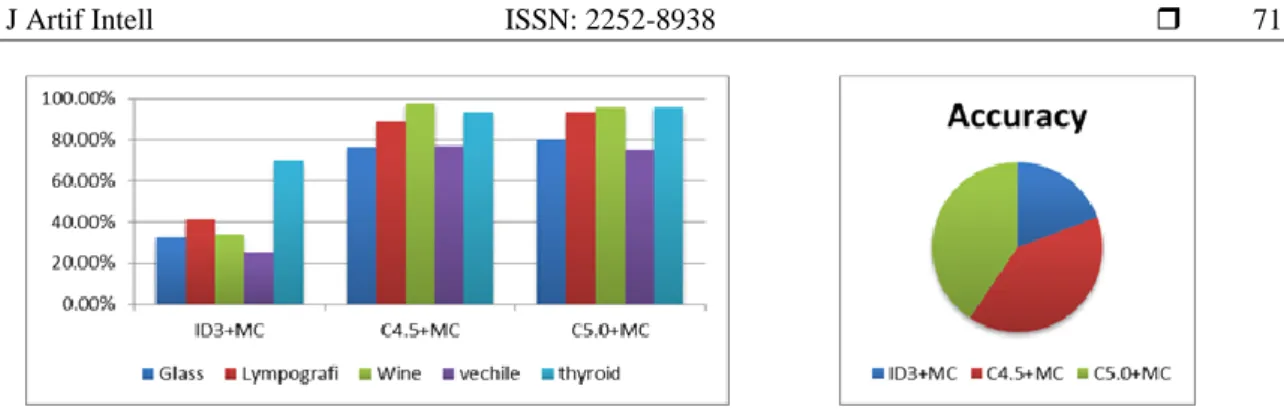
Figure 2 is a representation of Table 5 where the best performance is using scenario 3. Performance C4.5 has the highest accuracy value in vechile and wine data with a value of 76.86% and 97.62%. C5.0 performance has the highest accuracy value in glass and thyroid data with a value of 76.17%, 95.81%. While the lympographic data on C4.5 and C5.0 have the same accuracy value that is equal to 83.33%. Figure 3 is the percentage of the total value of all datasets of the accuracy value of scenario 3. From the percentage of 100%, ID3 has a performance percentage of 19.23%, C4.5 has a performance percentage of 40.24%, and C5.0 has a performance percentage of 40.91%.
Figure 2. Diagram of accuracy comparison Figure 3. Performance Diagram
Table 6 is the result calculating cost of the classifier. Cost is the value of misclassification, if the classifier has large cost value, the classifier is called a bad classification but if the classifier has a small cost, the classifier is called a good classification. In the first scenario, ID3 has the largest cost value of all algorithms. C4.5 has small cost value in data glass, lympography and wine. C5.0 has small cost value in vechile and thyroid data. In the second scenario, ID3 is the worst classification. C4.5 has small cost value in vechile and lympography data. C5.0 has small cost value in data glass and thyroid. Whereas C4.5 and C5.0 have the same cost in wine data with values of 200. In the third scenario, ID3 is the worst classification. C4.5 has small cost value in data vechile and wine. C5.0 has small cost value in data glass and thyroid. Whereas C4.5 and C5.0 have the same cost on the lympographic data with values of 1058.
Table 7 shows the time needed during the testing process in machine learning. The data is taken during the testing process from scenario 3. Based on the testing of the 5 datasets, C5.0 has a faster processing time in making decisions than C4.5. Figure 4 shows a graph of the training process time. Blue line is the line from the C4.5 process while red line is the line from the C5.0 process. Based on the graph C5.0 has a faster processing time than C4.5.
Table 6. The mean value of cost of the summary generated.
DATA SET
ID3 C4.5 C5.0
ID3 ID3+PSO ID3+PSO
+META C4.5
C4.5+PS O
C4.5+PS
O+META C5.0
C5.0+PS O
C5.0+PSO+ META
Vechile 156800 156800 156800 23762 21632 15138 22898 23762 17298
Glass 41472 41472 41472 9248 9248 8192 9800 8192 5202
Lympografi 15138 15138 15138 2592 1568 1058 2738 1682 1058
Wine 28322 28322 28322 242 200 32 288 200 98
thyroid 8450 8450 8450 338 338 392 288 288 162
Table 7.Time of process training
C4.5+PSO+META C5.0+PSO+META
Vechile 124 s 101 s
Glass 31 s 22 s
Lympografi 28 s 18 s
Wine 6 s 6 s
Thyroid 7 s 5 s
Figure 4. Comparison time of training process
4. CONCLUSION
This paper is compiled based on the literature and theoretical concepts of data mining and machine learning to find a solution to handle multi-class imbalanced data problems. In this research 3 proofs were conducted. First proof, using scenario 2, PSO can improve the performance of C5.0 as shown in Table 5. The second proof, using scenario 3, C5.0 has a better performance than ID3 and C4.5. C5.0 has a percentage of performance of 40.91% while C4.5 and ID3 are 40.24% and 19.23% as shown in Figure 3. The third proof, based on Table 7, C5.0 has a faster time in making decisions than C4.5. Based on these three proofs, it
can be concluded that cost sensitive decision tree C5.0 method has a better performance than using ID3 and C4.5 for solving multiclass imbalanced data problems. In future research, C5.0 can be combined with the cost sensitive learning method using Meta learning sampling techniques such as costing and weighting to obtain a more optimal classifier performance.
REFERENCES
[1] H. Ali, M. N. M. Salleh, R. Saedudin, and K. Hussain, “Imbalance class problems in data mining: a review,”
Indones. J. Electr. Eng. Comput. Sci., vol. 14, no. 3, pp. 1560-1571, 2019.
[2] H. He and E. A. Garcia, “Learning from imbalanced data,” IEEE Trans. Knowl. Data Eng., vol. 21, no. 9, pp. 1263-1284, 2009.
[3] S. Wang and X. Yao, “Multiclass Imbalance Problems: Analysis and Potential Solutions,” IEEE Trans. Syst. Man. Cybern, vol. 42, no. 4, pp. 1119–1130, 2012.
[4] R. Longadge, S. S. Dongre, and L. Malik, “Class imbalance problem in data mining: review,” Int. J. Comput. Sci. Netw., vol. 2, no. 1, pp. 83–87, 2013.
[5] N. V. Chawla, A. Lazarevic, L. O. Hall, and K. W. Bowyer, “SMOTEBoost: Improving Prediction of the Minority Class in Boosting,” Proceeding. Knowl. base Discov. Databases, pp. 107–119, 2003.
[6] A. Freitas, A. da Costa Pereira, and P. Brazdil, “Cost-Sensitive Decision Trees Applied to Medical Data.,” DaWaK, vol. 4654, pp. 303–312, 2007.
[7] A. Motwani, P. Chaurasiya, G. Bajaj. “Predicting Credit Worthiness of Bank Customer with Machine Learning over Cloud,” IJCSE, vol.6, No. 7 pp. 2347–2693. 2018.
[8] C. Wang, R. Li and Z. Chen. “Partition cost-sensitive CART based on customer value for Telecom customer churn prediction,” Proceedings of the 36th Chinese Control Conference, 2017.
[9] N. Santoso, W. Wibowo, H. Hilmawati, “Integration of synthetic minority oversampling technique for imbalanced class,” Indones. J. Electr. Eng. Comput. Sci., vol. 13, no. 1, pp. 102–108, 2019.
[10] S. Barua, M. Islam, X. Yao, and K. Murase, “MWMOTE-Majority Weighted Minority Oversampling Technique for Imbalanced Data Set Learning,” IEEE Trans. Knowl. Data Eng., vol. 26, no. 2, pp. 405-425, 2014.
[11] GU Qiong, et al. “An improved SMOTE algorithm based on genetic algorithm for imbalanced data classification,”
J Dig Inf Manag, vol. 14, no. 2, pp. 92–103, 2016.
[12] K. Polatand S. Gunes. “A novel hybrid intelligent method based on C4.5 decision tree classifier and one-against-all approach for multi-classclassification problems,” Expert Systems with Applications, vol.36, pp. 1587-1592, 2009. [13] H. He and E. A. Garcia, “Learning from imbalanced data,” IEEE Trans. Knowl. Data Eng., vol. 21, no. 9, pp.
1263-1284, 2009.
[14] S.A. Shilbayeh. “Cost Sensitive Meta Learning,” Submitted in Partial Fulfilment of the Requirements of the Degree of Doctor of Philosophy, 2015.
[15] A.N. Haldankar. “A Cost Sensitive classifier for Big Data.” IEEE International Conference on Advances in Electronics, Communication and Computer Technology (ICAECCT), 2016.
[16] C. X. Ling, V. S. Sheng, and Q. Yang, “Test strategies for cost-sensitive decision trees,” IEEE Trans. Knowl. Data Eng., vol. 18, no. 8, pp. 1055-1067, 2006.
[17] F. Jauhari, A. A. Supianto, “Building student’s performance decision tree classifier using boosting algorithm,”
Indones. J. Electr. Eng. Comput. Sci., vol. 14, no. 3, pp. 1298–1304, 2019.
[18] C. X. Ling, V. S. Sheng, “Cost Sensitive Learning and the Class Imbalance problem,” Encyclopedia of machine learning. Spinger, 2008.
[19] B. Baykara. “Impact of Evaluation Methods on Decision Tree Accuracy,” M.Sc. thesis, pp. 72, 6 index pages, 2015. [20] A.S. Galathiya. “Improved Decision Tree Induction Algorithm with Feature Selection, Cross Validation, Model
Complexity and Reduced Error Pruning,” (IJCSIT) Vol. 3 (2), pp. 3427-3431, 2016.
[21] R. Batuwita and V. Palade, “A new performance measure for class imbalance learning. Application to bioinformatics problems,” 8th Int. Conf. Mach. Learn. Appl. ICMLA 2009, pp. 545–550, 2009.
[22] P. Domingos. “Metacost: A general method for making classifiers cost-sensitive.” In Proc. of the fifth ACM SIGKDD international conference on Knowledge discovery and data mining, ACM New York, NY, USA, pp 155– 164, 1999.
[23] S. Wang and X. Yao, “Multiclass Imbalance Problems: Analysis and Potential Solutions,” IEEE Trans. Syst. Man. Cybern., vol. 42, no. 4, pp. 1119–1130, 2012.
[24] S. Zhang, C. Zhang and Q. Yang. “Data preparation for data mining.” Applied Artificial Intelligence an International Journal, Vol. 17, pp. 5-6p, 2010.
[25] N.T. Nghe, Z. Gantner, and L.S. Thieme. “Cost-sensitive learning methods for imbalanced data,” In the 2010 International joint conference on l networks (IJCNN), pp. 1–8, 18–23, 2010.
[26] L. Yin, Y. Ge, K. Xiao, X. Wang, and X. Quan, “Feature selection for high-dimensional imbalanced data,”
Neurocomputing, vol. 105, pp. 3-11, 2013.
[27] B.N. Patel, S.G. Prajapati and K.I. Lakhtaria, “Efficient Classification of Data Using Decision Tree,” Bonfring international journal of data mining, Vol. 2, No. 1, 2012.
[28] N. Santoso, W. Wibowo, H. Hilmawati, “Integration of synthetic minority oversampling technique for imbalanced class,” Indones. J. Electr. Eng. Comput. Sci., vol. 13, no. 1, pp. 102-108, 2019.