Int. J. Food System Dynamics 4 (3), 2013, 159-169
Efficiency and Integration in the Food Supply Chain
*
Sebastian Jarzebowski, Agnieszka Bezat-Jarzebowska, and Bogdan Klepacki
Warsaw University of Life Sciences , Poland
sebastian_jarzebowski@sggw.pl; agnieszka_bezat_jarzebowska@sggw.pl; bogdan_klepacki@sggw.pl Received February 2013, accepted June 2013, available online November 2013
ABSTRACT
Due to the nature of the food supply chain, an increase of the integration's degree in the chain may be an important aspect in the context of increasing the efficiency of agri-food companies. Therefore, exploring the relationships among these variables was found as an important research area and adopted as the goal of the paper. The paper is focused mainly on the theoretical background showing the relationship between integration and performance. A description of the theoretical and methodological aspects of performance measurement and its extension (including the integration aspect) was also made within the framework of the paper.
For an empirical illustration of the analyzed relationships two steps were made. Firstly, the integration's degree in the food chain was measured. Secondly, the efficiency of the companies from the cereals processing industry in Europe was assessed. The SFA models (e.g. Translog and Cobb-Douglas functional form) were used for assessment of efficiency. By using stochastic method (e.g. the SFA, Stochastic Frontier Analysis), one may show the influence of external variable (the integration in the supply chain) on the efficiency performance of enterprises. Efficiency of economic entities is not an unambiguous term. There are several different concepts of efficiency, its measurement and expressions. Within the framework of efficiency, many terms of similar meaning may be applied. However, these concepts are not identical. The actual concept of efficiency is derived from the structure of the production function, therefore it is conditioned by changes in the productivity of production factors and their remuneration and refers to the allocation of production factors in the most technically efficient way.
Keywords: integration, food supply chain, economic performance, Stochastic Frontier Analysis
* Research granted by National Science Centre from the funds for science in years 2011-2013 as a scientific project no
2011/01/B/HS4/02612 „Stopień integracji w łańcuchu dostaw a efektywność przedsiębiorstw przetwórstwa rolno-spożywczego” ("Degree of integration in supply chain and efficiency of food processing enterprises").
1
Theoretical background
1.1 Weaknesses of the market
One should begin with the market equilibrium theory, which focal point is interaction among market participants [Kreps 1990]. This interaction is coordinated through the price mechanism – depending on relative prices, market participants (households and enterprises) take individual decisions on supply and demand, thus benefits (or profits) and number of available goods are maximized. The theory passes over an analysis of institutional circumstances. However, considering the existence of institutions and organizations* makes sense, when the central assumptions of the equilibrium theory are not fulfilled, since then one deals with functional weaknesses of the market (i.e. market outcomes are not Pareto-efficient). Elements undermining the market equilibrium theory’s assumptions are: information asymmetry and emerging on its basis transaction costs (including property rights and external effects), as well as increasing economies of scale. These elements may cause an incentive for market participants to seek together a solution in a form of institutions or organizations that would compensate functional weaknesses of the market (or eventually will use them). In this sense, institutions and organizations may be interpreted as a kind of compensation mechanism. Economies of scale, transaction costs, information asymmetry and uncertainty of the transaction may be pointed out as weaknesses of the market indicating the need for integration. In order to reduce the impact of weaknesses of the market or to take advantage of these weaknesses, various forms of cooperation between market participants are used. Such unselfish cooperative forms, as presented by Nash basing on game theory, are necessary to achieve the optimal state of the economy [Noga 2009, pp. 67]. These activities are referred to as connections with external partners, integration forms or organizations, outsourcing, hierarchical strengthening within long-term contracts, symbiotic partnerships, cooperation with external partners. These forms are a wide range of intermediate solutions between the market and hierarchy. At the same time, the forms combine elements of the market and hierarchical organization.
1.2 Performance and integration
In the literature one can find arguments indicating that the integration of resources within a single enterprise is more efficient than making transactions through the price system (the market). This is confirmed by A.D. Chandler stating that the internal organizational coordination triggers higher productivity, as well as it results in reduced costs and higher profits than coordination by the market [Chandler 1977]. The author continues that what economists call “economies of scale” does not come from an increase in the production volume within one plant, but from use of internal networks between plants within one enterprise and use of internal coordination [Gruszecki 2002, pp. 280].
The aspect of the ownership right plays here an important role. According to A.A. Alchian and H. Demsetz, owners of resources increase their productivity – and thus the efficiency of use of the resources – through cooperative specialization, and this leads to an increase in demand for various types of organizations supporting cooperation [Alchian & Demsetz 1972, pp. 777]. The integration with environment (external organizations) of the system is also highlighted (a company is understood as the system). Cooperation is here the main element of the organizational integration of a company with environment [Steffen & Born 1987, pp. 210]. Integration is described both in terms of traditional logistics functions [Gustin et al. 1995] and of removing barriers (or boundaries) between organizations [Naylor et al. 1999]. The need for integration between an enterprise and its environment increases with the degree of intensification of global competition. In this context, the concept of integration, considered as a key factor in achieving better results by an enterprise, is one of the most important topics in the scientific literature.
The analysis of the literature in the field of enterprise’s integration with environment enables to show a number of compelling evidence for existence of a relation between integration and productivity, which is acknowledged by M.T. Frohlrich and R. Westbrook; S.K. Vickery, J. Jayaram, C. Droge and R. Calantone [Frohlich & Westbrook 2001; Vickery et al. 2003]. The output of the literature on the integration between partners in the supply chain has significantly increased [van der Vaart and van Donk, 2008]. N. Fabbe-Costes and M. Jahre, in their literature review, argue that authors generally agree that stronger relationships and higher integration's degree lead to better business performance [Fabbe-Costes and Jahre 2008]. Nevertheless, D.C.K. Ho, K.F. Au, E. Newton postulated in this context to establish the structures and methods that help to describe and explain the relationship between performance of companies and integration practices in the supply chain [Ho et al. 2002, pp. 4415].
*Institutions define the rules and norms of conduct in a society; organizations are players in the society that interpret and
2
Methodological considerations
2.1 Integration measurement
Some researchers limited their analysis to integration with customers [Closs & Savitskie 2003; Fynes et al. 2005] or with suppliers [Das et al. 2006, Handfield et al. 2009, Wagner and Krause 2009]. In the literature, there are studies, in which the statement that integration in both directions (upstream and downstream) is more preferable than the integration only with customers or only with suppliers is highlighted. [Frohlich & Westbrook 2001; Rosenzweig et al. 2003]. In other studies, the authors take a broader perspective when considering the integration of both with customers and with suppliers [Lee et al. 2007] or by defining the integration of the supply chain as an unique concept involving the upstream and downstream integration [Vickery et al. 2003].
Within the framework of the paper a measure of supply chain integration's degree was constructed. The SCIDM (Supply Chain Integration Degree Measure) includes integration with both suppliers and customers†. The construction of the measure of supply chain integration can be formulated as follows:
∑∑
∑∑
= = = =
⋅
+
⋅
=
ki n
j
j i k
i n
j
j
i
ILS
IRC
ILC
IRS
SCIDM
1 1 1 1
where:
SCIDM – Supply Chain Integration's Degree Measure, IRS – Supplier Integration Range,
ILS – Supplier Integration Level, IRC – Customer Integration Range, ILC – Customer Integration Level,
i – Areas of cooperation, where
i
∈
(
1
,...,
k
)
, j – Integration activity, wherej
∈
(
1
,...,
n
)
.The aspects, that are often highlighted in the literature, were used while constructing the Supply Chain Integration's Degree Measure, emphasizing their key importance. Within the first element the differentiation of integration direction was made, thus it determines whether there is a downward integration with suppliers or an upward integration with customers or integration in both directions. The second aspect analyzed the rang of integration - areas of cooperation. In the next step, the level of integration was analyzed, which can be described as the degree of development of integration activities, respectively in both directions, supplier (ILS) and customers (ILC) within the areas of cooperation defined in the previous step (the IRS and IRC). The level of integration was measured as the number of activities in the areas and scope of sophistication of integration practices (in the scale of low, medium and high).
2.1 Production function as a base for performance measurement
It was indicated by Gutenberg that a company (within the meaning of the neoclassical theory) can be described by using the production function [see Gutenberg 1965]. The production function is defined by Gutenberg as the base function for analyzing production process [Gutenberg 1968], and it was always considered as a kind of the foundation of theoretical analyzes [Rembisz 2011] in the neoclassical economics. The production function, as a theoretical description of the input(s)-output relations, should be treated by definition as a base for enterprises' performance analysis. Thus, the production function is a reflection of the state of technology, including applied technique, organization, knowledge and experience [Bezat et al. 2012].
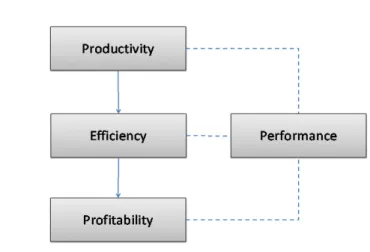
On the basis of a literature review, it may be stated that changes in efficiency are a function of changes in productivity. Efficiency changes are the basis for changes taking place in the surface of economic activities observed e.g. as changes in the profitability. These three discussed concepts, such as productivity, efficiency and profitability, can be a reference point for assessing the performance.
Figure 1. The linkage between the concepts of productivity, efficiency, profitability and performance Source: own work.
The SFA method is one of the stochastic approaches that bases on the production function and allows taking into account the statistical noise. The performance-focused modeling, presented within the framework of the paper, bases on the SFA method (the Stochastic Frontier Approach). The SFA method was applied in the paper because, firstly, it is used worldwide in researches and secondly, it is appropriate for samples with high randomness, including agri-food sector. The SFA belongs to the methods that base on the input-output relations function and allows comparing efficiency of the objects in a sample and basing on its result allows to make assumptions regarding the performance. In case of the SFA it is possible to choose one of the following production function models: Cobb-Douglas, Constant Elasticity of Substitution (CES), Translog, generalised Leontief, normalised quadratic and its variants. The Translog and the Cobb-Douglas production functions are the two most common functional forms which have been used in empirical studies on production, including frontier analyses [Battese & Broca 1997, pp. 357]. The Cobb-Douglas and Translog production functions were included in the study.
3
Application of the extended SFA method
3.1 Dataset
The efficiency assessment is carried out on the basis of the data collected from cereals primary processing enterprises (i.e. flour mills) across Poland (a panel data for the period 2009–2011)‡. The sample covers from 85 up to 87 companies, depending on the analyzed year. The production data is reported as revenue/expenditure expressed in PLN in current prices. The production frontiers are fitted for a single output and two inputs.
To assess the involvement of the production factors used in the models in the SFA method, based on a literature review of studies in the field of efficiency, the values of fixed assets (x1) and the operating costs
(x2) were included. In terms of variables incorporated into the models to assessing the efficiency it can be
stated that, in most of the studies, operating costs and material costs ware used for an input§. The value of fixed assets, as a variable on the input side while evaluating efficiency, was used in numerous publications**.
As it results from the literature review the efficiency improvement is a central element in the company’s way to achieve its objectives, i.e. profit maximization††. The effect of the company's activities expressed in a financial measure (profit / revenue / income, value added and / or sales) was included in the
‡Within the framework of a scientific project financed by National Science Centre in Poland.
§ For example the research of: P.A. Viton, E. Martinez-Budria, R. Diaz-Armas, M. Navarro-Ibanez, T. Ravelo-Mes, J.C. Martin
and C. Roman, T.H. Oum and C. Yu [Viton 1992, Martinez-Budria et al. 1999, Martin and Roman 2001, Oum and Yu 2004].
** Please see the works of: J.T. Doutt, L.P. Bucklin, A.C. Charnes, W.W. Cooper and S. Li, R. Rusielik, P. Keat and P. Young and
M. Helta and M. Świtłyk [Doutt 1984, Bucklin 1978, Charnes et al. 1989, Rusielik 1999, Keat and Young 2003, Helta and Świtłyk 2008].
†† Compare: [Berle and Means 1932; Friedman 1953; Baumol 1959; Penrose 1959; Marris 1964; Machlup 1967; Stigler 1968;
assessment of the efficiency‡‡. Category profit could then be incorporated into the model on the side of results. However, due to the presence of a strong relationship between operating costs and profit, the category of net revenues from sales of goods and materials (y) was included on the outputs’ side§§.
3.2 Selection of a functional form and specification of the model
As a parametric approach, the SFA requires assuming a specific functional form that determines the input(s)-output relation a priori [Coelli et al. 2005]. One of them is the Cobb-Douglas function that is widely used in the empirical studies [Fried et al. 2008]. The adequacy of the Cobb-Douglas should be tested against a less restricted functional form, which is the Translog function [Piesse and Thirtle 2000, pp. 474].
Thus, the study involves two functional forms describing the input(s)-output relations, namely the Cobb-Douglas (equation 1) and Translog model (equation 2). The tested frontier models take following form***:
0 1 1 2 2
ln
y
i= +
b
b
ln
x
i+
b
ln
x
i+ −
v
iu
i (1) and2 2
0 1 1 2 2
1 1
1
ln
ln
ln
ln
ln
2
i i i jl ij il i i
j l
y
b
b
x
b
x
b
x
x
v
u
= =
= +
+
+
∑∑
+ −
(2)where:
i – index indicating objects i=1,…,I, where i is a number of objects in a sample, j – index indicating inputs j=1,…,l,
yi – output of an object i,
xij – input j of an object i,
– vector of parameters to be estimated,
– random variable representing the random error, so called statistical noise,
– a positive random variable associated with technical efficiency (TE).
The comparison of the selected functional forms is carried out basing on the likelihood ratio test statistics. The LR statistics has the following form:
2[ln ( ) ln ( )]
LR
= −
L R
−
L N
(3)where:
lnL(R) – logarithm of the maximum likelihood value in the restricted model, lnL(N) – logarithm of the maximum likelihood value in the non-restricted model.
Results of testing the functional forms of the models were shown in the Table 1.
‡‡ Please see the works of: L.P. Bucklin, J.T. Doutt, A.C. Charnes, W.W. Cooper, S. Li., E. Martinez-Budria,
R. Diaz-Armas, M. Navarro-Ibanez, T. Ravelo-Mes, A. Athanassopoulos, L.F. Angulo and J. Rialp also R. Sellers-Rubio and F.J. Masa-Ruiza [Bucklin 1978; Doutt 1984; Charnes et al. 1989; Martinez-Budria et al. 1999; Athanassopoulos 2004; Angulo and Rialp 2007; Sellers-Rubio and Mas-Ruiz 2009].
§§ The terminology of inputs and output is consistent with the terminology used in the financial statements.
*** In these equations, lny is the logarithm of output and the two independent variables (lnx
j) are the logarithms
Table 1.
Likelihood ratio statistics and verification of model's selection
years lnL(R) lnL(N) LR result(1) model
2009 -130,64 -130,97 -0,66** fail to reject of H0 Cobb-Douglas
2010 -118,15 -116,90 2,50** fail to reject of H0 Cobb-Douglas
2011 -126,21 -122,35 7,73** fail to reject of H0 Cobb-Douglas
(1) The value of test statistic for χ2(3) distribution amounts 7,82 at the significance level of 0,05 (**) and 11,34 at the
significance level 0,1 (*).
Source: own calculations by using R software.
The likelihood ratio tests lead to acceptance of the null hypothesis, saying that the Cobb-Douglas (a model with restrictions on parameters) better describes the inputs-output relations (equation 1). Therefore, the empirical results obtained from estimating only the Cobb-Douglas††† function are reported in the section 3.3. The frontier model that has been tested takes the following form:
0 1 1 2 2
exp(
ln
ln
)
i i i i i
y
=
b
+
∑
b
x
+
∑
b
x
+ −
v
u
(4)The maximum-likelihood estimates of the parameters were calculated for the selected stochastic frontier production functions.
The efficiency ratio – in the case of the stochastic frontier function – is measured as a relation between an observed output (value y, equation 4) and maximum output possible to be achieved in environment characterized by exp(vi) (value y*). Hence, the ratio may be written as:
0 1 1 2 2
*
0 1 1 2 2
exp(
ln
ln
)
exp(
)
exp(
ln
ln
)
i i i i
i
i i
i i i i
b
b
x
b
x
v
u
y
TE
u
y
b
b
x
b
x
v
+
+
+ −
=
=
=
−
+
+
+
∑
∑
∑
∑
(5)
On the basis of equation (4) it can be stated that the value of the TE ratio varies from 0 to 1, where 1 indicates the technical efficiency. Otherwise TEi<1 provides a measure of the shortfall of an observed
output from maximum feasible output in an environment characterized by exp(vi), and indicates the
inefficiency‡‡‡.
It is assumed that ui is characterized by the limited-normal distribution truncated in zero which is
described by the following expression:
2
( ,
)
i u
u
N
+µ σ
(6)3.3 Relationship of integration and performance
In the case of the SFA, it is possible to examine the impact of exogenous variables (not included in the adopted function) on the level of the variable ui [Sellers-Rubio and Mas-Ruiz 2009, pp. 663, Coelli 1996,
pp. 7]. The influence of potential determinants of technical efficiency can be estimated in terms of the location parameter in the truncated normal distribution [Battese and Coelli 1995]. The location parameter becomes firm-specific and is assumed to depend on some variable’s vector zi according to
the following relation§§§:
(7) where:
††† At first sight the (linear-homogeneous) Cobb-Douglas production function has a clear disadvantage since it does not
allow the identification of the nature of technological progress [Welfens 2005]. The production function imposes more stringent assumptions on the data than the Translog function, because the elasticity of substitution has a constant value of 1 (i.e. the assumption on functional form imposes a fixed degree of substitutability on all inputs).
‡‡‡ Note that TE takes values from the range (0,1) only if u is restricted to be non-negative.
– independent variables of a i-th object associated with inefficiency****, δ – vector of parameters of the firm-specific inefficiency variables.
Within the framework of the paper the vector zi is represented by one variable, namely the firm-specific
SCDIM. Thus, we have:
(8)
The efficiency scores for individual objects obtained by using the model in equation (5) obviously differ from the efficiency scores obtained by using the model in terms of the location parameter which is determined by various explanatory variables (here SCDIM) and an addictive random error which was expressed in equation (8).
It should be noted that estimation of the parameter determines the strength of influence of the variable SCDIM on increasing the inefficiency level of the analyzed group, thus a negative value of the parameter indicates a positive influence on efficiency and a positive value – a negative influence on efficiency.
The variable characterizing the integration's degree of analyzed objects (variable: SCDIM, see the previous part of the paper) was applied in the model. The SCIDM was calculated for each year separately.
The maximum likelihood estimations of the Cobb-Douglas function's parameters are presented in Table 2. Parameters b0, b1, b2 belong to the Cobb-Douglas function - equation 4, and the parameters δ0 andδ1 -
to the function expressing the influence of the integration within the supply chain on the efficiency. The parameters b1, b2, δ1 estimated in each model (i.e. Z-2009, Z-2010, Z-2011) are statistically significant at
the significance level lower than 0,1.
Table 2.
The maximum likelihood estimates of the Cobb-Douglas function's parameters
variables parameter
Z-2009 Z-2010 Z-2011
param eter's
value T-value p
param eter's
value T-value p
param eter's
value T-value p intercept b0 2,88 2,95 *** 0,74 0,72 0,74 0,67
X1 b1 0,39†††† 3,11 *** 0,54 4,53 *** 0,18 2,06 **
X2 b2 0,26 1,69 * 0,23 1,68 * 0,55 4,41 ***
intercept δ0 3,58 9,21 *** -1,85 -0,16 0,29 0,55
SCIDM δ1 -0,01 -2,65 *** -0,04 -1,95 * -0,04 1,74 *
number of
observations 85 87 86
Signif. codes: 0.01 ‘***’ 0.05 ‘**’ 0.1 ‘*’ Source: own calculations.
The influence of integration on performance (efficiency) of the analyzed group can be indicated basing on the value of parameter (δ1) from the model Z-2009, Z-2010 and Z-2011. The parameter (δ1) takes values
from -0,01 (model Z-2009) to -0,04 (model Z-2010 and Z-2011), and the parameter (δ1) is significant at the
significance level of 0,05 for models 2009 and at the significance level of 0,1 for model 2010 and Z-2011. The value of the parameter (δ1) indicates that the increase in integration's degree by one unit
determines - according to model Z-2009 - the decrease in inefficiency by 0,01 (by 1 percentage point)‡‡‡‡
and - according to models Z-2012 and Z-2011 - the decrease in inefficiency by 0,04 (by 4 percentage
**** It should be noted that estimation of the parameters of the vector z
i determines the strength of the influence of a given
variable on increasing the inefficiency level of the analyzed group.
†††† One can observe not very high values of b
1 and b2 which indicates relatively strong diminishing returns to scale. The
reason for that may be that the data set used in the paper includes real data. Nevertheless, the agricultural sector in Poland is characterized by decreasing returns to scale. [Kulawik 2008].
‡‡‡‡ The efficiency score TE takes value between 0 and ,1 thus a change by 0,01 can be interpreted as a change by 1
points), thus the calculated value of the parameter (δ1) indicates the positive influence of integration on
the efficiency of enterprises in the analyzed sample.
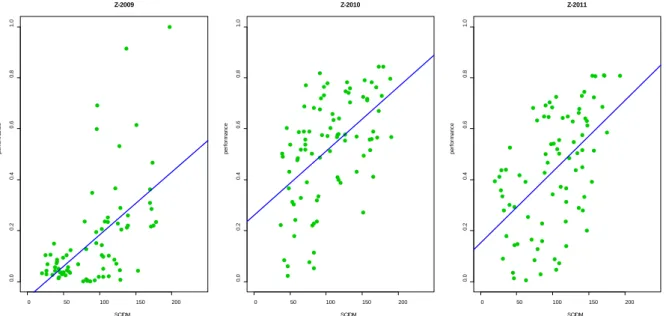
In order to visualize, the relationships of the efficiency ratios and the values of SCDIM for the analyzed companies were presented in Figure 2. Scatter plots determining the strength of the relationships between the two discussed variables are presented for each of the models. The efficiency scores obtained by estimating the model (equation 4) were presented in the Figure 2.
0 50 100 150 200
0. 0 0. 2 0. 4 0. 6 0. 8 1. 0 Z-2009 SCIDM per for m anc e
0 50 100 150 200
0. 0 0. 2 0. 4 0. 6 0. 8 1. 0 Z-2010 SCIDM per for m anc e
0 50 100 150 200
0. 0 0. 2 0. 4 0. 6 0. 8 1. 0 Z-2011 SCIDM per for m anc e
Figure 2. The relationship between the efficiency and the integration's degree for cereals processing companies in the period 2009-2011
Source: own work, the graph generated in the R software [R 2008].
On the basis of the analyzes of the functions presented in Figure 2, it was confirmed that the relationship between the efficiency ratios and the integration's degree is positive in each of the analyzed years. In other words, with an increase in the integration's degree the efficiency ratio increases (Pearson's correlation coefficients for these variables are greater than 0,53 at the significance level of 0,01). The visualization plotted in Figure 2 can be treated as an additional confirmation of the positive relationship between integration's degree and efficiency.
4
Discussion
Within the framework of the paper the theoretical background for relationships between performance and integration was presented. In order to analyze the relationship, the performance-focused modeling based on the extended SFA method was applied for the sample of grain processing companies in Poland. Some theoretical and analytical implications for modeling of relationship between performance and integration were explored in the study as well.
4.1 Theoretical implications
When analyzing an enterprise performance one should keep in mind not only its internal activities but also relationship to the environment. It is obvious that to ensure continuous improvement of the performance each enterprise should have some kind of symbiotic relations with its suppliers and customers. This aspect of analysis was shown in the economic literature. Elements like: information asymmetry and emerging on its basis transaction costs (including property rights and external effects), as well as increasing economies of scale undermine the market equilibrium theory’s assumptions and may cause an incentive for market participants to organize collaborative activities. These activities are referred to as connections with external partners in form of integration. One may argue that the cooperative forms are necessary to achieve the optimal state of the economy.
4.2 Analytical implications
As it was shown in the paper the stochastic frontier approach can be a useful tool for estimating the performance of the enterprises. Nevertheless the approach was extended by applying into the models an external variable (not included in the analyzed model). It should be noted that the estimation of the
parameters of the vector zi determines the strength of influence of a given variable on increasing the
inefficiency level of the analyzed group, thus a negative value of the parameter indicates a positive influence on efficiency.
5
Conclusions
It is clear that there are some theoretical foundations and emerging evidence of a positive relationship between supply chain integration and performance of a company. Within the framework of the paper some empirical studies confirming this statement were also mentioned. Nevertheless, there is still a need to search for new structures and methods that help to describe and explain the relationship between integration and performance practices of companies in the supply chain. The paper can be treated as the next step made within the framework of the literature discussion on the methodological explanation of the relationship between the integration and performance.
Acknowledges
We would like to thank EAAE seminar participants for helpful comments. We are grateful to Editors and the reviewer for insightful remarks and suggestions.
References
Alchian, A.A., Demsetz, H. (1972). Production, information costs, and economic organization. American
Economic Review, Vol. 62, Nr 5: 777-795.
Angulo, L.F., Rialp, J. (2007). The effect of Marketing Efficiency, Brand Equity and Customer Satisfaction on Firm Performance: An Econometric Model and Data Envelopment Approach. [w:] Improving Business reporting: new rules, new opportunities, new trends. Giuffrè Edditore. [Tryb dostępu: dostępne na: http://webs2002.uab.es/dep-economia-empresa/Jornadas/Papers/2006/Angulo.pdf, data odczytu: grudzień 2012].
Athanassopoulos, A. (2004). Assessing the selling function in retailing: insights from banking, sales forces, restaurants and betting shops. [w:] Cooper W.W. (red.), Seiford L.M., Zhu J. (2002): Handbook on data envelopment analysis. Kluver Academic, Boston-London: 455-479.
Battese, G.E., Broca, S.S. (1997). Functional Forms of Stochastic Frontier Production Functions and Models for Technical Inefficiency Effects: A Comparative Study for Wheat Farmers in Pakistan. Journal of Productivity
Analysis, 8: 395-414.
Battese, G.E., Coelli, T.J. (1995). A Model for Technical Inefficiency Effects in a Stochastic Frontier Production Function for Panel Data. Empirical Economics, 20: 25-32.
Baumol, W.J. (1959): Business Behavior, Value and Growth, Macmillan, Nowy Jork.
Berle, A.A., Means, G.C. (1932).: The Modern Corporation and Private Property, Macmillan, Nowy Jork.
Bezat, A., Sielska, A., Rembisz, W. (2012). Wybrane postacie analityczne funkcji produkcji w ocenie relacji czynnik-czynnik oraz czynnik-produkt dla gospodarstw rolnych FADN. [Selected analytical forms of the production function in the evaluation of the factor-factor and factor-product relationships for FADN farms]. Studia i Monografie, 154, Warsaw: IERiGŻ-PIB.
Bucklin, L.P. (1978). Productivity in Marketing. Chicago, IL, AMA – American Marketing Association.
Chandler, A.D. (1977). The Visible Hand. The Managerial Revolution in American Business, Harvard University Press, Cambridge.
Charnes, A.C., Cooper, W.W., and Li, S. (1989). Using Data Envelopment Analysis to Evaluate Efficiency in the Economic Performance of Chinese Cities. Socio-Economic Planning Sciences, Vol. 23, No 6: 325-344.
Closs, D.J., Savitskie, K. (2003). Internal and external logistics information technology integration, The
International Journal of Logistics Management, Vol. 14 No. 1: 63-76.
Coelli, T.J. (1996). A Guide to Frontier Version 4.1: A Computer Program for Stochastic Frontier Production and Cost Function Estimation. Armidale: University of New England, CEPA Working Papers.
Coelli, T.J., Rao, D.S.P., O`Donnell, Ch.J., and Battese, G.E. (2005). An introduction to efficiency and productivity analysis. 2. Edition, New York: Springer.
Das, A., Narasimhan, R. and Talluri, S. (2006). Supplier integration – finding an optimal configuration, Journal of
Operations Management, Vol. 24 No. 5: 563-82.
Doutt, J.T. (1984). Comparative Productivity Performance in Fast-Food Retail Distribution. Journal of Retailing, Vol. 60, No. 3: 98-106.
Fabbe-Costes, N., Jahre, M. (2008). Supply Chain Integration Improves Performance. A review of the Evidence.
The International Journal of Logistics Management, 19:2: 130-154.
Friedman, M. (1953). Essays in Positive Economics, University of Chicago Press, Chicago.
Frohlich, M.T., Westbrook R. (2001). Arcs of integration: an international study of supply chain strategies.
Journal of Operations Management, 19:2: 185-200.
Fynes, B., de Burca, S., and Voss, C. (2005). Supply chain relationship quality, the competitive environment and performance. International Journal of Production Research, Vol. 43, No. 16: 3303-20.
Gruszecki, T. (2002). Współczesne teorie przedsiębiorstwa [Modern enterprise's theories], Wydawnictwo Naukowe PWN, Warszawa.
Gustin, C.M., Daugherty, P.J., and Stank, T.P. (1995). The effects of information availability on logistics integration. Journal of Business Logistics, 16:1:. 1-21.
Gutenberg, E. (1968). Grundlagen der Betriebswirtschaftslehre. Die Produktion. [Fundamentals of Business Management. Production], 1. Band, 14. Auflage, Berlin-Heidelberg-New York: Springer: 286-325.
Handfield, R., Petersen, K., Cousins, P., and Lawson, B. (2009). An organizational entrepreneurship model of supply management integration and performance outcomes, International Journal of Operations &
Production Management, Vol. 29, No. 2: 100-26.
Helta, M., Świtłyk, M. (2008). Efektywność techniczna spółek Agencji Nieruchomości Rolnych w latach 1994 – 2006, Roczniki Nauk Rolniczych, Seria G, Tom 95, Warszawa.
Ho, D.C.K., Au, K.F., and Newton, E. (2002). Empirical research on supply chain management: a critical review and recommendations. International Journal of Production Research, 40, 17: 4415-4430.
Jarzębowski, S. (2013). Integracja łańcucha dostaw jako element kształtowania efektywności sektora przetwórstwa rolno-spożywczego, Wydawnictwo SGGW, Warszawa.
Keat, P., Young, P. (2003). Managerial Economics: Economic Tools for Today's Decision Makers. 4th Edition, Pearson Education Inc.:292-293.
Kreps, D.M. (1990). A Course in Microeconomic Theory, Harvester Wheatsheaf, New York.
Kulawik, J. (ed.) (2008). Analiza efektywności ekonomicznej i finansowej przedsiębiorstw rolnych powstałych na bazie majątku WRSP, IERiGŻ-PIB, Warsaw.
Lee, C.W., Kwon, I.G., and Severance, D. (2007). Relationships between supply chain performance and degree of linkage among supplier, internal integration and customer, Supply Chain Management: An International
Journal, Vol. 12, No. 6: 444-52.
Machlup, F. (1967). Theories of the Firm: Marginalist, Behavior, Managerial. American Economic Review, Vol.
57, No. 1: 1-33.
Marri,s R. (1964). The Economic Theory of "Managerial" Capitalism, Macmillan, Nowy Jork.
Martin, J.C., Roman, C. (2001). An application of DEA to measure the efficiency of Spanish airports prior to privatization. Journal of Air Transport Management, Vol. 7, No. 3: 149-157.
Martinez-Budria, E., Diaz-Armas, R., Navarro-Ibanez, M., and Ravelo-Mesa, T. (1999). A Study of the Efficiency of Spanish Port Authorities Using Data Envelopment Analysis. International Journal of Transport Economics, Vol. XXVI, No. 2:. 237-253.
Naylor, J.B., Naim, M.M., and Berry, D. (1999). Leagality: Integrating the lean and agile manufacturing paradigms in the total supply chain, International Journal of Production Economics, 62: 199-213.
Noga, A. (2009). Teorie przedsiębiorstw. [Enterprises' theories], Polskie Wydawnictwo Ekonomiczne, Warszawa.
Oum, T.H., Yu, C. (2004). Measuring airports' operating efficiency. Transportation Research Part E: Logistics &
Transportation Review, Vol. 40, No. 6: 515-532.
Penros,e E.T. (1959). The Theory of Growth of the Firm, John Wiley & Sons, Nowy Jork.
Piesse, J., Thirtle, C. (2000). A Stochastic Frontier Approach to Firm Level Efficiency, Technological Change and Productivity during the Early Transition in Hungary. Journal of Comparative Economics, 28: 473-501. R, R Development Core Team (2008). A language and environment for statistical computing. R Foundation for
Statistical Computing, Vienna, available online at: http://www.R-project.org, (accessed September 2012). Rembisz, W. (2011). Analityczne właściwości funkcji produkcji rolniczej. [Analytical features of the agricultural
production function]. Komunikaty, Raporty, Ekspertyzy, nr 544, Warsaw: IERiGŻ-PIB: 6.
Rosenzweig, E.D., Roth, A.V, and Dean, J.W. Jr (2003). The influence of an integration strategy on competitive capabilities and business performance: an exploratory study of consumer products manufacturers. Journal
of Operations Management, Vol. 21, No. 3: 437-56.
Rusielik, R. (1999). DEA – zastosowanie w badaniach efektywności spółek AWRSP. [w:] Strategiczne modele funkcjonowania spółek handlowych AWRSP. Akademia Rolnicza w Szczecinie: 113-176.
Sellers-Rubio, R., Más-Ruiz, F.J. (2009). Technical efficiency in the retail food industry: the influence of inventory investment, wage levels and age of the firm. European Journal of Marketing, 43:5/6: 652–669. Simon, H.A. (1976). Działanie administracji. Proces podejmowania decyzji w organizacjach administracyjnych,
Wyd. PWN, Warszawa.
Steffen G., Born, D. (1987). Betriebs- und Unternehmensführung in der Landwirtschaft [Farms and enterprises management in agriculture], UTB für Wissenschaft, Stuttgart.Stigler 1968;
van der Vaart, T., van Donk, D. (2008). A critical review of survey-based research in supply chain integration,
International Journal of Production Economics, Vol. 111 No. 42: 42-55.
Vickery, S.K., Jayaram, J., Droge, C., and Calantone, R. (2003). The effects of an integrative supply chain strategy on customer service and financial performance: an analysis of direct versus indirect relationships, Journal
of Operations Management, 21: 532-539.
Viton, P.A. (1992). Consolidations of scale and scope in urban transit. Regional Science and Urban Economics, Vol. 22, No. 1: 25-49.
Wagner, S., Krause, D.R. (2009). Supplier development: communication approaches, activities and goals,
International Journal of Production Research, Vol. 47, No. 12: 3161-77.
Welfens, P.J.J. (2005). A Quasi-Cobb Douglas Production Function with Sectoral Progress: Theory and Application to the New Economy, Bergische Universität Wuppertal, EIIW paper No. 131, Wuppertal.