1. Introduction
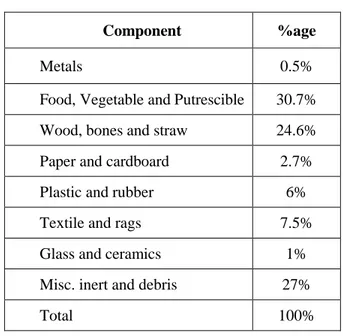
The management of Municipal Solid Waste (MSW) is a highly neglected area of the overall environmental management in most developing countries. Developing nations are now seriously concerned with the consequences of improper handling of MSW [1]. In Pakistan, MSW management generally comprises primary and secondary collection and open dumping of more than 90% of the collected waste. Of the total solid waste generated, only 60% is actually collected in most cities, while the uncollected waste lies in topographic depressions, vacant plots, along streets, roads and railway lines, drains, storm drains and open sewers within overall urban limits [2]. In Lahore, about 5,000 tons of the solid waste is generated per day (0.5 - 0.65 kg per capita per day) [2]. The composition of generated waste in Lahore is as follows [3-7].
Table 1: Composition of Waste Generated in Lahore
Component %age
Metals 0.5%
Food, Vegetable and Putrescible 30.7% Wood, bones and straw 24.6% Paper and cardboard 2.7% Plastic and rubber 6% Textile and rags 7.5% Glass and ceramics 1% Misc. inert and debris 27%
Total 100%
Evaluation of Kitchen Waste Composting and its Comparison with
Compost Prepared from Municipal Solid Waste
Sajjad Haydar
1and Junaid Masood
21 Professor, Institute of Environmental Engineering & Research, University of Engineering & Technology, Lahore. 2 Undergraduate student, Institute of Environmental Engineering & Research, University of Engineering and
Technology, Lahore.
Abstract
Solid waste management is a serious issue in big urban areas due to large amounts of waste being generated. For example, in Lahore 5000 tons of solid waste is generated daily. Out of which only 70% is collected and disposed in unmonitored dumping sites, which is a cause of severe environmental impacts. Huge amount of money is involved in the collection and disposal of this solid waste. Present study is an effort to find a technique for reducing the amount of solid waste being collected and dumped. For this purpose kitchen waste composting was studied. Windrow composting was carried out from the kitchen waste in three different windrows with varying amounts of kitchen waste. One out of the three windrows was supplemented with sewage and animal manure to observe change in quality and reduction in composting period. The prepared composts and a compost sample from existing Municipal Solid Waste Composting facility, Lahore Compost (PVT) Ltd, were analyzed in the laboratory for quality. The results of the study demonstrated that the compost prepared from kitchen waste was better in terms of organic content (44.25% as compared to 26.24%) and C/N ratio (10.67:1 as compared to 6.77:1). Moreover, it was also concluded that the composting period is reduced from 3 months to 1 month by the use of sewage. If composting of kitchen waste is carried out in backyards of homes then the amount of solid waste entering the system in Lahore can be reduced by 30%, which is a substantial reduction.
Only 76% of generated waste (3800 tons/day) in Lahore is collected [3-7] and sent to the dumping sites at: (a) Mehmood Booti; (b) Saggian; and (c) Baggarian. Waste is being dumped without proper treatment at these sites. This causes critical impacts to ground and underground water system and soil. The remaining 24% uncollected waste remains on streets, roads and open spaces. It is widely accepted that uncontrolled dumping either in landfills or in open spaces may cause serious threats to soil and underground water and threaten human health directly or indirectly [8-12].
These risks can be reduced considerably by reducing the amount of waste that is dumped or left uncollected. This can be achieved by following onsite composting of kitchen waste. The composting of kitchen waste not only reduces the amount of waste entering the waste management system but it also provides a beneficial end product (compost – a fertilizer) free of cost. More than 30% of the waste generated in Lahore is kitchen waste. Therefore, a 30% reduction of waste in the overall waste management system can be achieved by the practice of kitchen waste composting.
At present a MSW composting plant (Lahore Compost (PVT) Ltd. (LCL)) is operational at Mehmood Booti. It utilizes a portion of the MSW entering the Mehmood Booti landfill site for the preparation of compost therefore it does not take care of the waste that is uncollected and dumped in open spaces. Moreover, the quality of compost prepared from MSW and Kitchen waste may differ from each other due to the difference in the source of the two wastes. The present study was conducted to compare the quality of kitchen waste compost with compost prepared at LCL from MSW and investigate the conditions for the preparation of better quality compost.
2. Materials and Methods
2.1 Raw Material for Composting
Composting requires the presence of two types of materials a) Nitrogenous (material rich in nitrogen) and b) Carbonaceous (material rich in carbon) materials in a proportion. This proportion of carbonaceous or nitrogenous materials depends upon
the quality of required compost. A ratio near 1:1 is usually preferred. [13-15].
For this study kitchen waste was used to meet the requirements of nitrogen while carbon requirement was met by the use of dry garden waste. The kitchen waste for the study was collected in nylon bags on daily basis from the hostels of “University of Engineering & Technology” by the staff of the hostels. This practice was followed for one week for each composting pile. The kitchen waste consisted of vegetable and fruit peelings which are rich in nitrogen. The dry garden waste was collected by the garden staff from the open spaces in “University of Engineering & Technology” in nylon bags. The collection was done only once for each composting pile because of the large amount of dry garden waste present during the autumn season in the open spaces of the University.
Along with carbon and nitrogen, moisture and oxygen are also required for the microorganisms to decompose the waste into compost. A moisture content of 60% is usually maintained during the composting period for efficient operation of the microorganisms. For this purpose water was added to the windrows. For the uniform distribution of water for moisture content and for the provision of oxygen to the windrow, regular turning of the pile was done. [13-15]
2.2 Lay Out of Windrows
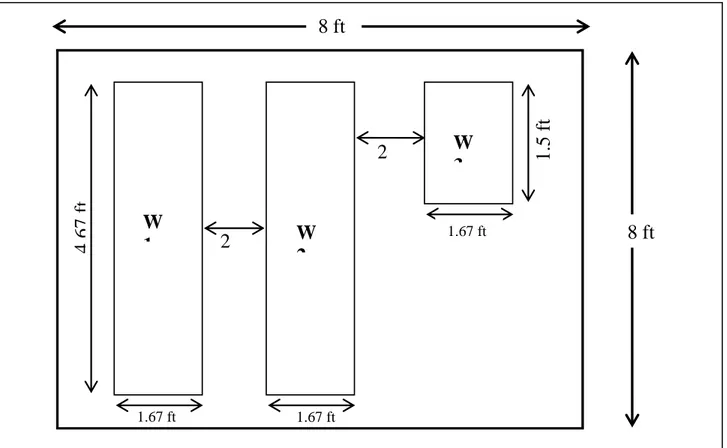
Windrow composting was selected as composting technique for this study. Therefore, an area 8ft long and 8ft wide was acquired in the “University of Engineering and Technology”. The area was cleared and three composting pads were prepared for three windrows. These windrows were desingnated as W1, W2 and W3. The layout of the windrows is shown in Figure 1.
In W1 and W2, water was used to add moisture contents while in W3, sewage was used in place of water. The size of W3 was kept smaller as compared to W1 and W2 because it was difficult to obtain sewage which was used for replenishing the moisture content in W3. The height of all the three windrows was 0.5ft.
2.2 Amount of Waste Added to Windrows
and Moisture Contents.
After the preparation of the composting pads, windrows were constructed by adding varying amounts of shredded waste in the 3 composting pads. In case of W3; 0.25 kg dry shredded cow dung was also added. The amount of waste added to each windrow is shown in Table 2.
Table 2: Quantities of Waste added in Windrows
Windrow
Kitchen Waste
(kg)
Garden Waste
(kg)
Ratio
W1 7.52 13.97 0.54:1
W2 7.71 12.47 0.62:1
W3 0.47 0.72 0.65:1
The amount of kitchen waste and garden waste mixed was kept different in all the windrows. This
was done to find a mixing ratio between kitchen and garden waste at which better quality compost is achieved. As shown by the ratios the highest quantity of kitchen waste as compared to garden waste was added in W3. In addition, 0.15 kg of dry shredded animal manure was also mixed in W3.
The moisture content of the windrows W1 and W2 for this study was maintained by the use of plain tap water. The characteristics of the tap water used are shown in table 3.
Table 3: Characteristics of Water Used
Parameters Value
pH 7.8
Total dissolved solids (TDS) mg/L 206 Hardness (as CaCO3 mg/L) 192 Chlorides (mg/L) 14
Iron (mg/L) 0.5
Total Coli form (/100 mL) 2-7 Fecal Coli form (/100 mL) 0-0
8 ft
8 ft
W
1
W
2
W
3
1.67 ft
1.67 ft 1.67 ft
2
ft
4.67 f
t
2
ft
1.5 ft
In case of W3 sewage was applied for replenishing the moisture content. The characteristics of the used sewage are shown in Table 4.
Table 4: Characteristics of Sewage Used
Parameters Value
pH 7
Total Suspended Solids (mg/L) 200 Settleable Solids (ml/l) 10
Total BOD (mg/L) 210
Total COD (mg/L) 400
Phosphorus (mg/L) 6
Total Kjehdel Nitrogen (mg/L) 40
A sample of compost prepared from MSW at LCL was also collected so that a comparison between MSW compost and compost prepared from kitchen waste during this research work could be made.
After the construction of windrows, a sample was collected from each windrow for measuring the initial moisture content. By using the value of initial moisture content the amount of water required to be added to the windrows to maintain a moisture content of 60% was calculated by the following formula.
Where,
WNDS = Weight of non- dry sample i.e. wet
weight of sample
WDS = Weight of dry sample i.e. dry weight of
sample
The calculated amount of water was applied to the W1and W2 whereas; instead of water sewage was applied to W3. Similar calculations were performed at regular intervals and if the amount of moisture content fell below 60% water and sewage was added to the respective windrows.
Along with maintaining the moisture content of the windrows, regular turning of the windrows was also done for uniform provision of heat, oxygen and moisture. The turning of the windrows was done twice a week regularly up to the curing period. The turning was done manually by hands.
2.2 Tests Conducted
Samples from W1, W2, W3 were analyzed in the laboratory for moisture content (MC), pH, organic substance, carbon content (C), nitrogen content (N), phosphorus. The C /N ratio was found out by using the values of carbon content and nitrogen content. These values were compared with the results of similar tests on the sample from LCL. All the tests were carried out as per standard procedures laid down [16-18].
3. Results and Discussion
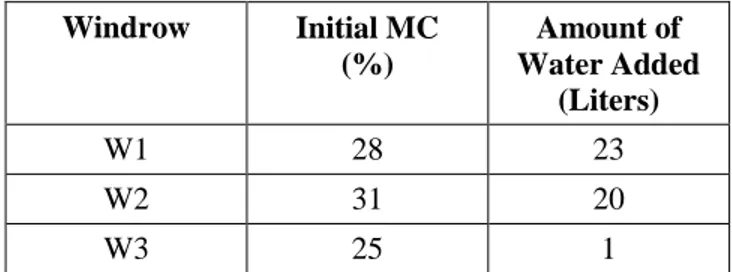
The initial moisture content (MC) of the compost raw material was measured. The purpose was to evaluate the quantity of water to be added to achieve the desired MC of 60%. The results are shown in Table 5 below.
Table 5: Initial Moisture Content and Amount of Water Added to Raise MC to 60%
Windrow Initial MC (%)
Amount of Water Added
(Liters)
W1 28 23
W2 31 20
W3 25 1
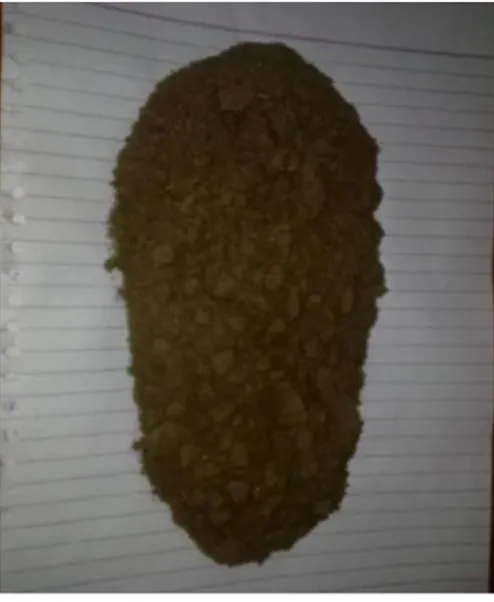
After a period of 3 months for W1 and W2 and 1 month for W3, brown humus material as shown in Figure 2 appeared. This brown humus material indicated that the composting process had finished and curing period had started. So, no more measurement of moisture content or addition of water was done. During the 1 month curing period only turning of the windrows was carried out to ensure proper provision of oxygen. After the curing period the compost was sieved through a sieve of 25mm to achieve the final product as shown in Figure 3.
Figure 2: Brown Humus Product
Figure 3: Final Product
During the composting period a 70% reduction in the volume of the waste was observed. This is because the microorganisms decompose the waste into new cells, compost and CO2. Therefore, the amount of waste which is converted into new cells and CO2 does not appear in the final product. As, a significant reduction in the volume is achieved so, this technique can be used for the reduction of waste volumes.
The analysis of the compost samples for different
3.1 pH
The pH values of the compost of the windrow W1, W2 and W3 are shown in Table 6.It can be seen in Table 6 that the pH of all the samples lies in the alkaline range with a little variation. The alkaline nature of compost is also reported in the literature [13]; A little variation can be observed in the pH. This variation is because of the characteristics of the feed stock. Incase of sample from LCL the pH is the lowest because the feed stock is MSW and it may contain certain amount of material which is acidic in nature.
Table 6: pH
Sample pH Typical Range
W1 7.95
6 - 8.4
W2 8.26
W3 8.41
LCL 7.7
3.2 Moisture Content (MC)
The MC of different compost sample has been shown in Table 7. The moisture content of all the samples is approximately equal to the typical value as shown by Table 7. The moisture content of W3 is lowest because animal manure in dry form was added in the feed stock. Thus it can be deduced that the moisture content is a function of the feed stock.
Table 7: Moisture Content
Sample Moisture Content (%) Typical Value
W1 25.69
26 %
W2 26.44
W3 24.04
LCL 26.36
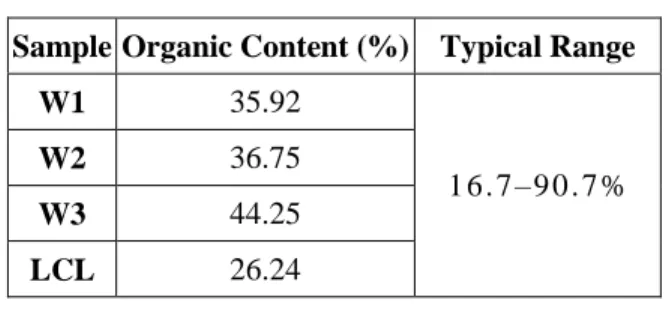
3.3 Organic Contents
The organic contents of different compost samples are shown in Table 8. The organic content of a compost sample dictates the quality of the prepared
compost. It depends upon the type of waste used as a feed stock. Higher the organic content of the feed stock higher is the organic content of the final product and better is the quality of compost. The organic content of sample from LCL is low because the feed stock is MSW which is lower in organic content as compared to kitchen waste. The organic content of W3 is highest because the amount of kitchen waste added in W3 as compared to W1 and W2 was more. Moreover, sewage was used to replenish the moisture content so it also added to the organic content of W3. There was a very little difference in the amounts of kitchen waste added in W2 and W1 so; the organic content also differs very little.
Table 8: Organic Content
Sample Organic Content (%) Typical Range W1 35.92
1 6 . 7 – 9 0 . 7 %
W2 36.75
W3 44.25
LCL 26.24
3.4 Carbon Content
The carbon contents of different compost samples have been shown in Table 9. There is no specific value for carbon but it is accepted that carbon content of a compost sample is 40% of organic content [18]. Therefore, higher the organic content higher is the carbon content. As the organic content of W3 was highest therefore, the carbon content of W3 is the highest. Due to lower organic content of the sample from LCL, its carbon content is also low.
Individually, carbon content is of no use. It is used to find the C/N ratio of compost which is the most important parameter.
Table 9: Carbon Content
Sample Carbon Content (%) Typical Range
W1 16.88
-
W2 17.27
W3 20.80
LCL 12.33
3.5 Nitrogen Content
The nitrogen contents of different compost samples are shown in Table 10. The nitrogen contents for the compost prepared during this study varied between 1.8% and 1.95% while it was 1.82% for the LCL.
Table 10: Nitrogen Content
Sample Nitrogen Content (%) Typical Range
W1 1.80
-
W2 1.85
W3 1.95
LCL 1.82
Similar to carbon content, nitrogen content alone does not depict anything. Actually, it is used for finding the C/N ratio. The nitrogen content depends upon the amount of nitrogenous materials in the feed stock. As, kitchen waste is nitrogen rich so with the increase in the amount of kitchen waste in the windrows the nitrogen content also went high. Incase of W3 the nitrogen contents are the highest. It was perhaps due to the additional nitrogen added by the sewage, which was used to raise the moisture contents of the compost raw material.
3.6 C/N Ratio
The C/N of different compost samples have been shown in Table 11.
Table 11: C/N Ration of Compost Samples
Sample C/N Ratio Typical Range W1 9. 33 :1
5:1 -3 0 : 1
W2 9.37:1
W3 10.67:1
LCL 6.77:1
Within the limits, the higher is the value of C/N better is the quality of compost. As shown by Table 11, the C/N ratio of the compost prepared from kitchen waste is higher than that prepared from MSW. So the quality of compost prepared from kitchen waste is better. The amount of kitchen waste used for the
production of compost dictate the C/N ratio and ultimately the quality of the compost. As the amount of kitchen waste used in W3 as compared to W1 and W2 is higher so the quality of W3 is better. Therefore, it can be deduced that higher the amount of kitchen waste better is the quality of compost but within certain limits.
At very high quantity of kitchen wastes the nitrogenous materials increase thus the reducing the C/N ratio and causing the release of nitrogen as ammonia. Whereas, at very low quantities of kitchen waste the C/N ratio increases to a very high value which reduces the speed of the decomposition process during composting period [8].
The results show that the waste being composted at LCL contains a large percentage of nitrogenous materials as the C/N ratio is very low. This gives the justification for odours at the windrows in LCL.
3.6 Time for Composting
Another important observation during this research work was the difference in the time of composting of W1, W2 and W3. It was observed that W1 and W2, in which water was used to raise the moisture contents, took 4 months for the production of final compost. On the other hand in W3, in which sewage was used to raise the moisture contents, final compost product was achieved in only 2 months.
LCL prepares its compost within 20 days by the use of compost activators. Sewage serves the same purpose as compost activators but is less efficient.
4. Conclusions
Waste volume reduction around 70% is achieved by the use of composting.
The organic content and C/N ratio of compost prepared from kitchen and garden waste is 44.25% and 10.67:1, respectively. While that prepared from MSW is only 26.24% and 6.77:1, respectively. Thus, the compost prepared from kitchen waste is better in quality than that prepared from MSW.
The quality of compost becomes better with the use of sewage and animal manure.
The time for the completion of composting process including curing period can be reduced from
four months to two months by the use of animal manure and sewage,
All materials required for composting are easily available so, it can be practiced at homes in the backyards with very little cost. The practice of backyard composting has two benefits: (a) It reduces the load on the overall solid waste management system and (b) introduces on site recycling of the waste.
More than 30% of the waste stream of Lahore consists of kitchen waste. This amount of waste can be prevented from entering the SWM system by following kitchen waste composting in backyards.
5. Recommendations
There should be certain arrangement from the City District Local Government to separate the organic waste (food waste) from the municipal waste during the collection phase so that better quality compost is prepared at LCL. This can be achieved by training the localities about the 2 bin and 3 bin systems and then implementing it.
Composting plants can be setup at all the landfill sites in Lahore. These plants can help reduce the load on the landfill sites and thus reduce their impacts on the environment.
An awareness raising campaign regarding the use of compost and its benefits can be initiated so that the amount of waste composted in the backyards increases.
6. References
[1] Sharholy M, Ahmad K, Mahmood G and Trivedi R.C., (2008). “Municipal solid waste management in Indian cities – A review” Waste Management, Vol. 28, Issue 2, 459-467.
[2] Batool S. A and Nawaz M, (2009). “Municipal solid waste management in Lahore City District, Pakistan”, Waste Management, Vol. 29, Issue 6, 1971-1981.
[3] Korea International Cooperation Agency, Korea Environment Institute, Sudokwon Landfill Site Management Corp., July 2007, “Koica-World Bank Joint Study on Solid Waste Management in Punjab, Pakistan”, 79-85.
[4] Ernst Basler + Partner and ICEPAK (2006a), “Improving Solid Waste Management in Punjab, Pakistan: Inception Report, September 27, 2006.” World Bank.
[5] Ernst Basler + Partner and ICEPAK (2006b), “Improving Solid Waste Management in Punjab, Pakistan: Back-to-Office Report Mission #2, Draft November 30, 2006.” World Bank.
[6] Ernst Basler + Partner and ICEPAK (2007. 2), Punjab Solid Waste Management Reform, Second draft report, World Bank.
[7] Ernst Basler + Partner and ICEPAK (2007a), Improving Solid Waste Management in Punjab, Pakistan: Challenges and Needs / Vision and Goals; Abstract of Preliminary Results of Assessment of Present Situation, Jan. 9, 2007. World Bank.
[8] Taylor, R.G. and Allen, A., (2006). “Waste Disposal and Landfill: Information Needs”,
Protecting Groundwater for Health: Managing
the Quality of Drinking-water Sources, Edited
by: O Schmoll, G Howard, J Chilton, I Chorus , IWA Publishing (Intl Water Assoc); 1 edition (November 30, 2006), ISBN# 978-1843390794 [9] Suman, Mor., Ravindra, Khaiwal., Dahiya, R, P.
and Chandra, A., (2006). “Leachate Characterization and Assessment of Groundwater Pollution Near Municipal Solid Waste Landfill Site”, Environmental Monitoring and Assessment ,Vol. 118(1-3), 435-456.
[10] Samanraja, N.S.P. & Bandara, N.J.G.J. (2005). “Ground Water Quality in the Vicinity of Municipal Solid Waste Landfills in the Colombo Metropolitan Region”, Research Comm., SLASS, Anl. Sess., Colombo.
[11] National Engineering Services Pakistan, (2009), “Environmental Impact Assessment (EIA) Kahna Kacha Landfill Site- Final Report”, National Engineering Services Pakistan (Pvt.) Limited (NESPAK).
[12] National Engineering Services Pakistan, (2004), “Environmental Impact Assessment (EIA) Mehmood Booti- Final Report”, National Engineering Services Pakistan (Pvt.) Limited (NESPAK)
[13] George Tchobanogolous, Hilary Theisen and Samuel Vigil, (1993). “Integrated Solid Waste Management: Engineering Principles and Management Issues”, McGraw-Hill, ISBN# 978-0070632370.
[14] http://www.composting101.com/how-it-works. html; 2151hrs, 15/07/2010
[15] http://www.gardenorganic.org.uk/index.php, 1434 hrs 15th June, 2010
[16] Dr. Khurshid Ahmad, (2009). “Techniques in Environmental Sciences and Management, Second Edition”, A-One Publishers.
[17] Dr. Braun, R. and Jaag, O, (1990). Methods of Sampling and Analysis of Solid Wastes, Section for Solid Waste, EAWAG, CH-8600 Dubendoof (Switzerland).
[18] Jackson, M.L, (1979). “Soil Chemical Analysis - Advanced Course - A Manual of Methods Useful for Instruction and Research in Soil Chemistry, Physical Chemistry of Soils, Soil Fertility, and Soil Genesis ( Revised, Second Edition)”, M.L. Jackson; 2nd Edition, 11th Printing edition, ASIN# B003U5PRDW.