RELATIONSHIP BETWEEN SOME CLIMATIC FACTORS
AND SOIL CARBON DIOXIDE
EMISSION
M. A. Youssef Department of Soil and Water Science,
Fac. Agric., Al-Azhar Univ., Assuit,
Egypt.
I. I. Sadek Central Laboratory for Agricultural Climate (CLAC),
Agricultural Research Center, Giza, Egypt.
ABSTRACT
As the atmospheric CO2 concentration continues to increase, more attention is being focused on the soil as a
possible sink for atmospheric CO2. Fertilizer application to soil can play a vital role in influencing the losses of soil
carbon by CO2 emission from the soil. This study was conducted to examine effect of different fertilization types on soil
CO2 emissions. Emission of CO2 from wheat cultivated soil and fertilized with five different types of both organic and
bio fertilizers were measured during seasons of 2011/2012 and 2012/2013, comparing with the emission in case of using chemical fertilizers at experimental farm and laboratory of Soils and Water Sci. Dept., Fac. of Agric., AL-Azhar Univ., Assiut, Egypt. Tested fertilizers were 150 L/fed., compost tea, 20 L/fed., K-Humate, 10 L/fed., EM, 150 L/fed., compost tea + 10 L/fed., EM, 20 L/fed., K-Humate + 10 L/fed., EM and common chemical fertilizers (NPK). Amount of CO2
emission were measured frequently every 30 days after sowing date (30, 60, 90, 120 and 150 days) and total accumulated CO2. Moreover, Soil properties as available nitrogen (AN), soil organic matter (SOM), soil pH content and yield and its
components were determined.
Results indicate that, the highest values of "AN" and "SOM" were recorded with compost tea + EM, while, the lowest values were obtained with chemical treatment. Chemical treatment increased soil pH more than other treatments except K-Humate and K-Humate + EM treatments. The compost tea + EM treatment gave the high reduction value of pH, while, control, K-Humate and K-Humate + EM treatments gave highest values without any significant between them. The greatest values of yield and its components were from applied compost tea + EM treatment. Meanwhile, the lowest values of tested parameters were recorded with added EM treatment. The lowest emission was taken by using compost tea + EM. While, the soil CO2 emission was increased with added K-Humate + EM. In addition, amount of
emission from soil was increased by the time to reach the peak after 120 days from sowing date. Furthermore, indicated that, the average air temperature, minimum air temperature, maximum air temperature and average soil temperature, respectively, had significant exponential relationship regression during the entire measuring period of CO2 emission.
Keyword:
Soil CO2 emissions1.
INTRODUCTION
Carbon emissions related to human activities have been significantly contributing to the elevation of atmospheric (CO2) and temperature. Recently, carbon emissions have greatly accelerated, thus much stronger effects on
crops are expected (DaMatta et al., 2009).
Carbon dioxide (CO2) is an important greenhouse gas accounting for 60% of the total greenhouse effect. Soil is
reducing CO2 emission by isolate C in the soil is prime importance. Soil management practices like increasing soil
organic carbon content, reduced tillage, manuring, residue incorporation, improving soil biodiversity, micro-aggregation and mulching can play an important role in isolate C in soil (Rastogi et al., 2002).
The CO2 emitted from soils is a useful indicator to determine energy flow patterns, specifically the
mineralization of nutrients and the rate of organic material decomposition. The CO2 flow from soils is the result ofplant
roots, organic matter mineralization, microflora, fauna, and to a small extent, by chemical oxidation of carbon-bearing materials.(Curtin et al, 2000; Matteucci et al., 2000; Al-Kaisi and Yin, 2005; Sainju et al., 2008; Muñoz et al., 2010).
The rate of soil CO2 emission is normally controlled by several factors, such as CO2 concentration gradient
between the soil and the atmosphere, soil temperature, soil moisture, pore size, and wind speed. In addition, soil CO2
emission is affected by agricultural practices such as irrigation, tillage, cropping system and N fertilization can alter crop residue C inputs, nutrient dynamics, soil temperature, residue management and varies with climatic conditions (Curtin et al., 2000; Al-Kaisi and Yin, 2005; Sainju et al., 2008). The measurement of soil CO2 emission could provide a more
sensitive indication of soil C sequestration than low-resolution data such as total or organic C values (Fortin et al., 1996; Grant, 1997).
The atmospheric carbon dioxide (CO2) concentration has increased about 85 ppm in the last 100 years (Lal,
2004) and approximately 10% of the CO2 in the atmosphere passes through the soil each year (Wilson and Al-Kaisi;
2008). The emission of CO2 was affected by the phenological stage of the plant while organic fertilizer increased the CO2
emission (Fernández-Luqueño et al., 2009).
Moreover, soil CO2 emission is the main pathway of carbon emission from soil to atmosphere in terrestrial
ecosystems and an important source of atmospheric CO2 (Maljanen et al., 2003; Koponen et al., 2006; Nosalewicz et al.,
2013). Annual global soil respiration is estimated at 68–100 Pg year-1 of C, accounting for almost 10% of the atmospheric CO2 cycles and more than 11 times of the CO2 released from fossil fuel combustion (Marland et al., 2000).
Therefore, knowledge of soil respiration dynamics and its controlling factors in different terrestrial ecosystems is essential to find proper management policies and relevant technologies to decrease soil CO2 emissions and enhance
carbon isolate.
Many studies have proved that organic fertilizer contributes to CO2 emissions after soil application and the
introduction of appropriate manure management techniques represents one opportunity for greenhouse gases mitigation (Bertora et al. 2008; Fernández-Luqueño et al. 2009; Cayuela et al. 2010).
Nitrogen has been regarded as a significant factor controlling soil respiration in N-deficient terrestrial ecosystems. Especially in the next few decades, with increasing rates of anthropogenic N deposition (Mosier et al., 2002) and application of fertilizer, much N is to enter terrestrial ecosystems. This will change soil N status and plant N concentrations (Houghton, 2002). As a result, this will affect plant growth, microbial activities (Compton et al., 2004; Frey et al., 2004), litter decomposition and root respiration (Vose and Ryan, 2002), and thus soil respiration is expected to change. Many studies on the effect of N additions on soil respiration have been conducted (Bowden et al., 2000; 2004; Burton et al., 2004; Micks et al., 2004) as well as agricultural ecosystems (Ding et al., 2007; Al-Kaisi et al., 2008). Since the application of organic fertilizers became rare during the last decade, at present the main source of organic matter for cultivated soils are roots and stubble residues of agricultural plants. The rate of CO2 emission from the
soil is an important indicator of its microbial activity and intensity of organic matter decomposition. As a rule, the measurements of CO2 emission rate are carried out through the growing period under field conditions and at a
temperature above 5°C in the model experiments. It is suggested that CO2 production and emission are very poor at low
temperatures, and total CO2 emission is negligible beyond the growing season (Lopes de Gerenyu et al., 2005).
It is well known that CO2 production, transport and emission in soil depend on environmental factors such as
aeration condition, soil temperature, soil moisture, supplies of organic carbon, fertilization, pH, etc. (Weitz et al. 2001; Bowden et al. 2004; Lin et al. 2010).
Temperature (soil or air) is the best predictor of the annual and seasonal dynamics of CO2 evolution rate of soils
2000). A high positive correlation between CO2 emission rate and soil temperature was found for many soils under
natural and agricultural conditions (Raich et al., 2002; Lopes de Gerenyu et al., 2005). In addition, a positive correlation between soil temperature and soil CO2 efflux is well described by several reviews.
Concerning effects of air temperature, results of mathematical modeling suggest that, in mid- to high-latitude regions, moderate to medium local increases in temperature (1–3°C), along with associated CO2 increase and rainfall
changes, can have beneficial impacts on crop yields, but in low-latitude regions even moderate temperature increases (1– 2 °C) are likely to have negative impacts on yield of major cereals (Easterling et al., 2007).
The aims of the present study were first to quantify the seasonal fluxes of CO2 from cultivated wheat with using
different types of fertilizers. Second is to determine the impact of soil and air temperature on CO2 evolution rate from the
soil.
2.
MATERIALS AND METHODS
Site and treatment description:
The present investigation was carried out on the experimental farm and laboratory of Soils and Water Sci. Dept., Fac. of Agric., AL-Azhar Univ., Assiut, Egypt, during two successive winter seasons of 2011/2012 and 2012/2013. The aim of conducted field experiment to study the effect of organic sources of nutrients use (Compost tea and K-Humate), and EM "Effective Microorganisms" bio-fertilization on soil CO2 emissions as well as improving chemical and biological
activity properties through 5 periods (30, 60, 90, 120 and 150 days from sowing date) and total accumulated CO2. The
experiment was designed as randomized completed blocks design with three replicates. Experimental treatments included six treatments as are presented as follow:-
1. NPK (Control). 2. 150 L/fed. Compost tea. 3. 20 L/fed. K-Humate. 4. 10 L/fed. EM.
5. 150 L/fed. Compost tea + 10 L/fed EM. 6. 20 L/fed. K-Humate + 10 L/fed EM.
Experimental plots area was 3 × 3.5 m = 10.5 m2 (1/400 fed.). Physical and chemical properties of the experimental soil sample collected before planting wheat seeds were presented in Table (1):
Table 1: Soil physical and chemical properties of the soil.
Particle-Size distribution Texture
grade Saturation capacity (%) Field capacity (%) Wilting point (%) Bulk density (g/cm3)
Particle density (g/cm3) Sand % Silt % Clay %
Season 2011/12
55.20 29.60 15.20 Silt loam 51.50 25.75 12.87 1.49 2.54
Season 2012/13
57.68 27.31 15.01 Silt loam 52.32 26.16 13.08 1.50 2.57
C.E.C (cmolc kg
-1 ) CaCO3 (%) O.M (%) ECe (dSm-1)
pH soil past Total-N (%) Ava-N (mg/kg) Ava-P (mg/kg) Ava-K (mg/kg) Season 2011/12
13.90 1.29 1.59 1.43 7.12 0.18 62.72 11.57 169.41
Season 2012/13
Sources of nutrients:
1. NPK: mineral fertilizer as ammonium nitrate, calcium super phosphate and potassium sulphate as they are commonly used for growing wheat plants and recommended by Ministry of Agriculture were applied to be the control treatment.
2. K-Humate: Potassium humate was extracted and using the classic alkali/acid fractionation procedure and analysis conducted according to standard methods (Valdrighi et al., 1996).
3. Compost tea: Technical approaches to making are aerobic compost tea was procedure (Ingham, 2005), Chemical analysis of the compost tea and soil was conducted according to Page et al. (1982).
4. EM (Effective microorganisms): Technology of nature farming was introduced by Japanese scientists (Higa, 1989) was provided from the ministry of Agriculture.
The total amounts of K-Humate, compost tea, EM, K-Humate + EM and compost tea + EM add to soil during irrigation in equal three doses.
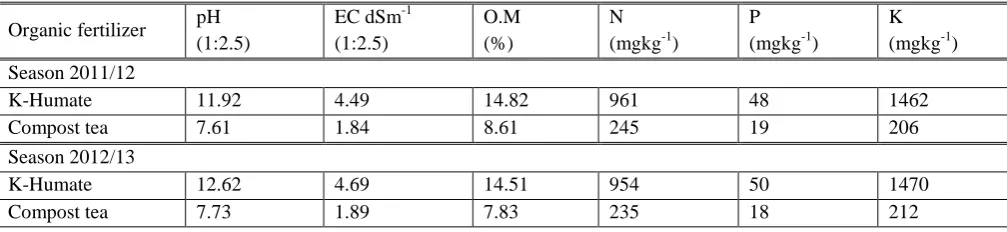
Table 2: Chemical analyses of organic fertilizers applied.
Organic fertilizer pH (1:2.5)
EC dSm-1 (1:2.5)
O.M (%)
N (mgkg-1)
P (mgkg-1)
K (mgkg-1) Season 2011/12
K-Humate 11.92 4.49 14.82 961 48 1462
Compost tea 7.61 1.84 8.61 245 19 206
Season 2012/13
K-Humate 12.62 4.69 14.51 954 50 1470
Compost tea 7.73 1.89 7.83 235 18 212
Cultivation and sampling:
Wheat seeds (Triticum aestivum vulgar., CV. Sids 1) at rate of 51 kg/fed. were sown on December 1st under the surface irrigation method and harvested after 160 days from planting in the two seasons. Plant samples of one m2 from each plot were harvested and ten plants were taken randomly to determine yield attributes (straw, grain and biological yield). Nitrogen was determined in wheat grain by the distillation in a Macro-Kjeldahle apparatus (Black, 1983) and protein content in wheat grains was determined according to (A. O. A. C., 2000).
Climatic data:
Climatic factors considered in this study were: maximum, minimum, average air temperature (°C) and soil temperature (°C). All climatic factors were measured and recorded by automatic weather station (Latitude 27.5 oN, Longitude 31.1oE and Altitude 71 m), Campbell scientific, Inc, Central Laboratory for Agricultural Climate (CLAC). Soil sampling:
Surface soil samples (0-30 cm) were collected after wheat harvest to determine the available nitrogen "AN", soil organic matter content "SOM" and soil pH.
Soil CO2 emission measurements:
Twenty five cm2plastic boxeswere placed in each experimental plot with a Kilter glass bottle containing 100 ml of 1.0 normal sodium hydroxide placed in the middle of the plastic boxes to trap the evolved CO2 (samples were taken at
60% soil moisture). The plastic boxes were sealed (air-tight) during all periods.
The glass bottles with 1.0 N sodium hydroxyl (NaOH) were retrieved daily at end period (30 days). At each retrieval time, the plastic boxes were left open up to half hour to prevent the development of anaerobic condition. The amount of CO2-C trapped was determined by back titration according to Page et al. (1982).
The net CO2-C was calculated by subtracting the value of the blank from that of the treatments, using the
relationship of Anderson (2001). CO2 = (B -V) NE
B = Volume of HCl used to neutralize NaOH in the beaker to the end point of the blank. V = Volume of acid used to neutralize NaOH in the beaker to the end point.
N = Normality of the acid.
E = Equivalent weight (to express data as C, E=6, while as CO = E= 22).
By the end of experiment, soil sample from each treatment was collected, air-dried, sieved through 2 mm sieve then kept for some chemical properties determination.
Statistical analysis:
Statistical analysis was performed by using the SAS system (SAS, 2005). Duncan’s multiple range tests was used for means separation. Significance was assessed at P < 0. 05.
3.
RESULTS AND DISCUSSION
Climatic condition:
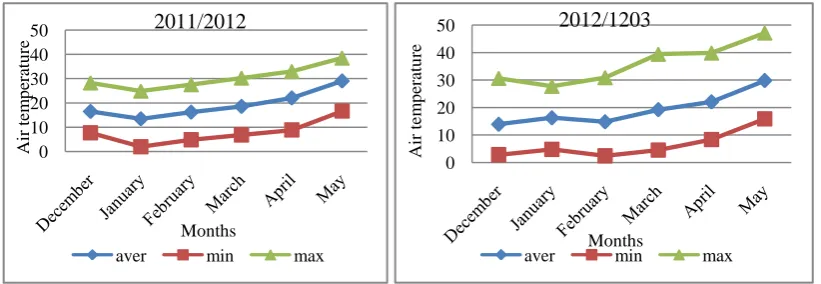
The air and soil temperature in the experimental site was shown in Figures (1 and 2). The mean monthly air temperature ranged from 13.45°C to 29.07°C and from 13. 93°C to 29.81°C, when soil temperature recorded from 14.03°C to 31.07°C and from 15.01°C to 32.03°C during the 2011/2012 and 2012/2013 wheat growing seasons, respectively. The mean monthly maximum air and soil temperatures during wheat growing season in 2011/2012 were slightly lower than that in 2012/2013. While, minimum air temperature in season 2011/2012 was slightly higher than that in 2012/2013, at all months except months of January. Moreover, soil minimum temperature was slightly higher at March, April and May in season 2012/2013 compare with season 2011/2012.
Figure 1: Average air temperature during two growing wheat seasons. 0 10 20 30 40 50 Air tem p era tu re Months
2011/2012
aver min max
0 10 20 30 40 50 Air tem p era tu re Months
2012/1203
aver min max
0 10 20 30 40 S o il tem p era tu re Months
2011/2012
aver min max
0 10 20 30 40 50 S o il tem p era tu re Months
2012/2013
Figure 2: Average soil temperature during two growing wheat seasons.
Soil properties:
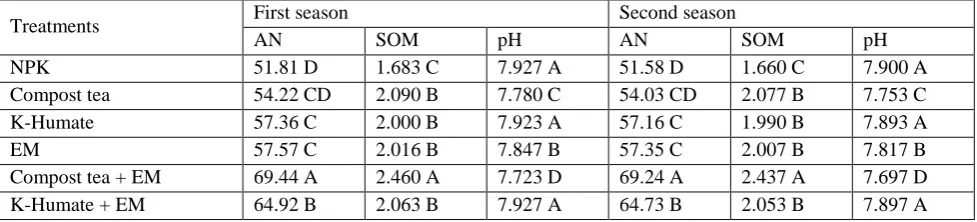
The soil properties (available nitrogen "AN", soil organic matter "SOM" and soil pH) were influenced significantly by different types of fertilizer. Generally, organic fertilizer and bio-fertilizer treatments enhanced "AN" and "SOM", while, reduced soil pH compared with chemical treatment.
Illustrated data in (Table. 3) obtained that the highest values of "AN" and "SOM" were recorded with Compost tea + EM treatment, when, the lowest values with chemical treatment. In addition, data in (Table. 3) reflected that the chemical treatment increased soil pH more than other treatments, except K-Humate and K-Humate + EM treatments. The Compost tea + EM treatment gave the high reduction value of soil pH, while, control, K-Humate and K-Humate + EM treatments gave highest values without any significant value between them. Those results were recorded during two growing seasons.
The result is supported by Ullah et al., 2008 who reported that the organic matter content and availability of N in soil has been increased by organic fertilizer application. On the other hand, soil pH was increased with chemical application than organic application. Yadav et al., 2002 and wells et al., 2000, mentioned that the chemical properties of soil were influenced by different sources of soil nutrients (organic and chemical). Soil pH varied significantly with the treatments, it decreased with organic manures application and application of chemical + organic but increased with only chemical fertilizer application. Moreover, soil organic matter was decreased by chemical fertilizer application, but was increased with all types of organic manure application and that was recorded the highest with combined application. Whereas, Bouajila and Sanaa, 2011 reported that, add of compost or manure acted significantly on soil characteristics, especially the fertility and its productive capacity. Moreover, authors reported that improve soil organic level, resulting in a higher organic carbon content which contributes to diminish climatic heating.
Also, Constantin et al., 2010 found a positive relationship between C and N inputs via cover crop biomass and soil C and N contents on three different soil types. Field experiments showed that plots with annual inputs of animal manure hold more soil C and N than plots receiving mineral fertilizers only (Christensen and Johnston, 1997). Hence, there are cumulative effects of cropping systems with abundant organic inputs on soil total N contents that could influence levels of plant-available N and thus yields of cereal crops. In contrast, residual effects of N added with mineral fertilizers are negligible (Petersen et al., 2010). The result might be due to improvement of other physical and chemical properties for organic manure application compared to the chemical fertilizer application.
Table (3): Effect of different types of fertilization on soil properties available nitrogen, soil organic matter and soil pH during 2011/2012 and 2012/2013seasons.
Treatments First season Second season
AN SOM pH AN SOM pH
NPK 51.81 D 1.683 C 7.927 A 51.58 D 1.660 C 7.900 A
Compost tea 54.22 CD 2.090 B 7.780 C 54.03 CD 2.077 B 7.753 C
K-Humate 57.36 C 2.000 B 7.923 A 57.16 C 1.990 B 7.893 A
EM 57.57 C 2.016 B 7.847 B 57.35 C 2.007 B 7.817 B
Compost tea + EM 69.44 A 2.460 A 7.723 D 69.24 A 2.437 A 7.697 D
K-Humate + EM 64.92 B 2.063 B 7.927 A 64.73 B 2.053 B 7.897 A
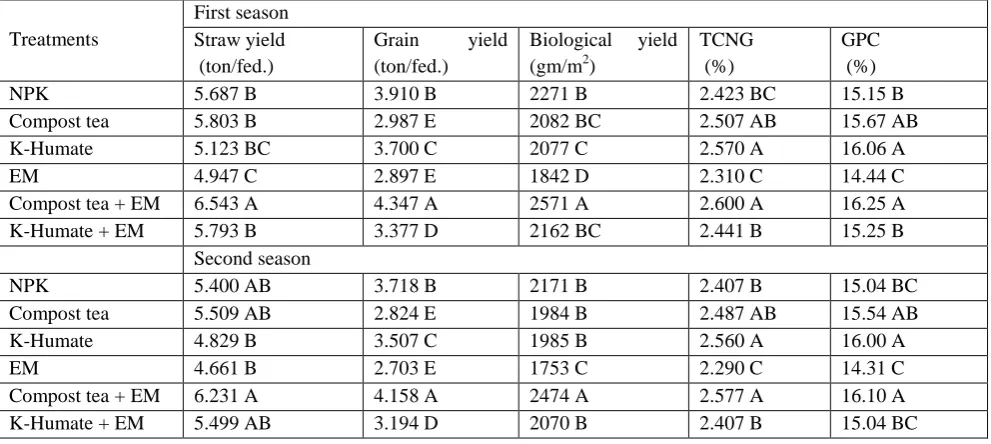
Yield and yield components:
2012/2013 seasons. These results are in a harmony with those reported by (Atta Allah and Mohamed, 2003; Sarwar, 2005; Yassen et al., 2006; Javaid and Shah, 2010; Youssef, 2011).
Such satisfactory result might be due to the prevailing bio-fertilizer supplemented organic fertilizer improved soil properties, especially organic matter and N content. The application of bio-fertilizer in combination with organic or mineral fertilizers increased the efficiency of both organic and mineral N fertilizer, but apply the bio-fertilizer alone was ineffective in increasing yield. Thus, bio-fertilizers could be used as value-added soil amendments by supplementing organic and low chemical fertilizer rates for improving soil fertility and sustaining crop productivity (Abbasia and Yousra, 2012). Also, other authors mentioned the same results bio-fertilizer is enhancing soil biological activity, which improved nutrient mobilization from organic and chemical sources. Also, the bio-fertilizer plays a significant role in regulating the dynamics of organic matter decomposition and the availability of plant nutrients and increasing nitrogen fixer. In this case, Elsayed et al., 2005; El-Garhi et al., 2007; Badr et al., 2009; Bahrani et al., 2010; Abd El-Lattief, 2012 found positive effect on yield and yield attributes of wheat when inoculated with bio-fertilizer. Controlled field trials in Iran, Khavazi et al., 2005, found that yield improvements of more than 20% have been observed for wheat as a result of application of bio-fertilizer inoculums.
Table (4): Effect of different types of fertilization on yield (straw, grain and biological yield) and its components (total content of nitrogen in grain and grain protein content) during 2011/2012 and 2012/2013seasons.
Treatments
First season Straw yield (ton/fed.)
Grain yield (ton/fed.)
Biological yield (gm/m2)
TCNG (%)
GPC (%)
NPK 5.687 B 3.910 B 2271 B 2.423 BC 15.15 B
Compost tea 5.803 B 2.987 E 2082 BC 2.507 AB 15.67 AB
K-Humate 5.123 BC 3.700 C 2077 C 2.570 A 16.06 A
EM 4.947 C 2.897 E 1842 D 2.310 C 14.44 C
Compost tea + EM 6.543 A 4.347 A 2571 A 2.600 A 16.25 A
K-Humate + EM 5.793 B 3.377 D 2162 BC 2.441 B 15.25 B
Second season
NPK 5.400 AB 3.718 B 2171 B 2.407 B 15.04 BC
Compost tea 5.509 AB 2.824 E 1984 B 2.487 AB 15.54 AB
K-Humate 4.829 B 3.507 C 1985 B 2.560 A 16.00 A
EM 4.661 B 2.703 E 1753 C 2.290 C 14.31 C
Compost tea + EM 6.231 A 4.158 A 2474 A 2.577 A 16.10 A
K-Humate + EM 5.499 AB 3.194 D 2070 B 2.407 B 15.04 BC
Soil CO
2emission:
Soil CO2 flux was fitted with applied organic and bio-fertilizations treatment. The results indicated that soil CO2
emission was reduced with application of compost tea + EM treatment through determined period (60, 90, 120 and 150 days from sowing date), while, lowest emission after 30 days from sowing date was observed in the chemical treatment. While, the soil CO2 emission was increased with added K-Humate + EM treatment at measurements period from 60 to
150 days from sowing date and with compost tea treatment after 30 days from sowing date (Table. 5). This results are recorded in both growing season 2011/2012 and 2012/2013. These results may be due to the influence of compost tea plus EM treatment on the soil properties (available nitrogen, soil organic matter and pH), Table (3), which lead to increase the "AN" and "SOM"and reduced soil pH. Some authors obtained that the application of farmyard manure induced a rapid increase in CO2 emissions from the soil than CO2 emissions from the soil that fertilized with mineral N
(Jäger et al., 2011).
Increasing N fertilizer application decreased soil CO2 emissions (Wilson and Al-Kaisi, 2008). Kowalenko et al.
CO2 emissions have also been studied (Micks et al., 2004; Bowden et al., 2004; Burton et al., 2004). These studies
reported results similar to Kowalenko et al., 1978 and Fogg (1988). The reason for the depression of soil CO2 emissions
due to N fertilization is relatively unclear. Previous studies have suggested that the depression occurred because increased N reduced enzymatic activity (Bowden et al., 2004; Burton et al., 2004), decreased pH (Aerts and de Caluwe, 1999), or decreased microbial biomass (Soderstrom et al., 1983).
Furthermore, several studies described a similar positive correlation of soil pH-value and soil CO2 efflux
(Andersson and Nilsson, 2001). Högberg et al. (2003) demonstrated the direct positive effect on soil emission with soil pH tolerance of the bacterial community. A biological activity of soil microorganisms is permitted between a soil pH of a minimum of 3 and a maximum of {7 to 8} (Scheffer and Schachtschabel, 2002). In addition, inside the mentioned values and otherwise constant conditions observed a nearly linear increase of soil CO2 emission. Variation of the soil pH-value
of the soil and between the single measurement points at each site showed a positive correlation with the CO2 efflux.
During simultaneous measurements with higher soil pH exhibited higher CO2 fluxes (Reth et al., 2005).
Meanwhile, soil CO2 efflux influenced by other factors like, the root respiration (Kutsch et al., 2001) and
comprises total soil CO2 efflux, and plants continuously excrete exudates into the soil. On other hand, due to application
of bio-fertilizers the soil pH (KCl solution) raised CO2 emission(Durinina et al, 2001; Kutyova et al., 2002).
Table (5): Effect of different types of fertilizers application on soil CO2 emission (CO2–C Kg/fed) during 2011/2012 and
2012/2013seasons.
Treatments First season
30 60 90 120 150 Accumulative
NPK 1.233 B 1.856 A 1.856 CD 2.002 AB 1.941 C 8.890 C
Compost tea 1.747 A 1.914 A 1.910 ABC 1.944 B 1.897 D 9.412 B
K-Humate 1.344 B 1.871 A 1.865 BCD 1.940 B 1.935 C 8.956 C
EM 1.655 A 1.900 A 1.915 AB 2.057 A 2.017 B 9.544 AB
Compost tea + EM 1.573 A 1.768 B 1.830 D 1.936 B 1.885 D 8.992 C
K-Humate + EM 1.714 A 1.934 A 1.932 A 2.073 A 2.043 A 9.694 A
Second season
NPK 1.239 C 1.868 AB 1.884 BC 2.016 AB 1.957 C 8.965 C
Compost tea 1.756 A 1.924 A 1.939 AB 1.955 B 1.910 D 9.483 B
K-Humate 1.353 BC 1.880 A 1.893 BC 1.951 B 1.947 C 9.024 C
EM 1.663 A 1.909 A 1.943 AB 2.069 A 2.030 B 9.615 AB
Compost tea + EM 1.580 AB 1.779 B 1.857 C 1.949 B 1.900 D 9.065 C
K-Humate + EM 1.727 A 1.953 A 1.959 A 2.084 A 2.054 A 9.777 A
Total accumulative CO
2emission from soil:
Data in Table (5) noted that applied K-Humate + EM treatment gave the highest values of total accumulative soil CO2 emission. While, the lowest values of total accumulative soil CO2 emission were recorded with application of
NPK, K-Humate and compost tea + EM treatments, respectively, without any significant differences between both treatments. In addition, obtained results from regression analyses confirmed that no significant effect on total accumulative CO2 emission on wheat yield and yield components. These results are confirmed in both growing seasons
2011/2012 and 2012/2013.
Time effect on Co
2emission measurements:
The amount of carbon dioxide emission from soil was different on particular period of measurements. The lowest rate of CO2 emission evolution was observed on 30 days after sowing date. With the passage of time carbon
without any significant differences between them (Table. 6). The mentioned trend was not harmony with (Włodarczyk, 2000; Rogalski et al., 2008), whom reported that CO2 emission decreased substantially after one day.
Table (6): time effect on soil Co2 emission (CO2 –C Kg/fed.) during 2011/2012 and 2012/2013 seasons.
Time 30 60 90 120 150
First season 1.543 C 1.874 B 1.884 B 1.952 A 1.952 A
Second season 1.553 C 1.886 B 1.912 B 2.004 A 1.967 A
Relationships between soil CO
2emission and air or soil temperature:
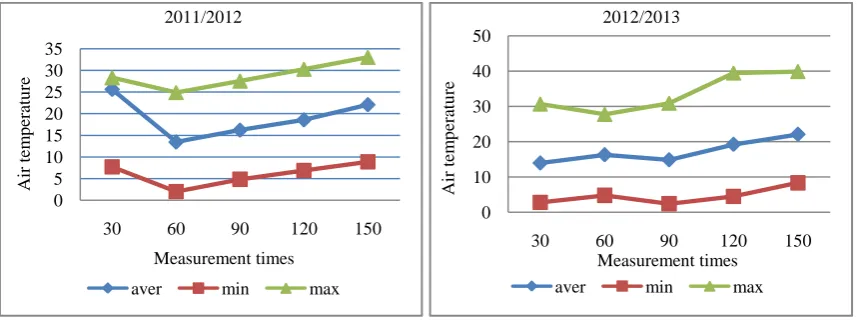
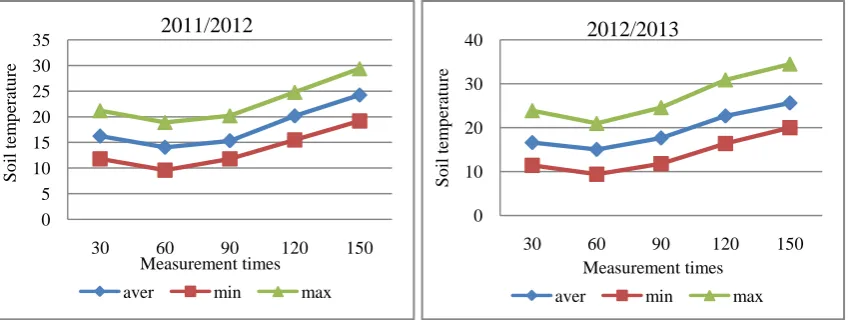
According to stepwise regression procedure indicated that, the average air temperature, minimum air temperature, maximum air temperature and average soil temperature, respectively, had significant exponential relationship regression during the entire measuring period of CO2 emission. While maximum and minimum soil
temperatures were not obtained any significant regression with CO2 respiration in both growing seasons (Figures 3 and
4). On other hand, average soil temperature through period of CO2 emission varied from 14.03 to 24.23°C and 16.58 to
25.6°C, respectively in 2011/2102 and 2012/2013. The relatively higher average soil temperature appeared in the months of growing season from February to April than other months. In months from December to April, soil temperature was always above 10°C in both seasons.
Similar trend was observed with minimum air temperature arranged between 2 to 8.87°C and 2.43 to 8.35°C, respectively in 2011/2102 and 2012/2013, and started for increasing from February to April months in first season and March to April months in second season. Minimum air temperature decreased was relatively low 10°C through all CO2
emission months in two seasons.
Maximum air temperature recorded from 24.9 to 33.02°C and 27.76 to 39.87°C, respectively in 2011/2102 and 2012/2013. Maximum air temperature started rising from February to April in two growing seasons. Maximum air temperature increased above 30°C through all CO2 emission months except December to February months in first season
and January month in second season.
Average air temperature was ranged from 13.45 to 22.07°C and 13.93 to 22.07°C, in 2011/2102 and 2012/2013. Increasing average air temperature was started from February to April months. Average air temperature was always above 10°C through both seasons.
Our results showed that CO2 flux was equally related with both air temperature (average, minimum and
maximum) and average soil temperature at the time of CO2 flux measurement.
Figure 3: Average air temperature through measurements period of CO2 during two growing wheat seasons.
0 5 10 15 20 25 30 35
30 60 90 120 150
Air
tem
p
era
tu
re
Measurement times 2011/2012
aver min max
0 10 20 30 40 50
30 60 90 120 150
Air
tem
p
era
tu
re
Measurement times 2012/2013
Figure 4: Average soil temperature through measurements period of CO2 during two growing wheat seasons.
This could be attributed to the air temperature (average, minimum and maximum) were more correlated with CO2 flux than soil temperature (maximum and minimum) (Parkin and Kaspar, 2003), air temperature influence soil
temperature, which in turn, directly influence CO2 flux from the soil surface (Bajracharya et al., 2000a, b; Curtin et al.,
2000; Parkin and Kaspar, 2003). Parkin and Kaspar (2003) reported that CO2 flux was better related with air temperature
than with soil temperature because of plant residue at the soil surface. CO2 flux was equally related with both soil
temperature and daily average air temperature at the time of CO2 flux measurement. The CO2 flux was linearly related
with soil temperature and daily average air temperature at the time of CO2 measurement (Sainju et al., 2008). Moreover,
Soil warming can enhance the soil microbial activities and root growth sharply (Zheng et al., 2009). This leads to an active decomposition of soil organic C and enhancement of plant-derived CO2 release from root respiration (Fang et al.,
2009).
Prediction of soil CO
2emission:
Furthermore, the most effective climatic factors could be used to predict amount of soil CO2 emission (R2 =
0.629, P <.0001) was selected (Average air temperature (TAV), minimum air temperature (TAMin), maximum air
temperature (TAMax) and average soil temperature (TSV), respectively). Prediction equation for CO2 emission from soil was
concluded according to the mentioned statistical analysis and presented as follow: Y= 0.713 + 0.26 TAV + 0.23 TAMin – 0.1 TAMax + 0.06 TSV
Where is: Y= soil CO2 emission.
4.
CONCLUSION
This study demonstrated how different types of fertilization affected on soil CO2 emission (CO2–C Kg/fed) from
cultivated wheat yield. Statistical analysis showed that the soil properties were effect by the type of fertilizer. The "AN" and "SOM" represented the positive response for organic and bio-fertilizer compared with chemical fertilizer. In the same time, soil pH increased by applied chemical treatment more than other treatments except K-Humate and K-Humate + EM treatments. Moreover, the greatest values of yield (straw, grain yield, biological yield) and its components (total content of nitrogen in grain "TCNG" and grain protein content "GPC") were observed when applied compost tea + EM treatment. Meanwhile, the lowest values of tested parameters were recorded with added EM treatment. Soil CO2 emission was
reduced with compost tea + EM treatment through determents period (60, 90, 120 and 150 days from sowing date), when, lowest emission after 30 days from sowing was observed in the chemical treatment. While, the soil CO2 respiration
was increased with added K-Humate + EM treatment at measurements period from 60 to 150 days after sowing date and with compost tea treatment after 30 days after sowing date. In addition, the lowest rate of CO2 evolution was observed on
30 days after sowing date. With the passage of time carbon dioxide emission increased, the highest rate of CO2 was
0 5 10 15 20 25 30 35
30 60 90 120 150
S
o
il
tem
p
era
tu
re
Measurement times
2011/2012
aver min max
0 10 20 30 40
30 60 90 120 150
S
o
il
tem
p
era
tu
re
Measurement times
2012/2013
recorded after 120 days from sowing date. The climatic factors as well as (average air temperature, minimum air temperature, maximum air temperature and average soil temperature) had significant exponential relationship regression during the entire measuring period of CO2 emission. This statistical regression method can be used to predict soil CO2
emission where soil CO2 respiration is primarily dependent on climatic factors.
5.
REFERENCES
[1] Abbasia, M. K. and M. Yousra. 2012. Synergistic effects of biofertilizer with organic and chemical N sources in improving soil nutrient status and increasing growth and yield of wheat grown under greenhouse conditions. Plant Biosystems. 146(1): 181-189.
[2] Abd El-Lattief, E. A. 2012. Improving bread wheat productivity and reduce use of mineral nitrogen by inoculation with Azotobacter and Azospirillum under arid environment in Upper Egypt. International Conference on Applied Life Sciences (ICALS2012). 393-398.
[3] Aerts, R. and H. de Caluwe.1999. Nitrogen deposition effects on carbon dioxide and methane emissions from temperate peatland soils. Oikos 84-1: 44–54.
[4] Al-Kaisi, M. M. and X. Yin. 2005. Tillage and crop residue effects on soil carbon and CO2 emission in corn–
soybean rotations. J. Environ. Qual. 34: 437–445.
[5] Al-Kaisi, M. M., M. L. Kruse and J. E. Sawyer. 2008. Effect of nitrogen fertilizer application on growing season carbon dioxide emission in a corn-soybean rotation. J. Environ. Qual. 37: 325–332.
[6] Andersson, S and S. I. Nilsson. 2001. Influence of pH and temperature on microbial activity, substrate availability of soil-solution bacteria and leaching of dissolved organic carbon in a mor humus. Soil Biol. Biochem. 33: 1181–1191.
[7] A.O.A.C. 2000. Association of official agricultural chemists, official and tentative methods of analysis, 11th ed. Washington, D.C., USA.
[8] Atta Allah, S. A. and G. A. Mohamed. 2003. Response of wheat grown in newly reclaimed sandy soil to poultry manure and nitrogen fertilization. J. Agric. Sci., Mansoura Univ. 28: 7531-7538.
[9] Badr, E. A., O. M. Ibrahim and M. F. El-Kramany. 2009. Interaction effect of biological and organic fertilizers on yield and yield components of two wheat cultivars. Egypt. J. Agron. 31(1): 17-27.
[10]Bahrani, A., J. Pourreza and M. Hagh Joo. 2010. Response of winter wheat to co-inoculation with Azotobacter and Arbescular Mycorrhizal fungi (AMF) under different sources of nitrogen fertilizer. American-Eurasian J. Agric. and Environ. Sci. 8(1): 95-103.
[11]Bajracharya, R. M., R. Lal and J. M. Kimble. 2000a. Erosion effects on carbon dioxide concentration and carbon flux from an Ohio alfisol. Soil Sci. Soc. Am. J. 64: 694-700.
[12]Bajracharya, R. M., R. Lal and J. M. Kimble. 2000b. Diurnal and seasonal CO2-C flux from soil as related to
erosion phases in central Ohio. Soil Sci. Soc. Am. J. 64: 286-293.
[13]Bertora, C., F. Alluvione, L. Zavattaro, J. W. Van Groenigen, G. Velthof and C. Grignani. 2008. Pig slurry treatment modifies slurry composition, N2O, and CO2 emissions after soil incorporation. Soil Biol. Biochem. 40:
[14]Black, C. A. 1983. Methods of soil Analysis. Parts 1 and 2. Amer. Soc. Agron. Jnc. Publ., Madison, Wisc., USA.
[15]Bouajila, K. and M. Sanaa. 2011. Effects of organic amendments on soil physico-chemical and biological properties. J. Mater. Environ. Sci. 2: 485-490.
[16]Bowden, R. D., G. Rullo and G. R. Stevens. 2000. Soil fluxes of carbon dioxide, nitrous oxide, and methane at a productive temperate deciduous forest. J. Environ. Qual. 29: 268–276.
[17]Bowden, R. D., E. Davidson, K. Savage, C. Arabia and P. Steudler. 2004. Chronic nitrogen additions reduce total soil respiration and microbial respiration in temperate forest soils at the Harvard Forest. For. Ecol. Manage. 196: 43–56.
[18]Burton, A. J., K. S. Pregitzer, J. N. Crawford, G. P. Zogg and D. R. Zak. 2004. Simulated chronic NO3
-deposition reduces soil respiration in Northern hardwood forests. Glob. Ch. Biol. 10: 1080–1091.
[19]Cayuela, M. L., O. Oenema, P. J. Kuikman, R. R. Bakker and J. W. van Groenigen. 2010. Bioenergy by-products as soil amendments? Implications for carbon sequestration and greenhouse gas emissions. GCB Bioenergy. 2: 201–213.
[20]Christensen, B. T. and A. E. Johnston. 1997. Soil organic matter and soil quality – lessons learned from long-term experiments at Askov and Rothamsted. Dev. Soil Sci. 25: 399–430.
[21]Compton, J. E., L. S. Watrud and L. A. Porteous. 2004. Response of soil microbial biomass and community composition to chronic nitrogen additions at Harvard Forest. For. Ecol. Manage. 196: 143–158.
[22]Constantin, J., B. Mary, F. Laurent, G. Aubrion, A. Fontaine, P. Kerveillant and N. Beaudoin. 2010. Effects of catch crops, no till and reduced nitrogen fertilization on nitrogen leaching and balance in three long-term experiments. Agric. Ecosyst. Environ. 135: 268–278.
[23]Curtin, D., H. Wang, F. Selles, B. G. McConkey and C. A. Campbell. 2000. Tillage effects on carbon fluxes in continuous wheat and fallow-wheat rotations. Soil Sci. Soc. Am. J. 64: 2080-2086.
[24]Durinina, E. P., E. C. Komarovskaya, T. U. Kuteva and I. A. Arhipchenko. 2001. Effect caused by biofertilizer Bamil on P tranforamtion in Podzol soil and crop productivity. Agrochemistry. 11: 43-48.
[25]DaMatta, F. M., A. Grandis, B. C. Arenque and M. S. Buckeridge. 2009. Impacts of climate changes on crop physiology and food quality. Food Research International. 43: 1814–1823.
[26]Ding, W., Y. Cai, Z. Cai, K. Yagi and X. Zheng. 2007. Soil respiration under maize crops: effects of water, temperature, and nitrogen fertilization. Soil Sci. Soc. Am. J. 71: 944-951.
[27]Easterling, W. E., P. K. Aggarwal, P. Batima, L. M. Brander, L. Erda and S. M. Howden. 2007. Food, fiber and forest products. In M. L. Parry, O. F. Canziani, J. P. Palutikof, P. J. van der Linden, and C. E. Hanson (eds.), Climate change: Impacts, adaptation and vulnerability. Contribution of Working Group II to the fourth assessment report of the intergovernmental panel on climate change (pp. 273–313). Cambridge: Cambridge University Press.
[29]El-Sayed, M. Z., A. E. Abd El-Sattar, H. A. Basha and I. M. Abd El-Hammeed. 2005. Improvement of wheat productivity in newly reclaimed soil in Egypt. Annals UMCS, Sec. E.60: 113-121.
[30]Fang, H. J., G. R. Yu, S. L. Cheng, T. H. Zhu, Y. S. Wang, J. H. Yan, M. Wang, M. Cao and M. Zhou. 2009. Effects of multiple environmental factors on CO2 emission and CH4 uptake from old-growth forest soils.
Biogeosciences. 6: 1–13.
[31]Fernández-Luqueño, F., V. Reyes-Varela, C. Martínez-Suárez, R. E. Reynoso-Keller, J. Méndez-Bautista, E. Ruiz-Romero, F. López-Valdez, M. L. Luna-Guido and L. Dendooven. 2009. Emission of CO2 and N2O from
soil cultivated with common bean (Phaseolus vulgaris L.) fertilized with different N sources. Science of the Total Environment. 407: 4289–4296.
[32]Fogg, K. 1988. The effect of added nitrogen on the rate of organic matter decomposition. Biol. Rev. 63: 433– 472.
[33]Fortin, M. C., P. Rochette and E. Pattey. 1996. Soil carbon dioxide fluxes from conventional and no-tillage small-grain cropping systems. Soil Sci. Soc. Am. J. 60: 1541–1547.
[34]Frey, S. D., M. Knorr and J. Parrent. 2004. Chronic nitrogen enrichment affects the structure and function of the soil microbial community in a forest ecosystem. For. Ecol. Manage. 196: 159–171.
[35]Grant, R. F. 1997. Changes in soil organic matter under different tillage and rotation: Mathematical modeling in ecosys. Soil Sci. Soc. Am. J. 61: 1159–1175.
[36]Higa, T. 1989. Studies on application of microorganisms in nature farming. II: The practical application of effective microorganisms (EM). In: Proceedings of 7th IFOAM Conference ,Ouagadougou, Burkina Faso, West Africa.
[37]Högberg, M. N., E. Bååth, A. Nordgren, K. Arnebrant and P. Högberg. 2003. Contrasting effects of nitrogen availability on plant carbon supply to mycorrhizal fungi and saprotrophs – A hypothesis based on field observations in boreal forest. New Phytol. 160: 225–238.
[38]Houghton, R. A. 2002. Terrestrial carbon sinks-uncertain explanations. Biologist. 49: 155–160.
[39]Ingham, E. 2005. The compost tea brewing manual. US Printings, Soil Foodweb Incorporated, Oregon.
[40]Jäger, N., C. F. Stange, B. Ludwig and H. Flessa. 2011. Emission rates of N2O and CO2 from soils with different
organic matter content from three long-term fertilization experiments—a laboratory study. Biol. Fertil. Soils. 47: 483–494.
[41]Javaid, A. and M. B. M. Shah. 2010. Growth and yield response of wheat to EM (effective microorganisms) and parthenium green manure. Afr. J. Biotechnol. 9: 3373-3381.
[42]Khavazi, K., H. Asadi-Rahmani and M. J. Malakouti. 2005. Necessity for the production of biofertilizers in Iran (eds.). Ministry of Jihad-e- Agriculture, Agricultural Research and Education Organization (AREO) and Soil and Water Research Institute (SWRI), Tehran, Iran, pp: 419.
[44]Koponen, H. T., C. E. Duran, M. Maljanen, J. Hytonen and P. J. Martikainen. 2006. Temperature responses of NO and N2O emissions from boreal organic soil. Soil Biology and Biochemistry. 38: 1779-1787.
[45]Kowalenko, C. G., K. S. Ivarson and D. R. Cameron. 1978. Effect of moisture content, temperature and nitrogen fertilization on carbon dioxide evolution from field soils. Soil Biology and Biochemistry. 10: 417–423.
[46]Kutsch, W. L., A. Staack, J. Wotzel, U. Middelhoff and L. Kappen. 2001. Field measurements of root respiration and total soil respiration in an alder forest. New Phytol. 150: 157–168.
[47]Kutyova, T. Y., E. P. Durinina, N. E. Muravyova and A. V. Sheyko. 2002. Microbal fertilizers Bamil, Omug, Ekud, Pudret their properties, influence on soil and crops. Herald of Moscow State University, Soil Science series. 4: 40-46.
[48]Lal, R. 2004. Soil carbon sequestration impacts on global climate change and food security. Science. 304: 1623– 1627.
[49]Lin, B., L. Chambers, P. Stackhouse Jr., B. Wielicki, Y. Hu, P. Minnis, N. Loeb, W. Sun, G. Potter, Q. Min, G. Schuster and T. F. Fan. 2010. Estimations of climate sensitivity based on top-of-atmosphere radiation
imbalance. Atmos. Chem. Phys. 10: 1923–1930.
[50]Lopes de Gerenyu, V. O., I. N. Kurganova, L. N. Rozanova and V. N. Kudeyarov. 2005. Effect of soil temperature and moisture on CO2evolution rate of cultivated Phaeozem: analysis of a long-term field
experiment. Plant Soil Environ. 51(5): 213-219.
[51]Maljanen, M., A. Liikanen, J. Silvola and P. J. Martikainen. 2003. Measuring N2O emissions from organic soils
with closed chamber or gas gradient methods. Eur. J. Soil Sci. 54: 625-631.
[52]Marland, G., T. A. Boden and R. J. Andres. 2000. Global, regional and national fossil fuel CO2 emissions. In:
Trends: a compendium of date on global change. Oak Ridge National Laboratory, U.S. Oak Ridge, Tennessee, USA.
[53]Matteucci, G., S. Dore, C. Rebmann, S. Stivanello and N. Buchmann. 2000. Soil respiration in beech and spruce forest in Europe: trends, controlling factors, annual budgets and implications for the ecosystem carbon balance. p. 217-236. In E.D. Schulze (ed.) Carbon and nitrogen cycling in European forest ecosystems. Springer Verlag, Berlin, Germany.
[54]Micks, P., J. D. Aber, R. D. Boone and E. A. Davidson. 2004. Short-term soil respiration and nitrogen
immobilization response to nitrogen applications in control and nitrogen-enriched temperate forests. For. Ecol. Manage. 196: 57–70.
[55]Mosier, A. R., J. A. Morgan and J. Y. King. 2002. Soil-atmosphere exchange of CH4, CO2, NO and N2O in the
Colorado Short grass Steppe under Elevated CO2. Plant Soil. 240: 201–211.
[56]Muñoz1, C., L. Paulino, C. Monreal and E. Zagal. 2010. Greenhouse gas (CO2 and N2O) emission from soils: a
review. CHIL. J. AGR. RES. 70(3): 485-497.
[57]Nosalewicz, M., Z. Stêpniewska and A. Nosalewicz. 2013. Effect of soil moisture and temperature on N2O and
CO2 concentrations in soil irrigated with purified wastewater. Int. Agrophys. 27: 299-304.
[59]Parkin, T. B. and T. C. Kaspar. 2003. Temperature controls on diurnal carbon dioxide flux: Implications for estimating soil carbon loss. Soil Sci. Soc. Am. J. 67: 1763-1772.
[60]Perrin, D., E. Laitat, M. Yernaux, Q. Mezoesy and M. Aubinet. 2003. Temporal and spatial changes in the soil CO2 efflux in a mixed temperate forest (Vielsalm, Belgium). Comparative biochemistry and Physiology: SEB
Abstracts. 134, 3: 191.
[61]Petersen, J., I. K. Thomsen, L. Mattsson, E. M. Hansen and B. T. Christensen. 2010. Grain yield and crop N off take in response to residual fertilizer N in long-term field experiments. Soil Use Manage. 26: 455–464.
[62]Raich J. W., C. S. Potter and D. Bhagavatti. 2002. Interannual variability in global soil respiration, 1980–94. Global Change Biol. 8: 800–812.
[63]Rastogi, N. K., K. S. M. S. Raghavarao, K. Niranjan and D. Knorr. 2002. Recent developments in osmotic dehydration: Methods to enhance mass transfer. Trends in Food Science and Technology. 13: 48-59.
[64]Reth, S., M. Reichstein and E. Falge. 2005. The effect of soil water content, soil temperature, soil pH-value and the root mass on soil CO2 efflux – A modified model. Plant and Soil. 268: 21–33.
[65]Rogalski, L., A. Bęś and K. Warmiński. 2008. Carbon dioxide Emission to the atmosphere from overburden under controlled temperature conditions. Polish J. of Environ. Stud. 17(3): 427-432.
[66]Rustad, L. E., T. G. Huntington and R. D. Boone. 2000. Controls on soil respiration: Implication for climate change. Biogeochemistry. 48: 1–6.
[67]Sainju, U. M., J. D. Jabro and W. B. Stevens. 2008. Soil carbon dioxide emission and carbon sequestration as influenced by irrigation, tillage, cropping system and nitrogen fertilization. J. Environ. Qual. 37: 98-106.
[68]Sarwar, G. 2005. Use of compost for crop production in Pakistan. Ph.D. Dissertation (Published) Ökologie und Umweltsicherung. Universität Kassel, Fachgebiet Landschaftsökologie und Naturschutz, Witzenhausen, Germany.
[69]SAS Institute. 2005. The SAS system for Microsoft Windows. Release 9. 1. SAS Inst., Cary, NC.
[70]Scheffer, F. and P. Schachtschabel. 2002. Lehrbuch der Bodenkunde. Spektrum, Akad. Verl., Heidelberg, Germany, 593 p.
[71]Soderstrom, B., E. Baath and B. Lundgren. 1983. Decrease in soil microbial activity and biomasses owing to nitrogen amendments. Can. J. Microbiol. 29: 1500–1506.
[72]Ullah, M. S., M. S. Islam, M. A. Islam and T. Haque. 2008. Effects of organic manures and chemical fertilizers on the yield of brinjal and soil properties. J. Bangladesh Agril. Univ. 6(2): 271–276.
[73]Valdrighi, M. M., A. Pera, M. Agnolucci, S. Frassinetti, D. Lunardi and G. Vallini. 1996. Effects of compost-derived humic acids on vegetable biomass production and microbial growth within a plant (Cichorium intybus)-soil system: a comparative study. Agriculture, Ecosystems and Environment. 58: 133–144.
[75]Weitz, A. M., E. Linder, S. Frolking, P. M. Crill, and M. Keller. 2001. N2O emissions from humid agricultural
soils: effects of soil moisture, texture and nitrogen availability. Soil and Biogeochemistry. 33: 1077–1093.
[76]Wells, A. T., K. Y. Chan and P. S. Cornish. 2000. Comparison of conventional and alternative vegetable farming system on the properties of a yellow earth in New South Wales. Agriculture, Ecosystems and Environment. 80 (1/2): 962-966.
[77]Wilson, H. M. and M. M. Al-Kaisi. 2008. Crop rotation and nitrogen fertilization effect on soil CO2 emissions in
central Iowa. Applied Soil Ecology. 39: 264-270.
[78]Włodarczyk, T. 2000. N2O emission and absorption against a background of CO2 in eutric cambisol under
different oxidation-reduction control. Acta Agrophisica 28: 39-43.
[79]Yadav, A. C., S. K. Sharma and B. R. Batra. 2002. Effect of sodic water, FYM and gypsum on the soil, growth and yield of brinjal. Ann. Agric. Biol. Res. 7(1): 73-77.
[80]Yassen, A. A., M. Abd El-Hady and S. M. Zaghloul. 2006. Replacement part of mineral N fertilizer by organic ones and its effect on wheat plant under water regime conditions. World J. Agric. Sci. 2: 421-428.
[81]Youssef, M. A. 2011. Synergistic impact of effective microorganisms and organic manures on growth and yield of wheat and marjoram plants. Ph. D. Fac. Agric., Assiut Univ., Egypt.