SELECTION OF OPTIMAL HYPERSPECTRAL VEGETATION
INDICES FOR ESTIMATING CHLOROPHYLL CONTENT OF
SOME PLANT SPECIES
Ghada Khdery,*
[a]Sayed Arafat,
[a]Mohamed Aboelghar,
[a]Mohamed
Tantawy,
[b]Maged Abou-El-Enain
[c]and Usama Kamal
[b]Keywords: Hyperspectral; Spectral indices; Chlorophyll content.
Remote sensing enables for cost-effective, timely efficient and multi-temporal monitoring of natural vegetation. Spectral reflectance pattern either in forms of row reflectance values or form of spectral vegetation indices (SVIs) could be used as estimators of plant biophysical and biochemical parameters through statistical models. The main objective of the current study is to correlate plant chlorophyll concentration with different (SVIs) and to identify the most sufficient index to discriminate among the twenty common natural vegetation species in Sinai Peninsula. Calculated values of five hyperspectral vegetation indices (normalized difference vegetation index (NDVI); Chlorophyll Index; Chlorophyll a,b; Simple ratio index (SRI); Modified chlorophyll absorption ratio index (MCARI) for the twenty observed vegetation species were used as spectral factors in the modeling process. The result showed that the relatively high chlorophyll content was found in broad leaves plants when needle-leaved plant species showed relatively low ones. Laboratory chlorophyll estimation indicated that Asclepias sinaica had the highest chlorophyll content (79 mg cm-2) when the same plant specious showed the highest chlorophyll index value. It was found that plants of family Zygophyllaceae have low chlorophyll content. Among observed SVIs, NDVI was the most correlated index with chlorophyll. At the same time, it was the optimal index to differentiate the different species.
* Corresponding Authors Fax: 26225832
E-Mail: [email protected]
[a] National Authority for Remote sensing and Space Sciences (NARSS), 23, Josef Broz Tito St. Elnozha Elgedida - P.O. Box 1564 Al-Maskan Cairo, Egypt.
[b] Botany Department, Faculty of Science, Ain Shams University, Cairo, Egypt
.
[c] Biological and Geological Sciences Department, Faculty of Education, Ain Shams University, Cairo, Egypt.
INTRODUCTION
Evolution in hyperspectral remote sensing can provide more exact information on structural and biochemical properties of plant species.1 Most of the work on
hyperspectral remote sensing of biophysical and biochemical prosperities has been achieved through the evolution of new hyperspectral indices.2,3,4 Spectral indices
are mathematical processing of spectral reflectance to promote vegetation signal.5,6 Vegetation indices might
supply new capabilities for discriminate plant species or communities that differ in vegetation structure.7 NDVI
(normalized difference vegetation index) calculation is based on the difference in canopy reflectance at red and near-infrared wavelengths.8,9 NDVI has been used to
differentiate plant species consisting of structurally featured formations, e.g., shrubland and forest (Table 1)10,11 or
phenological featured formations.12 New hyperspectral
indices that supply correlation with the biochemical properties of canopies have been developed. Several studies show that narrow band vegetation indices involving visible reflectance near 550 and 700 nm can estimate leaf chlorophyll content such as chlorophyll a and b13 and
carotenoids.14,15 These pigments play important roles within
the process of photosynthesis, and their concentrations can
depend on some factors such as phenology, the degree of canopy development and type of environmental stress.16
Spectral vegetation indices constitute a simple and restful approach to evolve information from remotely sensed data, due to their facility of use, which facilitates the processing and analysis of huge amounts of data obtained by satellite platforms.17,18 Increasing efforts have focused on
comprehension the relationships between vegetation optical properties and photosynthetic pigments concentrations within green leave tissues such as chlorophylls and carotenoids.19,20,21
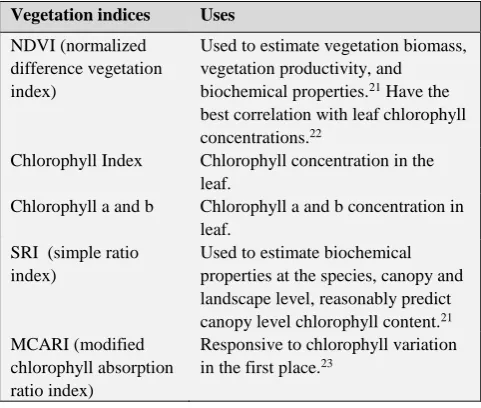
Table 1. Uses of vegetation indices
Vegetation indices Uses
NDVI (normalized difference vegetation index)
Used to estimate vegetation biomass, vegetation productivity, and biochemical properties.21 Have the best correlation with leaf chlorophyll concentrations.22
Chlorophyll Index Chlorophyll concentration in the leaf.
Chlorophyll a and b Chlorophyll a and b concentration in leaf.
SRI (simple ratio index)
Used to estimate biochemical properties at the species, canopy and landscape level, reasonably predict canopy level chlorophyll content.21 MCARI (modified
chlorophyll absorption ratio index)
Responsive to chlorophyll variation in the first place.23
MATERIAL AND METHODS
Flowering shoots of 20 plant species of wild Egyptian plants belonging to 19 genera were collected from natural habitats in Sinai Penninsula. A SPAD-502 Leaf Chlorophyll Meter (Minolta Inc.) was used to estimate the leaf chlorophyll content in each site. The chlorophyll meter (SPAD) provides a simple, quick, method for asses leaf chlorophyll content.24 SPAD values express relative
amounts of chlorophyll in leaves by measuring transmittance in the red (650 nm) and NIR (920 nm) wavelength regions. A total of 20 leaves representing each dominant species were randomly selected in each site. Chlorophyll concentration was measured 3 times at different leaf location and their SPAD readings were recorded. From the 20 individual SPAD measurements, the average was calculated according to Ref.25 (Table 4). Field
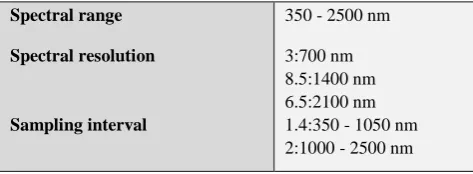
spectroradiometer was used to measure the reflection of the twenty plant species under investigation. Measurements were acquired in Visible, Near Infrared and Short Wave Infrared from 350 nm to 2500 nm with 1 nm interval output data. However, the ASD device Software interpolates the final output data with interval 1nm for all spectrum range 350 - 2500 nm (table 2). The intervals which ASD spectroradiometer is capturing the reflectance is 1.4 nm at visible and near-infrared ranges, while it is 2 nm at the shortwave infrared spectral range. The spectrum characteristics of the device are shown in Table 3. Spectral response for different targets was acquired according to ASD Spectroradiometer measurements protocol, where the reference spectral measured as radiance from a Spectralon® panel to ensure standardized environmental conditions for the reflectance measurement. Moreover, the flexibility of fiber-optic cable provides instrument adaptation for a wide range of applications. The measurements were performed by holding the pistol grip by hand. The Bare fore optic 25 degrees used for outdoor measurements resulting circular field of view with 3 cm diameter as measurements were taken at 3 cm height in nadir position (90 degrees) over the measured plants.
Table 2. The ASD field Spec 3 specifications.
Spectral range 350 - 2500 nm
Spectral resolution 3:700 nm 8.5:1400 nm 6.5:2100 nm
Sampling interval 1.4:350 - 1050 nm 2:1000 - 2500 nm
Considerations of spectroscopy measurements, ASD, field spectrometer
The sources of information pertinent to the issues affecting spectral measurements are fragmented. Further, there are no such documents or manuals that synthesize all the factors influencing spectral measurements and the methods used to minimize and account for extraneous factors in spectral measurement. Issues to be considered when designing a spectral library database have been summarized.26 The factors that affect standardized
measurements can be summarized to include: environmental conditions.
Vegetation indices and chlorophyll content
The values of VIs that calculated from spectroscopy measurements for each plant in the field, it is based on the contrast between maximum absorption of the red spectrum by chlorophyll and pigments followed by maximum reflectance in near infrared spectrum by leaf cellular structure as presented in Table 3. The correlation between five different (VIs) and chlorophyll content was observed and expressed through mathematical correlations as explained in Table 3.
Table 3. Summary of vegetation indices, algorithms and sources for vegetation indices.where Rx is the reflectance at the given wavelength (nm)
Index description Formation Ref.
NDVI (Normalized difference vegetation index)
(R800 R680)/(R800+R680) 7
SR (Simple ratio) R750/R710 27
Cab (Leaf Cab Concentration)
(R750-R705)/(R750+R705) 15
CL (Chlorophyll Index) [R750/(R700 + R710)]−1 15 MCARI (Modified
chlorophyll absorption ratio index)
(R700-R670)-0.2(R 700-R550)-R700/R670
23
RESULTS AND DISCUSSION
Extraction of some biophysicalparameters from remote sensing data
Asclepias sinaica showed the highest chlorophyll content
(79 mg cm-2) followed by Phlomis aurea (73 mg cm-2) while
the lowest chlorophyll content was found in Fagonia
glutinosa (4mg cm-2). The correlation between chlorophyll
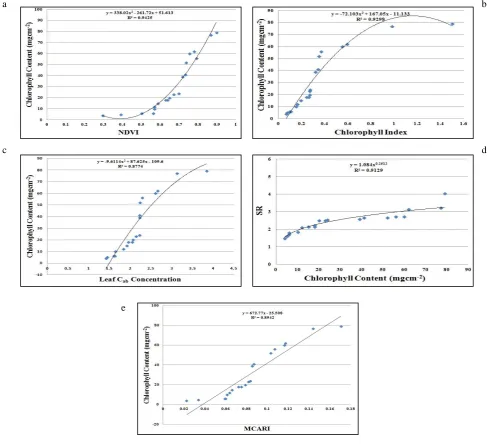
content and remotely sensed data was presented in forms of vegetation indices-chlorophyll correlations as shown in the Figure 1a-1e, Table 5 and 6 and equations.
Results for the regression analysis showed that all of the vegetation indices in the present study positively correlated with the chlorophyll content as follows.
A strong correlation (R2= 0.94) has been found between
Normalized Difference Vegetation Index (NDVI) and chlorophyll Content as presented in (Figs. a) and the subsequent equation:
Y= 338.0x2- -261.72x-51.613
A strong correlation (R2= 0.92) was also found between
Chlorophyll index and chlorophyll content as shown in (Figs. b) and the subsequent equation:
Y= 72.103x2- 167.05x-11.133
A good correlation (R2= 0.87) was observed between leaf
a b
c d
e
Figure 1a-e. The correlation between chlorophyll content and difference vegetation indices a. The relation between (NDVI) and chlorophyll content to differentiate between studied taxa, b: Relation between chlorophyll index and chlorophyll content, c. The relation between leaf Cab concentration and chlorophyll content, d. Relation between simple ratio (SR) and chlorophyll content and e. Relation between (MCARI) and chlorophyll content
Y= 9.6114x2-67.625x-109.6
A strong correlation (R2= 0.91) was also found between
the normalized simple ratio (SR) and chlorophyll content as shown in (Fig. 1d) and the subsequent equation:
Y= 1.084x0.2512
A good correlation (R2= 0.89) was found between the
modified chlorophyll absorption ratio index (MCARI) and chlorophyll content as shown in (Fig. 1e) and the subsequent equation.
Y= 672.77x-25.508
Table 4. Chlorophyll content of studied taxa.
Chlorophyll content (mg cm2)
Plant
10 Achillea fragrantissima
18 Aerva tomentosa
52 Alkanna orientalis
79 Asclepias sinaica
15 Astragalus sieberi
39 Ballota kaiseri
73 Echinops spinosus
4 Fagonia glutinosa
41 Hyoscyamus muticus
23 Matthiola arabica
24 Matthiola longipetala
6 Peganum harmala
77 Phlomis aurea
12 Pyrethrum santolinoides
18 Stachys aegyptiaca
20 Teucrium polium
56 Verbascum sinaiticum
6 Zilla spinosa
5 Zygophyllum simplex
Table 5. Correlation coefficients between the original indices and chlorophyll content of studied taxa.
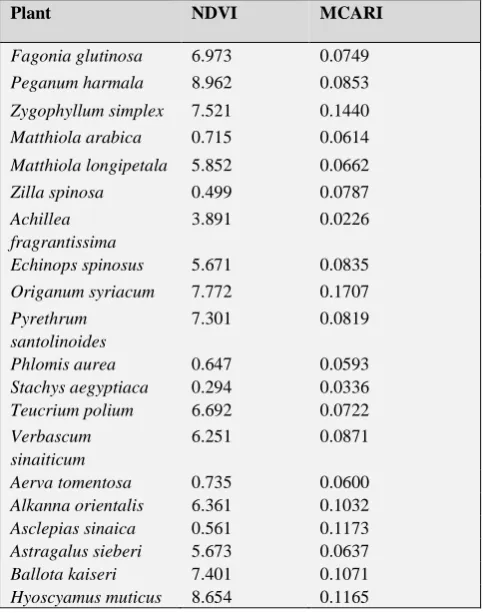
Table 6. Spectral indices related to biochemical and biophysical vegetation parameters: NDVI, normalized difference vegetation index; MCARI and the modified chlorophyll absorption ratio index
Regarding chlorophyll content analysis, showed that generally, the high chlorophyll was found in these plant species with broad leaves when needle-leaved plant species showed low chlorophyll content also noticed that plant of family Zygophyllaceae has low chlorophyll content. Results for the regression analysis showed that all of the observed vegetation indices positively correlated with the chlorophyll content. It was found that Strong correlation between, NDVI and chlorophyll content (R2= 0.94) and also a good
correlation (R2= 0.91) between simple ratio and chlorophyll
index. This agreed with Ref.14 who reported the strong
correlation between vegetation indices and chlorophyll content. High values of these indices and their strong correlation with chlorophyll content indicated the high capability of the VIs as indicators for plant status and physiological condition. The strong correlation (R2= 0.88)
between chlorophyll content and the calculated leaf Cab concentration also showed the method in which remote sensing tools could be used to estimate plant biophysical parameters instead of the other time consuming and costly traditional methods. This agreed with Refs.28,29
Table 7. Spectral indices related to biochemical and biophysical vegetation parameters: SR, simple ratio; Cab, Chlorophyll a, b.
CONCLUSION
The result showed that Normalized Difference Vegetation Index (NDVI) was the most correlated index to chlorophyll content. Also, it was the optimal vegetation index to differentiate among the different species. It was found that plants of family Zygophyllaceae have low chlorophyll content as also indicated by chlorophyll spectral index. The study showed high compatibility between spectral index and biochemical parameters of the natural vegetation. The study succeeded in generating statistical correlation to retrieve chlorophyll from spectral reflectance data with high accuracy.
Plant NDVI MCARI
Fagonia glutinosa 6.973 0.0749 Peganum harmala 8.962 0.0853 Zygophyllum simplex 7.521 0.1440 Matthiola arabica 0.715 0.0614 Matthiola longipetala 5.852 0.0662 Zilla spinosa 0.499 0.0787 Achillea
fragrantissima
3.891 0.0226
Echinops spinosus 5.671 0.0835 Origanum syriacum 7.772 0.1707 Pyrethrum
santolinoides
7.301 0.0819
Phlomis aurea 0.647 0.0593 Stachys aegyptiaca 0.294 0.0336 Teucrium polium 6.692 0.0722 Verbascum
sinaiticum
6.251 0.0871
Aerva tomentosa 0.735 0.0600 Alkanna orientalis 6.361 0.1032 Asclepias sinaica 0.561 0.1173 Astragalus sieberi 5.673 0.0637 Ballota kaiseri 7.401 0.1071 Hyoscyamus muticus 8.654 0.1165
Vegetation indices R2
NDVI 0.94
Chlorophyll index 0.92
Cab 0.87
SR 0.91
MCARI 0.89
Plant Chloro-phyll Index
Leaf Cab Concen-t-ration
SR
Fagonia glutinosa 0.319 2.223 0.319 Peganum harmala 0.368 3.836
2.576
Zygophyllumsimplex
0.241 2.046
4.033
Matthiola arabica 0.550 2.602 2.498 Matthiola
longipetala
0.104 1.947
2.510
Zilla spinosa 0.0986 1.621
3.2296
Achilleafragrantissima
0.151 1.595 1.480
Echinops spinosus 0.0736 1.635
2.539
Origanumsyriacum
0.162 2.058 0.162
Pyrethrum santolinoides
0.346 2.284
2.66
7
Phlomis aurea 0.339 2.233
2.65
5
Stachysaegyptiaca
0.260 1.416
2.7
1
3Teucrium polium 0.267 2.132
2.72
1
Verbascumsinaiticum
0.2732 2.221
3.14
9
Aerva tomentosa 0.590 2.654
1.599
Alkanna orientalis 1.498 1.8291.704
Asclepias sinaica 0.191 1.4391.80
4
Astragalus sieberi 0.069 1.9091.849
Ballota kaiseri 0.267 2.2152.104
Hyoscyamusmuticus
REFERENCES
1Blackburn, G. A., Spectral indices for estimating photosynthetic pigment concentrations: A test using senescent tree leaves. Int. J. Remote Sensing, 1998, 19(4), 657–675.
DOI:10.1080/014311698215919
2Chappelle, E. W., Kim, M. S., Murtrey, M. C.,Ratio analysis of reflectance spectra (RARS): An algorithm for the remote estimation of the concentrations of chlorophyll A, chlorophyll B, and carotenoids in soybean leaves. Remote Sensing Environ., 1992, 39(3), 239-247. DOI:10.1016/0034-4257(92)90089-3
3Carter, G. A., Ratios of leaf reflectances in narrow wavebands as indicators of plant stress. Int.J. Remote Sensing, 1994, 15:
697–703. DOI:10.1080/01431169408954109
4Gitelson, A., Merzlyak, M., Remote Estimation of Chlorophyll Content in higher Plant Leaves. Int. J. Remote Sensing, 1997, 18(12), 291-298. DOI:10.1080/014311697217558
5Huete, A. R., Jackson, R. D.,Soil and atmosphere influences on the spectra of partial canopies. Remote Sensing Environ.,
1988, 25(1), 89-105. DOI: 10.1016/0034-4257(95)00034-X
6Qi, J., Moran, M. S., Cabot, F., Dedieu, G., Normalization of sun/view angle effects using spectral albedo-based vegetation indices. Remote Sensing Environ., 199552(3), 207-217. DOI: 10.1016/0034-4257(95)00034-X
7Nagendra, H., Benefits of hyperspectral remote sensing for tracking plant invasions. Diversity and Distributions, 2011,
17, 381–392.
8Rouse, J. W, Haas, R. H, Schell, J. A., Deering, D.W., Harlan, J. C.,Monitoring the Vernal Advancement of Retrogradation of Natural Vegetation. NASA/GSFC, Type III, Final Report, Greenbelt, MD, 1974
9Tucker, C. J., Garrett, M. W., Leaf optical system modeled as a stochastic process. Appl. Optics, 1977, 16, 1151–1157.
DOI:10.1364/AO.16.000635
10Achard, F., Estreguil, C.,Forest classification of South East Asia using NOAA AVHRR data. Remote Sensing Environ.,1995, 54, 198-208. DOI: 10.1016/0034-4257(95)00153-0
11Saney, G. B., Elliott, R. L., Capacity of AVHRR data in discriminating rangeland cover mixtures. Int. J. Remote Sensing, 2002, 23, 299-312.
12Van Wagtendonk, J. W., Root, R. R, The use of multitemporal normalized difference vegetation index (NDVI) data for mapping fuel models in Yosemite National Park, USA. Int. J. Remote Sensing, 2003, 24, 1639-1651. DOI:10.1603/0022-2585(2005)042[0075
13Gitelson, A. A., Merzlyak, M. N., Signature analysis of leaf reflectance spectra: Algorithm development for remote sensing of chlorophyll. J. Plant Physiol., 1997, 148, 494-500
DOI: 10.1046/j.1469-8137.1999.00424.
14Gamon, J. A., Surfus, J. S., Assessing leaf pigment content and activity with a reflectometer. New Phytol., 1999, 143, 105- 117. 494-500DOI: 10.1046/j.1469-8137.1999.00424.x
15Gitelson, A. A.; Zur Y.; Chivkunova, O. B. , Merzlyak, M. N., Assessing carotenoid content in plant leaves with reflectance spectroscopy. Photochem. Photobiol., 2002, 75, 272- 281.DOI:10.1562/0031-8655(2002)075
16Blackburn, G. A., Pitman, J. I., Biophysical controls on the directional spectral reflectance properties of bracken (Pteridium aquilinum) canopies: results of a field experiment. Int. J. Remote Sensing, 1999, 20(11), 2265-2282.
DOI:10.1080/014311699212245
17Govaerts, Y. M., Verstraete, M. M; Pinty, B., Gobron, N., Designing optimal spectral indices: feasibility and proof of concept study. Int. J. Remote Sensing, 1999, 20(9), 1853-1873. DOI.10.1080/014311699212524
18Myneni, R. B.; Hall, F. G.; Sellers, P. J., Marshak, A. L., The meaning of spectral vegetation indices. IEEE Trans. Geosci. Remote Sensing, 1995, 33, 481 – 486.
19Demarez, V., Gastellu-Etchegorry, J. P., A modeling approach for studying forest chlorophyll content. Remote Sensing Environ., 2000, 71, 226–238. DOI: 10.1016/S0034-4257(99)00089-9
20Zarco-Tejada, P. J., Miller, J. R., Noland, T. L., Mohammed, G. H., Sampson, P. H., Scaling-up and model inversion methods with narrow-band optical indices for chlorophyll content estimation in closed forest canopies with hyperspectral data. IEEE Trans. Geosci. Remote Sensing, 2001, 39, 1491–1507.
DOI: 10.1109/36.934080
21Sims, D. A., Gamon, J. A., Relationships between leaf pigment content and spectral reflectance across a wide range of species, leaf structures and developmental stages. Remote Sensing Environ., 2002, 81, 337–354. DOI: 10.1016/S0034-4257(02)00010
22Gu, Y., Brown, J. F., Verdin, J. P., Wardlow, B., A five-year analysis of MODIS NDVI and NDWI for grassland drought assessment over the central Great Plains of the United States, Geophys. Res. Lett., 2007, 34, L06407. DOI: 10.1029/2006GL029127.
23Daughtry, C. S. T., Walthall, C. L., Kim, M. S., Brown de Colstoun, E., McMurtrey III, J. E., Estimating corn leaf chlorophyll concentration from leaf and canopy reflectance. Remote Sensing Environ., 2000, 74, 229–239. DOI: 10.1016/S0034-4257(00)00113
24Minolta, Chlorophyll meter SPAD-502. Instruction Manual, Minolta Camera BeNeLux BV. Maarssen, The Netherlands,
2003.
25Nakano, M., Nomizu, T., Mizunashi, K., Suzuki, M.,Mori, S., Kuwayama, S., Hayashi, M., Umehara, H., Oka, E., Kobayashi, H., Asano, M., Sugawara, S., Takagi, H., Saito, H., Nakata, M., Godo, T., Hara, Y. and Amano, J., Somaclonal variation in Tricyrtis hirta plants regenerated from 1-year-old embryogenic callus cultures. Scientia Horticult., 2006, 110(4), 366–371. DOI: 10.1016/j.scienta.2006.07.026
26Pfitzner, K., Field-based spectroscopy – do we need it? North Australian Remote Sensing and GIS Conference (NARGIS),
2005, July 4–7 2005, Charles Darwin University, Darwin. 27Slater, P. N., Jackson, R. D., Atmospheric effects on radiation
reflected from soil and vegetation as measured by orbit sensors using various scanning directions. Appl. Optics, 1982,
21, 3923. DOI: 10.1364/AO.21.003923
28Demarez, V., Gastellu-Etchegorry, J. P., A modeling approach for studying forest chlorophyll content. Remote Sensing Environ., 2000, 71, 226–238. DOI: 10.1016/S0034-4257(99)00089-9
29Zarco-Tejada, P. J., Miller, J. R., Morales, A., Berjon, A., Aguera, J., Hyperspectral indices and model simulation for chlorophyll estimation in open-canopy tree crops. Remote Sensing Environ., 2004, 90, 463–476.
DOI:10.1016/j.rse.2004.01.017 ·