Published by Science and Education Publishing DOI:10.12691/jbms-8-2-5
Evaluation of the Operational Efficiency of Selected
Senior and Vocational High Schools in Taiwan with DEA
Meta-Frontier Approach: A Managerial Perspective
Hsiang-Hsi Liu1,*, Fu-Hsiang Kuo2
1
Graduate Institute of International Business, National Taipei University, Taiwan 2
Department of Information Management, Chaoyang University of Technology, Taiwan *Corresponding author: hsiang@mail.ntpu.edu.tw
Received April 25, 2020; Revised May 27, 2020; Accepted June 03, 2020
Abstract
This study aims to evaluate and compare the operational efficiency and technology gap of selected senior and vocational high schools in Taiwan under different teaching and learning levels based on the DEA meta-frontier approach. The empirical results show that these two types of high schools have different technology gap ratios (TGRs) or meta-technology ratios (MTRs). We also perform a statistical test to examine the evidence that there is a significant difference in the operating performance of these two types of schools and result shows evidence that the different operational performance of senior and vocational high schools is due to different characteristics/attributes. Regarding TGRs or MTRs, senior high schools outperform vocational high schools. A relatively low average TGRs or MTRs of vocational high schools mean that the existing technology in vocational high schools are not near the frontier of meta-technology and that there is more room for improvement in management skills or operational processes. These findings can also provide a reference for educational agencies or high schools when formulating policies and strategies on the efficiency of school operations.Keywords
: operational efficiency, technology gap ratio, Data Envelopment Analysis (DEA), DEA meta-frontiermodel, senior and vocational high school
Cite This Article:
Hsiang-Hsi Liu, and Fu-Hsiang Kuo, “Evaluation of the Operational Efficiency of Selected Senior and Vocational High Schools in Taiwan with DEA Meta-Frontier Approach: A Managerial Perspective.” Journal of Business and Management Sciences, vol. 8, no. 2 (2020): 67-76. doi: 10.12691/jbms-8-2-5.1. Introduction
The creation of information and knowledge is essential to human life. In today's world, students need more information to create knowledge to face the complex and constantly changing work and living environment. Therefore, the Ministry of Education in Taiwan attaches great importance to integrating information and knowledge creation into teaching and student learning. In high school, formal learning and knowledge creation form the core of curriculum-oriented operations, and learning emphasizes acquiring knowledge from the teaching of sub-disciplinary information. In vocational high schools, students are encouraged to use information to create knowledge, which emphasizes the use of knowledge and professional training. These schools focus on independent learning and professional training of students [9]. Obviously, the learning and teaching goals of different educational institutions in senior high schools and vocational high schools are different. The management skills of these schools are also different. To assess their management efficiencies, we cannot assume that educational institutions with different characteristics/attributes are at
the same technical level. This study utilized the DEA meta-frontier model to assess school management efficiencies under different know-how or technology levels.
In addition, in terms of the effectiveness of student learning, school efficiency depends on many intertwined factors. These factors include student talent, family support, school culture, teacher quality, teacher-student relationship, and student motivation to learn. Moreover, previous literature indicates that the sustainability of mobile e-learning depends not only on its adoption but also on educational needs, success factors, limitations and challenges, and changes and risks in mobile learning programs [16]. Although these factors can also affect the school's operational efficiency, previous research did not consider that schools have different characteristics / attributes, especially the differences in management of different educational institutions such as senior high schools and vocational high schools.
competitive advantage, meet the needs of students and parents, and promote their unique characteristics/attributes through innovative operations so that they could win the favor of parents and students [3]. The government first implemented mobile e-learning in senior high schools and then in vocational high schools because the government implements new learning techniques in batches, considering the different teaching environments required by schools and students. The introduction of mobile e-learning for teaching has also resulted in Taiwan ’s high schools and vocational high schools having different management techniques, teaching, and learning activities, and further affect the operational efficiency of these two types of schools.
In sum, according to the different characteristics/attributes of educational institutions, the impact of mobile e-learning or other teaching technologies and learning environments on school management efficiency is also different. However, there is no extensive discussion in Taiwan’s academic literature on whether operational efficiency varies with school characteristics/attributes (senior and vocational high schools). The relevant theoretical basis has not been widely disseminated, and few studies have focused on new perspectives for evaluating school efficiency based on different school characteristics/attributes. Therefore, it is necessary to study how to compare operational efficiencies and technological gaps between different groups. Appropriately, we employ the DEA meta-frontier model to analyze the school management efficiency considering different school characteristics/attributes such as senior high and vocational high schools.
The reminders of this paper are organized as follows. Section 2 presents a review of the relevant literature. Section 3 describes the methodology of the DEA meta-frontier models. Section 4 discusses the empirical results. The study then provides the concluding remarks in section 5.
2. Review of Literature
The operational efficiency of a school varies greatly due to differences in human and financial capital, economic infrastructure, available resources and endowments, and any other characteristics of the social and economic environment in which the school operates and manages. In most cases, different stages or types of education such as senior high and vocational high schools are separated when we evaluate school efficiencies. Hence, assuming they have the same level of technology and knowledge, we will not be able to accurately assess the management efficiency of these schools. Relevant researches show that schools have different characteristics / attributes, such as the number of students, the number of teachers and the size of the school will affect the school's operating efficiency.
Because the school's administrative resources are different and they are in different regions, which makes the school face different operation or service opportunities. In this study, we try to find technically better school operations and management from different possible input-output combinations of different types of school education. Meanwhile, as indicated by the study of Portela and
Thanassoulis [14], government agencies or many private institutions fund or donate schools at different levels or types and can be based on their management efficiency by evaluating different production or service areas. Therefore, we extend the efficiency analysis to include the context of student level, school level and even different types of schools such as senior and vocational high schools in Taiwan.
In the research of the efficiency frontier, Farrel's [7]
DEA model initially introduced the production frontier to measure the efficiency of enterprises / units. They pointed out that the use of production frontier is a common practice to assess the level of efficiency. This frontier can be evaluated by using non-parametric methods to predict various non-random assumptions. Once the frontier surface is defined, the efficiency of each element can be measured by comparing the radial efficiency measurement with the frontier as mentioned by Fried, Schmidt and Yaisawarng [8] and Wongchai, Liu and Peng [18]. The model mainly considers the same technical level. However, in this study, we tried to evaluate and compare the technical efficiency of the selected senior and vocational high schools, which have different levels of operational and proprietary technology. Since this study uses the DEA meta-frontier model to evaluate the performance of different types of education in order to obtain more concepts and inspirations from the research on the DEA meta-frontier model, here is a review of the most relevant literature about educational performance and/or DEA meta-frontier methodology in this field.
Rao, O'Donnell and Battese [15] developed a meta-frontier model using alternative descriptions of production technology. In empirical applications, they use DEA and stochastic frontier analysis (SFA) to estimate the meta-frontiers of countries in different regions. The results of the study show important significance. DEA can be used to study multiple output and multiple input technologies. DEA treats all noise as inefficient. Therefore, it is very sensitive to outliers. From this perspective, the stochastic frontier is more satisfactory, but it can only handle a single output, so a certain degree of aggregation is required at the output. In agriculture, the two-output model of crop and livestock is more realistic. In the next next year, Battese, Rao and O'donnell [2] proposed a meta-frontier production function model for companies with different technology groups. The meta-frontier model is used to evaluate the technical efficiency of the Indonesian apparel industry. The sample is panel data from five different regions (Indonesian apparel companies are divided into five regions: Jakarta, West Java, Central Java, East Java, and Outlying Islands) from 1990 to 1995 and if the regional stochastic frontier production function model has an inefficient effect on the time-varying structure. The empirical results show that in Jakarta, the average technical efficiency of garment companies is the highest relative to the meta-frontier. For other regions, the technical efficiency calculated relative to the meta-frontier function is much lower than the technical efficiency calculated based on the region frontiers.
and meta-frontiers. Their data set includes observations of 97 countries in the five years from 1986 to 1990. These countries are evenly distributed throughout the world, accounting for about 99% of the world’s population and total agricultural output. Empirical examples using cross-country agricultural data provide evidence that European agricultural producers operate in a relatively restricted production environment (using SFA results). The main results indicate that there are significant differences between the SFA and DEA models when estimating the technical efficiency (TE) and meta-technical ratios (MTRs) of the selected country/region. Due to the heterogeneity of companies, the quantities of inputs and outputs and technological progress are different at different times and in different countries.
Wongchai, Liu and Peng [18] applied DEA meta-frontier approach to analyze the differences of technical efficiencies (TEs) and technical gap ratios (TGRs) of national universities in 5 regions of Thailand. The empirical results support the basic hypotheses that TEs and TGRs are quite different in Bangkok, Central, North, and Northeast regions. They also find that no any regional frontier can reach the meta-technology because TGRs are still with lower scores in some regions. The lower the TGRs’ scores of a region, the more technological improvements that region needs to implement.
Thieme, Prior and Tortosa-Ausinav [17] proposed a methodology for evaluating the educational performance of students in the fourth year of primary schools in urban areas in Chile from a multilevel perspective. They used partial frontier approaches to mitigate the influence of outliers and the problem of dimensionality. Their results were in line with previous findings that less than 30% of the variance in students’ educational performance was attributable to their schools. These results corroborate that a model that only considers student-level variables yields high inefficiencies not attributable to school management but rather to an inadequate resource-endowment policy. Thus, when specific variables concerning resources allocated to schools are disregarded, the performance of those schools is undervalued.
Cordero, Prior and Simancas [6] evaluated the educational performance of Spanish students in PISA 2009 and divided their efficiency into different components, with an emphasis on analyzing the differences between public schools and state-funded private schools. They used a meta-frontier framework to assess each student’s best practice frontiers (students from the same school) relative to their respective groups and the differences in the best practices constructed by different types of schools (e.g., public and state-funded private schools). Their results show that although state-owned public schools’ control both types of students enrolled at the same time, the difference between the two has been greatly reduced, the performance of public schools has declined.
Kritikos [10] compared the technical efficiency differences between technical schools and general high schools operating in the same community in the center of Athens. These schools are divided into two groups, ten technical schools and ten high schools. Due to the heterogeneity between the two groups of schools, he applies the DEA meta-frontier model to measure and
compare their technical efficiency. The results show that the technical efficiency scores of high schools and technical schools are high, while the meta-frontier technical efficiency scores of technical schools are very low. These results also highlight that the technology gap ratios (TGRs) or meta-technology ratios (MTRs) of high schools is higher than that of technical schools.
Based on the above literature review, it is evident that most studies have used the meta-frontier model as their main research method, emphasizing the measurement of meta-frontier technical efficiency (MP-TE) and TGR. This study recognizes that each school level has its own production frontier. Relative efficiency scores cannot be directly compared, nor can the DEA model be used directly to analyze school management efficiency. Therefore, we utilize the meta-frontier technique, proposed by Battese, Rao and O'donnell [2] and O'Donnell, Rao and Battese [12], to address this difficulty. In other words, the meta-frontier model has been widely used for efficiency analysis between groups operating at different technology levels [10]. Therefore, the meta-frontier model is suitable for the efficiency and technology gap analysis of different groups at different technology levels.
3. Research Methodology
As mentioned earlier, the purpose of this study is to evaluate and compare the technical efficiencies and technological gaps of selected senior high and vocational high schools in Taiwan. Therefore, this study employs the DEA meta-frontier model to measure efficiencies. The basic efficiency measure and test method are described as follows:
3.1. DEA Method
DEA is a linear programming model used to determine effective frontiers, including the effective decision unit (DMU). The efficiency score reflects the company's ability to produce maximum output at a given input level
[4]. From the following Equation (1):
s r rk r 1
k m
i ik i 1
u y max h
v x
=
= =
∑
∑
(1)1
1
s.t. 1, j 1,..., n s
r rj r
m i ij i
u y
v x =
=
≤ =
∑
∑
ur, vi≥ ε> 0,𝑟𝑟= 1, . . . ,𝑠𝑠,𝑖𝑖= 1, . . . ,𝑚𝑚.
where xij is the amount of the i-th input to DMU j, yrj is the amount of the r-th output to DMU j;ur, vi are called r virtual multiplier output and i virtual input multiplier; The efficiency obtained by the value of hk is relative efficiency, called CCR-DEA model efficiency, the ε is a non-Archimedean positive element smaller any real number ( 10−6 ), the CCR model is called non-Archimedean small number.
Charnes and Cooper [1] extended CCR-DEA model from a constant return to scale (CRS) to a variable return to scale (VRS) situation and call the output-oriented BCC-DEA mode efficiency l. As above is obtained from the following Equation (2):
n
j i 1
1. λ =
=
∑
(2)The BCC-DEA model forms a convex hull of efficiency frontier, which envelops the data points more tightly than the CCR-DEA model (such as total technical efficiency (TE)). Therefore, it provides a pure technical efficiency (PTE) score that is not lower than the score obtained using the CCR-DEA model.
3.2. DEA Meta-Frontier Model
Battese, Rao and O'donnell [2] estimated TE by using random production frontiers because it provides a sub-frontier production function model for companies using different technology groups. Therefore, in the DEA model, the group frontiers are constructed by estimating the DEA model of each group, and then the meta frontiers is estimated by pooling all the observations of all groups. According to the research by Battese, Rao and O'donnell
[2], we can use the following three steps to estimate the technology gap rate (TGR):
Step 1: The meta-frontier model is the envelope of a subgroup’s frontier and considers multiple outputs. Therefore, the assumption of VRS is reasonable. This study uses the output-oriented BCC-DEA model with I regions and M outputs.
Step 2: According to the meta-frontier model [2] and shown in Figure 1, when the input level is given, the circled numbers are the average values of the potential stochastic frontier outputs. The value of the meta-frontier function is not less than the deterministic component of the stochastic frontier production from different groups. This figure shows that there are two different efficiency frontiers.
Figure 1. Meta-Frontier Function Model
Step 3: The process of measuring the technical gap ratio (TGR) or meta-technology ratio (MTR) of each DMU:
TE TE TGR
TE TE MTR
it it it
it it it
MP GP x
or MP− =GP− x
− = −
(3)
In Equation (3), the technical efficiency measured with respect to the meta-frontier (MP-TE) is equal to the product of technical efficiency measured with respect to the group-frontier (GP-TE) and technology gap ratio (TGR) or meta-technology ratio (MTR). The MP-TE and GP-TE in this study is technical efficiency under the output-oriented BCC-DEA model by Equation (1).
3.3. Kruskal-Wallis Test Method
The Kruskal-Wallis test method [11,13] used to prove the difference in efficiency between groups is defined as Equation (4):
(
)
(
)
2 k
2 i
T
T T i 1 i
R 12
W 3(n 1) ~ x 1 .
n n 1 = n k
= − + −
+
∑
(4)For testing following hypothesis:
0 1 2
1: 1 2
: 0
0 H
H
µ
µ µ
µ =
≠ −
−
Where
nT: the total number (all ni) for k samples, each of size ni Ri: the sum of the ranks (from all samples pooled) for the
ith sample
ni: indicates the number of schools (as senior high and vocational high schools)
μ1: average efficiency (ratio) of MP-TE, GP-TE and TGR for the first group 1.
μ2: average efficiency (ratio) of MP-TE, GP-TE and TGR for the second group 2.
4. Empirical Results and Analysis
The empirical analysis of this study to evaluate the operational efficiency and technology gap of school management for senior and vocational high schools by the DEA meta-frontier model.
4.1. Study Object, data Description and
Correlation Analysis
In this section, we will describe the study objects, the scopes and source of the data, input and output variables and their description statistics as well as correlation coefficients.
schools (Ε1)−(𝛦𝛦7) and 2 vocational high schools (𝛦𝛦8)−(𝛦𝛦9), in this study.
It is worth noting that because the relevant data has been drawn for three consecutive years and the information is complete, we selected and used a sample of 9 schools from 2013 to 2015. The data we use to measure school efficiency in this study comes from the Ministry of Education of Taiwan (http://mlearning.ntust.edu.tw/).
4.1.2. Variable Selection for Inputs and Outputs in This Study
The input and output variables applied in this study are described as follows. Input variables include three items: the number of full-teachers, the number of part-time teachers, and the number of staffs. Output variables include three items: the total number of the school students, the number of graduates, and the number of school classes. The choice of input and output variables also depends on the BCC DEA model, which is a good way to evaluate efficiency. The study also formulated basic hypotheses for the model. If the conditions studied failed to match the hypotheses, the effectiveness of the model would be compromised. Therefore, when applying the BCC DEA model, the number of DMUs should be equal to or greater than the product of the number of inputs and the number of outputs. Otherwise, the efficiency of each DMU estimated by DEA will be close to a value of one, and the performance of DMU cannot be
distinguished [5]. Since this study adheres to this principle, the difference in efficiency can be estimated and compared among schools that consider different types of education (e.g., senior and vocational high schools). As mentioned above, in this study, the input and output variables are defined in Table 1.
4.1.3. Data Descriptions and Correlation Coefficients between Input and Output
A. Description statistics
According to final the data set for the three initial input variables and the three initial output variables, the descriptive statistics of variables are listed in Table 2.
B. Correlation Coefficients between Input and Output Meanwhile, this study uses Pearson correlation analysis, first analyzing the degree of correlation between input and output variables, and then checking whether the relationship between input and output is consistent with the “isotonicity” relationship. In other words, after the input increases, the output must also increase, that is, both must have a positive correlation and the DEA estimation principle can be followed for efficiency measurement and comparison between DMUs. The results of the final correlation estimates are shown in Table 3. The results show that the correlation coefficients between each of the two variables are positive and high, indicating that input and output variables we selected are appropriate for measuring the efficiencies of the schools.
Table 1. Definition of the Input and Output Variables Applied in This Study
Indicators Code Definition
1 full-time teachers (Input Indicator) 𝑥𝑥1 The total number of full-time teachers
2 part-time teachers (Input Indicator) 𝑥𝑥2 The total number of part-time teachers
3 Staffs (Input Indicator) 𝑥𝑥3 The total number of staffs
4 school students (Output Indicator) 𝑦𝑦1 The total number of school students
5 Graduates (Output Indicator) 𝑦𝑦2 The number of graduates
6 Classes (Output Indicator) 𝑦𝑦3 The number of school classes
Table 2. Descriptive Statistics of Variables
Indicators Minimum Maximum Mean SD Variance
𝑥𝑥1 70.00 195.00 143.11 38.97 1518.64
𝑥𝑥2 1.00 73.00 17.70 19.62 385.06
𝑥𝑥3 17.00 80.00 30.59 16.87 284.64
𝑦𝑦1 723.00 4729.00 1962.3 1115.21 1243700.7
𝑦𝑦2 294.00 1146.00 598.96 274.68 75447.96
𝑦𝑦3 18.00 109.00 53.19 25.77 664.00
Table 3. Correlations between Inputs and Outputs
𝑥𝑥1 𝑥𝑥2 𝑥𝑥3 𝑦𝑦1 𝑦𝑦2 𝑦𝑦3
𝑥𝑥1 1 0.421 0.528 0.819 0.825 0.815
𝑥𝑥2 1 0.855 0.775 0.583 0.773
𝑥𝑥3 1 0.792 0.567 0.761
𝑦𝑦1 1 0.905 0.978
𝑦𝑦2 1 0.867
4.2. Efficiency Analysis
Regarding the efficiency analysis based on the estimation results from DEA meta-frontier model, Section 1 discusses the efficiency of senior high schools, Section 2 describes the efficiency of vocational high school, Section 3 depicts the correlation analysis of MP-TE, GP-TE and TGR and Section 4 shows the efficiency comparisons among different groups.
4.2.1. DEA Meta-Frontier Analysis of Senior High Schools
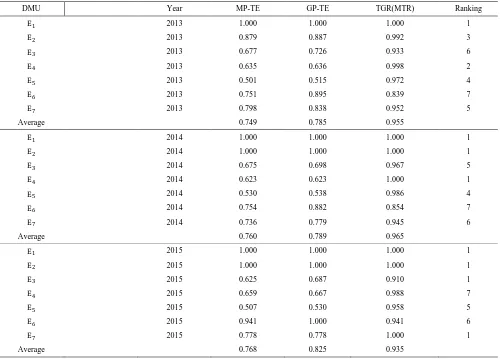
The estimated results of the group-frontier technical efficiency (GP-TE), MP-TE, TGR, or MTR for senior high schools are shown in Table 4.
Considering the same technology level (or the same group), the technical efficiency can be measured the group frontier (i.e., GP-TE). The GP-TE measures the technical level of the same group. As shown in Table 4, senior high schools with GP- TE values of "1" show that these schools have higher efficiency within this group. First Girl High School, Municipal Fu-Xing Senior High School, and Chi Jen Senior High School have a GP-TE value of “1” for the period 2013–2015. In contrast, the GP-TE values of another four schools are lower than “1” and the gap between the operational efficiencies of senior high schools can be resolved by the schools themselves. They need further adjust or improve their resource allocation and/or implement technological changes.
Considering different technology levels, MP-TE can be calculated to measure technical efficiency. As shown in
Table 4, senior high schools with MP-TE values of “1” indicate that these schools have effectively utilized their resources and do not need to make any further adjustments or improvements at their current technology level.For example, First Girl High School, Municipal Fu-xing Senior High School, and Chi-Jen Senior High School have MP-TE values of “1” for the period 2013–2015. In contrast, the MP-TE values of the other four schools are all lower than “1” and require further adjustments or improvements in resource utilization and management skills. On average, the MP-TE values of senior high schools are lower than their GP-TE values.
Furthermore, TGR or MTR measures the ratio of the output level of the group frontier to the output level of the common frontier based on the current production technology of the group. The TGR or MTR measures the distance between a group frontier and the meta-frontier. As shown in Table 4, the First Girl High School, Municipal Fuxing Senior High School, and Chi Jen Senior High School have higher TGR or MTR values than other high schools. This shows that these schools have higher technical efficiency or technological progress than others. However, the TGR or MTR values of other high schools were close to 0.955-0.935 during 2013-2015. Technology gap refers to the gap caused by differences in characteristics/attributes such as technical knowledge, economic environment, regulations and society. Therefore, these results can provide for suggestions for government agencies.
Table 4. DEA Meta-Frontier Analysis of Senior High Schools
DMU Year MP-TE GP-TE TGR(MTR) Ranking
Ε1 2013 1.000 1.000 1.000 1
Ε2 2013 0.879 0.887 0.992 3
Ε3 2013 0.677 0.726 0.933 6
Ε4 2013 0.635 0.636 0.998 2
Ε5 2013 0.501 0.515 0.972 4
Ε6 2013 0.751 0.895 0.839 7
Ε7 2013 0.798 0.838 0.952 5
Average 0.749 0.785 0.955
Ε1 2014 1.000 1.000 1.000 1
Ε2 2014 1.000 1.000 1.000 1
Ε3 2014 0.675 0.698 0.967 5
Ε4 2014 0.623 0.623 1.000 1
Ε5 2014 0.530 0.538 0.986 4
Ε6 2014 0.754 0.882 0.854 7
Ε7 2014 0.736 0.779 0.945 6
Average 0.760 0.789 0.965
Ε1 2015 1.000 1.000 1.000 1
Ε2 2015 1.000 1.000 1.000 1
Ε3 2015 0.625 0.687 0.910 1
Ε4 2015 0.659 0.667 0.988 7
Ε5 2015 0.507 0.530 0.958 5
Ε6 2015 0.941 1.000 0.941 6
Ε7 2015 0.778 0.778 1.000 1
Table 5. DEA Meta-Frontier Analysis of Vocational High School
DMU Year MP-TE GP-TE TGR(MTR) Ranking
Ε8 2013 1.000 1.000 1.000 1
Ε9 2013 0.569 0.843 0.674 2
Average 0.785 0.922 0.837
Ε8 2014 1.000 1.000 1.000 1
Ε9 2014 0.597 0.903 0.661 2
Average 0.799 0.952 0.831
Ε8 2015 1.000 1.000 1.000 1
Ε9 2015 0.616 0.898 0.686 2
Average 0.808 0.949 0.843
4.2.2. DEA Meta-Frontier Analysis of Vocational High Schools
Table 5 shows the estimation results of GP-TE, MP-TE and TGR or MTR for vocational high schools.
Considering the same technology level (or the same group), technical efficiency can be measured with respect to the group frontier (i.e., GP-TE) The GP-TE can measure the technical level of the same group. As shown in Table 5, vocational high schools with GP-TE values of “1” indicate that these schools have higher efficiency in their group. For example, the GP-TE value of Juang-Jing Vocational High School reached "1" during 2013-2015. In contrast, the GP-TE values of the other four schools are all below “1,” and the gap between the operational efficiencies of vocational high schools can be improved by the schools themselves by further adjusting or improving resource allocation and/or technological changes.
Considering different technology levels, technical efficiency can be measured by estimating the MP-TE. As shown in Table 5, vocational high schools with MP-TE values of “1” indicate that these schools have effectively utilized their resources and do not require any further adjustment or improvement at the current technical level. For example, Juang-Jing Vocational High School achieve a GP-TE value of “1” during the period 2013–2015. In contrast, the MP-TE value of the Hua-Lien Industrial Vocational High School is lower than “1”, which requires further adjustments or improvements in resource utilization and management skills. On average, the MP-TE values of vocational high schools are lower than their GP-TE values.
The technological gap refers to the gap caused by differences in the environmental characteristics/attributes such as technical knowledge, the economic environment, regulations, and society. Therefore, these results can provide suggestions for government agencies and high schools.
Furthermore, TGR or MTR measures the ratio of the output level of the group frontier to the output level of the common frontier based on the current production technology of the group. The TGR or MTR measures how close a group frontier is to the meta-frontier. As shown in
Table 5, Juan-Jing Vocational High School has a higher TGR or MTR than other vocational high schools. This also shows that the technical efficiency level or technological progress of Juan-Jing Vocational High School is higher than that of other schools. However, during 2013-2015, the TGR or MTR values of other vocational high schools are close to 0.837-0.843.
4.2.3. Correlation Analysis of MP-TE, GP-TE and TGR
As indicated in Table 6, we find that the MP-TE and the GP-TE are highly positively correlated, while MP-TE and TGR are moderately positively correlated. In contrast, GP-TE and the TGR have low negative correlations. These negative correlations indicate that the presence of quasi-fixed inputs. Quasi-quasi-fixed inputs are factors of production that cannot be adjusted to equilibrium levels over some periods such as the number of academic departments or full-time teachers in this study.
Table 6. Correlation Results of MP-TE, GP-TE and TGR
All-MP-TE All-GP-TE All-TGR
All-MP-TE 1
All-GP-TE 0.862** 1
All- TGR 0.446* - 0.067* 1
Senior-MP-TE Senior-GP-TE Senior-TGR
Senior-MP-TE 1
Senior-GP-TE 0.862** 1
Senior-TGR 0.228 - 0.009* 1
Vocational -MP-TE Vocational -GP-TE Vocational -TGR
Vocational -MP-TE 1
Vocational -GP-TE 0.968** 1
Vocational-TGR 0.998** 0.949** 1
Table 7. Significance Test and Compare the Efficiencies of Different Groups
Senior High Schools Vocational High Schools
2013 MP-TE 0.749 0.785
2014 MP-TE 0.760 0.799
2015 MP-TE 0.768 0.808
Average 0.765 0.785
χ²-distribution 0.256
Prob. 0.613
2013 GP-TE 0.785 0.922
2014 GP-TE 0.789 0.952
2015 GP-TE 0.825 0.949
Average 0.803 0.941
χ²-distribution 2.329
Prob. 0.127
2013 TGR or MTR 0.955 0.837
2014 TGR or MTR 0.965 0.831
2015 TGR or MTR 0.935 0.843
Average 0.950 0.837
χ²-distribution 3.995***
Prob. 0.047
Note: *p<0.10; **p<0.05; ***p<0.01.
4.2.4. Efficiency Comparisons for Different Groups
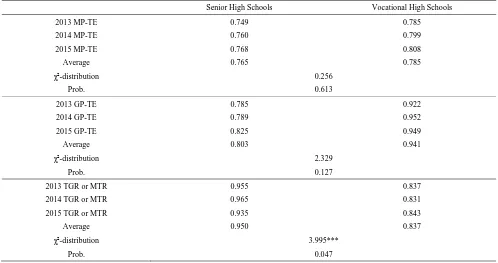
To compare the efficiencies of different groups, we compute the average MP-TE, GP-TE, and TGR or MTR values for each group (senior and vocational high schools) during the period 2013–2015, as reported in Table 7.
As shown in Table 7 and Figure 2, we consider and compare the average MP-TE of each group. The result shows that the average MP-TE value for each group is greater than 0.7 during the period 2013–2015.
The order of the efficiency scores is as follows: vocational high school (0.785) > senior high school (0.749) in 2013, vocational high school (0.799) > senior high school (0.760) in 2014, and vocational high school (0.808) > senior high school (0.768) in 2015. Based on their three-year average efficiency scores, we conclude that vocational high schools (0.785) are more efficient than senior high schools (0.768).
Figure 2. Trend Chart of the MP-TE
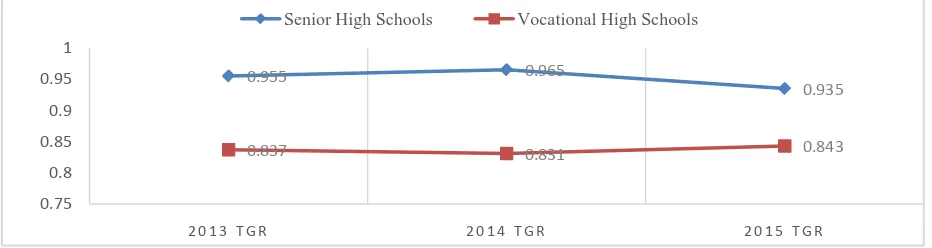
Figure 4. Trend Chart of the TGR
As shown in Table 7 and Figure 3, we compare the average GP-TE of each group. The results show that the average GP-TE for each group is greater than 0.7 during the 2013–2015 period. This means that the average GP-TE values of the groups were different and ranged from 0.785 to 0.952 during the 2013–2015 period. The order of efficiency scores is as follows: vocational high school (0.922) > senior high school (0.785) in 2013, vocational high school (0.952) > senior high school (0.789) in 2014, and vocational high school (0.949) > senior high school (0.825) in 2015. Based on their three-year average efficiency scores, we find that vocational high schools (0.941) are more efficient than senior high schools (0.803). As shown in Table 7 and Figure 4, we further consider and compare the TGR or MTR of each group. TGR or MTR measures the proximity of the group frontier to the meta-frontier, or how close the group frontier is to the meta-frontier. The results show that the average TGR or MTR values of the groups vary greatly from 2013 to 2015, ranging from 0.837 to 0.965. The order of TGR or MTR is as follows: senior high school (0.955) > vocational high school (0.837) in 2013, senior high school (0.965) > vocational high school (0.831) in 2014, and senior high school (0.935) > vocational high school (0.843) in 2015. Based on their three-year average TGR or MTR values, we can conclude that senior high schools (0.950) are more efficient than vocational high school (0.837). For senior high schools, the average value of TGR or MTR is close to 1, which means that, given the current input level, the potential output produced or served by these schools is close to the maximum. The average TGR or MTR value is relatively low for vocational high schools, which means that the existing technology in vocational high school is not at the forefront of meta-technology, and there is more room for improvement in management skills or operational processes.
In order to enhance the persuasiveness of the above empirical results, after detailed empirical data analysis and discussion, we conducted statistical test (i.e., the Kruskal-Wallis test, described in Section 3.3) to check for evidence of significant differences in the operational performance of senior high schools and vocational high schools. Table 5 summarizes the test results, which show that, at the 5% significance level, the two types of schools reject the null hypothesis, indicating that these two types of high schools have different technology gap ratios (TGRs) or meta-technology ratios (MTRs) in 2013, 2014, and 2015. This result represents a confidence level of 95%, signifying the evidence that the operational performance of senior high schools and vocational high schools are due to different
characteristics/attributes. In terms of TGRs or MTRs, senior high schools perform better than vocational schools.
5. Concluding Remarks
This study aims to use the DEA meta-frontier model to evaluate and compare the technical efficiencies and technology gaps of schools with different characteristics / attributes in Taiwan during 2013-2015. This method allows us to consider heterogeneity from a technical level and helps to estimate TGRs or MTRs to compare the relative efficiency and technology gap of selected senior high and vocational high schools.
By comparing the average group technical efficiency scores (GP-TE) for each group, we find that vocational high schools (0.941) are more efficient than senior high schools (0.803). This means that more wastage of the input factors resulted in the senior high school group having lower operational efficiency than the vocational high school group. Comparing the average MP-TE values for each group, we find that vocational high schools (0.785) are more efficient than senior high schools (0.765). It should be noted that the difference in MP-TE scores indicates that the technical efficiency values of the two school groups have significant differences on the common frontier. Additionally, we compare the TGR or MTR values for each group. Based on the three-year average TGR or MTR values, senior high schools (0.950) are more efficient than vocational high schools (0.837). The average TGR or MTR values of senior high schools are close to 1, which means that they produce or serve the approximate maximum potential output at the current input level. A low average TGR or MTR value means that the prior operations of vocational high schools are not close to the frontier of meta-technical possibilities. There is more room for improvement in management skills or operational procedures. Moreover, when government agencies formulate policies for improving the operational efficiency of schools at the different levels (characteristics/attributes) of education or different types of schools, they are required to consider more than just the national conditions and directions of education.
It is worth noting that in our study, for schools with different characteristics / attributes, such as high school and vocational high school, the MP-TE value is lower than the GP-TE value. There is enough evidence that the technical efficiency values of the two school groups are significantly different in the common frontier. In addition, when calculating their respective efficiency values, we
0.955 0.965
0.935
0.837 0.831 0.843
0.75 0.8 0.85 0.9 0.95 1
2 0 1 3 T G R 2 0 1 4 T G R 2 0 1 5 T G R
cannot treat school groups of different technology or know-how levels as the same group.
All in all, the empirical results of this study have, in general, provided additional facts to support or enhance related theories regarding school management efficiencies at different levels of technology. The current study measures technical efficiency based on the data of selected senior and vocational high schools in Taiwan for the period 2013-2015. Future research can extend the study period and include more counties and cities to better understand the trends in regional MP-TE, GP-TE, and TGR or MTR values over time. Although the main research objective is to evaluate and compare the technical efficiencies of senior and vocational high schools, it is also possible to complete the evaluation and comparison of college management efficiency through the methods discussed in this study, and provide relevant implications for school management as well as information about students’ willingness to enroll in colleges that have the best technical and operational efficiencies.
References
[1] Banker, R. D., Charnes, A. and Cooper, W. W. (1984). Some models for estimating technical and scale inefficiencies in data envelopment analysis. Management science, 30(9), 1078-1092.
[2] Battese, G. E., Rao, D. P. and O'donnell, C. J. (2004). A meta-frontier production function for estimation of technical efficiencies and technology gaps for firms operating under different technologies. Journal of productivity analysis, 21(1), 91-103.
[3] Chiang, W. M. (2009). Impact of low birth rate on high school education and recommendations. Secondary Education Monthly, 60(1), 26-34.
[4] Charnes, A., Cooper, W. W. and Rhodes, E. (1978). Measuring the efficiency of decision-making units. European journal of operational research, 2(6), 429-444.
[5] Cooper, W. W., Huang, Z., Li, S. X., Parker, B. R., and Pastor, J. T. (2007). Efficiency aggregation with enhanced Russell measures
in data envelopment analysis. Socio-Economic Planning Sciences, 41(1), 1-21.
[6] Cordero, J. M., Prior, D. and Simancas, R. (2016). A comparison of public and private schools in Spain using robust nonparametric frontier methods. Central European Journal of Operations Research, 24(3), 659-680.
[7] Farrell, M. J. (1957). The measurement of productive efficiency.
Journal of the Royal Statistical Society: Series A (General), 120(3), 253-281.
[8] Fried, H. O., Schmidt, S. S., and Yaisawarng, S. (1999). Incorporating the operating environment into a nonparametric measure of technical efficiency. Journal of productivity Analysis, 12(3), 249-267.
[9] Gao, J. L., and Cai, M. G. (2018). On the obstacles and strategies for the implementation of information technology in the field of science and technology in the national primary and secondary schools in the 12th year of the national education. Taiwan Educational Review Monthly, 7(2), 80-84.
[10] Kritikos, M. N. (2018). A meta-frontier analysis for performance evaluation of public schools in Athens city-center. Journal of Statistics and Management Systems, 21(7), 1251-1272.
[11] Kruskal, W. H. and Wallis, W. A. (1952). Use of ranks in one-criterion variance analysis. Journal of the American statistical Association, 47(260), 583-621.
[12] O’Donnell, C. J., Rao, D. P. and Battese, G. E. (2008). Meta-frontier frameworks for the study of firm-level efficiencies and technology ratios. Empirical economics, 34(2), 231-255.
[13] Ostertagová, E., Ostertag, O. and Kováč, J. (2014). Methodology
and application of the Kruskal-Wallis test. Applied Mechanics and Materials, 611, 115-120.
[14] Portela, M. C. A. S. and Thanassoulis, E. (2001). Decomposing school and school-type efficiency. European journal of operational Research, 132(2), 357-373.
[15] Rao, D. S., O'donnell, C. J. and Battese, G. E. (2003). Meta-frontier functions for the study of inter-regional productivity differences. The Journal of Productivity Analysis, 3, 153-169.
[16] Setirek, A. C. and Tanrikulu, Z. (2015). Significant developmental factors that can affect the sustainability of mobile learning.
Procedia-Social and Behavioral Sciences, 191, 2089-2096.
[17] Thieme, C., Prior, D. and Tortosa-Ausina, E. (2013). A multilevel decomposition of school performance using robust nonparametric frontier techniques. Economics of Education Review, 32, 104-121.
[18] Wongchai, A., Liu, W. B. and Peng, K. C. (2012). DEA meta-frontier analysis on technical efficiency differences of national universities in Thailand. International Journal on New Trends in Education and their implications, 3(4), 30-42.