*Correspondence to Author:
Adam Bush Adam, Faculty of Nat-ural Resources and Environmental Studies, University of Peace, Sudan Tel. +249912659916
How to cite this article:
Sir Elkhatim K. Abbouda, Adam Bush Adam, Mohamed Abdel Mah-moud Elsheikh and Zuhier Yassien Mohamed. Crop Productivity of
Wheat under Different Tillage Sys -tems in Semi-Arid Conditions of Sudan. American Journal of Agri -cultural Research, 2018,3:17.
eSciPub LLC, Houston, TX USA. Website: http://escipub.com/
Sir Elkhatim K. Abbouda et al., AJAR, 2018; 3:17
American Journal of Agricultural Research
(ISSN:2475-2002)
Research Article AJAR (2018), 3:17
Crop Productivity of Wheat under Different Tillage Systems in
Semi-Arid Conditions of Sudan
This study was conducted at Tamboul Testing and Training Cen -tre, Sudan located at 150km south east of Khartoum during two different seasons (1995 -1996) to investigate the response of wheat productivity to different tillage systems on a heavy clay soil in an area of 2.4ha. The treatments were deferent tillage systems (Zero tillage, ridging, shallow harrowing, heavy harrowing, disc ploughing, disc ploughing+harrowing, split ridging and ridging thrice). These treatments were arranged in randomized complete block design (RCBD) with four replications. A computer program (SAS statistical package) was used to analyze the data while the variations among the means were checked by the least signifi -cant difference (LSD).The parameters tested were soil physical properties, crop water requirements (mm/day), plant height (cm), No. of tillering and crop productivity (kg/ha). The results indicated that, tillage systems significantly (P ≤ 0.05) affected clearly soil physical properties. Disc ploughing+harrowing decreased the bulk density (1.3g/cm3) as compared to zero tillage system (1.5g/ cm3). Plant height, tillering and yield significantly (P ≤ 0.05) af -fected by the different tillage systems. Disc ploughing+harrowing gave the highest mean values of plant height (65.83cm), tillering (246) and crop productivity (1305kg/ha) as compared to zero tillage which ranked the least (43.26cm, 202 and 806.8kg/ha, respectively). It is concluded that for increasing the productivity of wheat crop, Disc ploughing+harrowing should be followed and adopted as one of the most important technical packages.
Keywords: Tillage Systems; Physical Properties; Wheat Yield
Sir Elkhatim K. Abbouda1, Adam Bush Adam2*, Mohamed Abdel Mahmoud Elsheikh3 and
Zuhier Yassien Mohamed2
1Department of Agricultural Engineering, Faculty of Agriculture, University of Khartoum, Sudan;
2Department of Agricultural Engineering, Faculty of Natural Resources and Environmental Studies,
University of Peace, Sudan; 3Department of Agricultural Engineering, Faculty of Agricultural Tech -nology and Fish Science, University of Al-Neelain, Sudan
The shortage of water resources worldwide is one of the major limiting factors of agricultural development, which significantly affected the global food security. Agricultural practices conserving soil and water are vitally needed to sustain agricultural production under changing climate (Mert, et. al. 2017). Due to the strong influence of soil moisture on crop yield, management practices caused to increase soil water storage potential are important to be adopted for sustaining crop production in arid and semi-arid regions of the world. In Sudan, tillage systems conserving water in soil are important for plant growth. Mohamed et al. (2017) reported that, tillage systems were affected clearly on soil physical properties; namely bulk density and moisture content and it is necessary to modify environment to create optimum conditions for increasing crop production. Conservation tillage systems are important for crop production because of increasing soil water by reducing evaporation and increasing water infiltration due to crop residues remained on soil surface (Jalota et al., 2006). Zero tillage stored more water at sowing depth and at the end improved grain yield compared to conventional tillage as reported by Fernandez-Garcia et al. (2013). Copec et al. (2015) mentioned that the highest average soil water content was measured under zero tillage compared to conventional system which reduces water infiltration by weakening soil aggregate stability and decreasing macro-porosity and increasing surface crusting. Winter wheat (Triticum aestivum L.) is the most important arable crops in Sudan and the major challenge to production is the enhancing of its productivity and profitability. Wheat production is highly influenced by water availability during the growing season and it is very important to apply a tillage system that helps maintain a favorable soil water regime for optimal crop growth and development. It needs about 10000 m3/ha to produce optimum grain yield as
mentioned by Farah (1995). But, however, saving of water without harming wheat yield
and quality can be achieved, and that varietal response differences of wheat to irrigation regimes exist to fill yield gaps. On the other hand, this volume applied regularly under any tillage practice, not based on type of crop and its state of growth, or any particular criteria may not satisfy actual crop requirements. Moreover, to increase productivity, farmers should be aware of the effects of over-irrigation and that; energy is more expensive, particularly in tillage operations and should be efficiently allocated (Farah, 1995). In Sudan, there were no standard practices as far as irrigation amounts and tillage systems are concerned which resulted on low crop productivity and it represents as one of the major problems that are facing agricultural production. Low crop productivity in addition to high production costs, low prices and high taxes had all resulted in a general deterioration of the agricultural sector. This has contributed in converting agriculture from an attractive business to a repellent activity and caused many farmers to abandon agriculture and migrate to cities (Ministry of Finance and National Economy, 1996). It is evident that, the optimum and economical package of tillage and irrigation quantities for wheat production need to be identified and related factors to be quantified accordingly and processed. Therefore, the objective of this study was to investigate the effect of different tillage systems on crop productivity of winter wheat under semi-arid conditions of Sudan.
2. Materials and Methods:
The experimental work was conducted at Tamboul Testing and Training Centre located at 150km south east of Khartoum during two different seasons (1995 -1996). The soil was classified as heavy clay soil with average bulk density of 1.5 – 1.9g/cm3. The area falls in the
tropical climate usually hot in summer and mild and dry in winter with a noted variation in temperature.
2.1 Experimental Design:
the yield of wheat in an area of 2.4 ha. These treatments were arranged in randomized complete block design (RCBD) with four replications. The treatments included:
1. Zero tillage (control).
2. Ridging.
3. Shallow Disc harrowing.
4. Heavy Disc harrowing.
5. Disc Ploughing.
6. Disc ploughing + harrowing.
7. Split ridging.
8. Ridging thrice.
2.2 Characteristics of tillage implements used:
1. Zero tillage.
2. Ridger: fully tractor mounted on three point linkage, lister type with four units, each unit have two wings and shear and spaced at 80 cm.
3. Shallow disc harrowing.
4. Heavy disc harrowing.
5. Disc plough: fully tractor mounted on three point linkage, standard type with three discs each 66cm in diameter and 63 cm cutting width with 21.3 cm ploughing depth.
6. Disc harrow: fully tractor mounted on three point linkage with 10 discs each 56 cm in diameter, 180 cm cutting width with 6.6 ploughing depth.
7. Split ridging: fully tractor mounted on three point linkage.
8. Ridging thrice fully tractor mounted on three point linkage
The machines and implements used in the experiment were:
a. A fully mounted standard, Baladan 3 bottoms disc plough. The diameter of blade is 71cm. b. A trailed Baladan disc harrow with two gangs
(six disc per gang, 60 cm in diameter).
c. A fully mounted Baladan heavy duty disc harrow. The numbers of disc blades were 24 and 71cm in diameter.
d. A four bodies, Ransome ridger with 80cm spaced between ridging bottoms.
e. A fully mounted scraper was used as leveler. f. Renault 751 (75hp) and Belarus MTZ 380
(80hp) tractors were used to perform all tillage operations.
2.3 Crop water requirements:
Irrigation water amounts were calculated according to crop water requirement (ETc). It is
generally related to reference
evapotranspiration (ETo) which is calculated from meteorological data using Penman Monteith equation as stated by Smith et al. (1998).
ETo=
...
...
...
...
...
..(
1
)
)
34
.
0
1
(
)
(
273
900
)
(
408
.
0
2 2
U
ea
es
U
T
G
Rn
Where:
ETo= Reference crop evapotranspiration (mm day-1)
Rn = Net radiation at crop surface (Mjm-2day-1)
T = Average temperature at 2m height (oc).
es = Svp, kPa ea = Actual vp (kPa)
(es –ea) = Saturation pressure deficit for
measurement at 2m height (kPa). U2 = Wind speed at 2m height (ms-1).
Δ = Slope of vapor pressure curve (k Pa oc).
γ = Psychometric constant (k Pa oc)
900 = Coefficient for reference crop (kj Kg day -1)
0.34 = Wind coefficient for the reference crop (sm-1)
G = Soil heat flux (Mj m-2 day-1)
Irrigation water amounts were measured using a V-notch 90o weir. The discharge over the weir
was calculated using the following equation as stated by Michael (1978).
Q = 0.0138 H5/2 ……….(2)
Q = discharge over the weir in l/s. H = the head over the weir in cm.
2.4 Measurement of rainfall:
Daily rainfall was measured using the standard ordinary rain gauge exposed 1 m above ground level away from buildings and trees. The diameter of the standard gauge is 5 inches (12.7 cm). There was a measuring Jar calibrated to read the rainfall in mm this Jar should only be used with 5in diameter rain gage. A recording rain gauge was used to give a continuous record of rainfall, this type of rain gauges is very important because it gives the intensity of rainfall (Adam, 2014).
2.4.1 Effective rainfall:
Effective rainfall is defined as the fraction of rainfall that is effectively intercepted by the vegetation or stored in root zone and used by the plant-soil system for evapotranspiration. It can be estimated by the following equation mentioned by Adam (2014):
Pef = E * Ptot + A ………. (3) Where:
Pef = Effective rainfall over the growing season. E = Ratio of consumptive use of water (cubic) to Ptot. 65.
Ptot = Total rainfall over the growing season. A = Average irrigation application.
2.5 Infiltration rate (mm/h):
Double ring cylinder infiltrometers were used to calculate infiltration rates. The diameter of the inner cylinder from which the infiltration measurements were taken was 28cm and the outer cylinder was 60cm. the height of both cylinders was 25cm.The cylinders were installed at 10cm depth in the soil. Care was taken to keep the installation depth of the cylinders the same in all the experiments. A graduated measuring cylinder (one litre) was used for measuring the water added at each time. Water was poured gently into the inner cylinder during the first filling through a polythene sheet to minimize disturbing the soil. After pouring the water, the sheet was then
removed gently. The space between outer and inner cylinders was filled immediately with water so as to act as a buffer area. A stop-watch was used to note the time taken for each applied liter of water to disappear in the soil as mentioned by Michael (1978).
2.6 Bulk density (g/cm3):
Bulk density was measured using the cylinder method (Johnson, 1945) as shown in the following equation:
Bulk density = ……… (4)
Moisture content on mass basis was determined using the gravimetric method as stated by Michael (1978) as follows:
Ød = Øm% * pb ……….. (5) Where:
Ød = moisture content on depth basis cm/m. Øm% = moisture content on mass basis. Pb = bulk density g/cm3.
2.7 Plant height:
Ten plants were randomly selected to represent the experimental area. Plant height was measured after emergence using a metre stick then the average plant height was recorded.
2.8 Tillering:
1m2 was randomly selected at the central area
of each experimental plot. The number of tillers was taken and recorded.
2.9 Final yield (kg/ha):
The harvesting started when signs of maturity were observed, the back of the head turned from green to yellow. Harvesting was done manually using sickles and the crop was arranged in heaps and left for one week, then fed to a stationary thresher for threshing. The grains from each plot were collected, weighed and final yield was expressed in kg/ha.
3. Results and discussion:
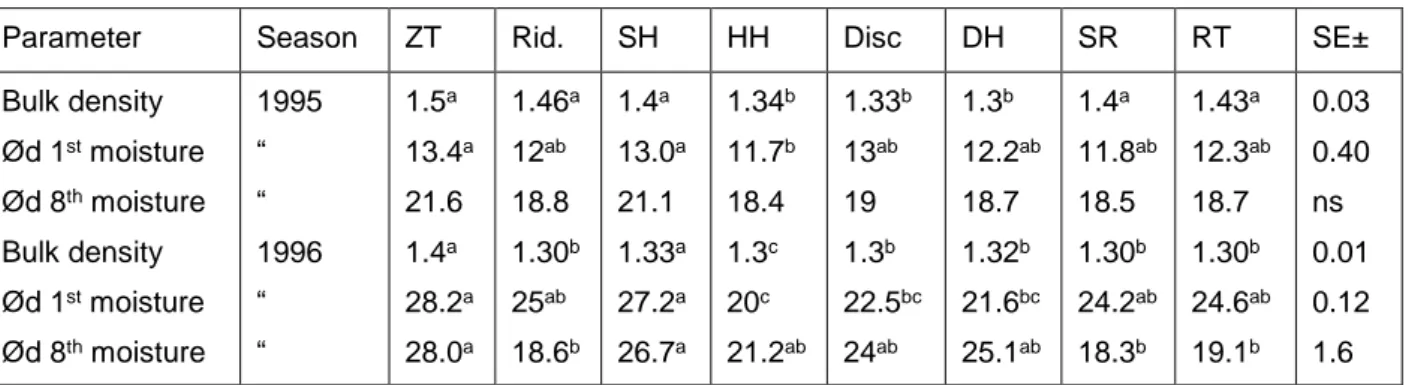
tillage. These results may be due to the mixing of the different particles size which resulted in greater pore space and hence decreased the bulk density as presented in disc ploughing + harrowing system. The results also indicated that zero tillage system recorded the highest moisture content (cm/m) as compared to other treatments. The higher moisture content under zero tillage system might be attributed to the dominance of micropores and the uncovered fissures in the zero tillage soil profile as mentioned by Copec et al. (2015). Disc ploughing + harrowing recorded the highest initial infiltration rate followed by ridging thrice, disc ploughing only, split ridging and finally heavy harrowing tillage systems. These results agreed with the result obtained by Mohamed et al. (2017) who reported that, different tillage systems had different effects on soil physical properties such as bulk density and moisture content and the bulk density decreased using deep ploughing system as compared to no till system.
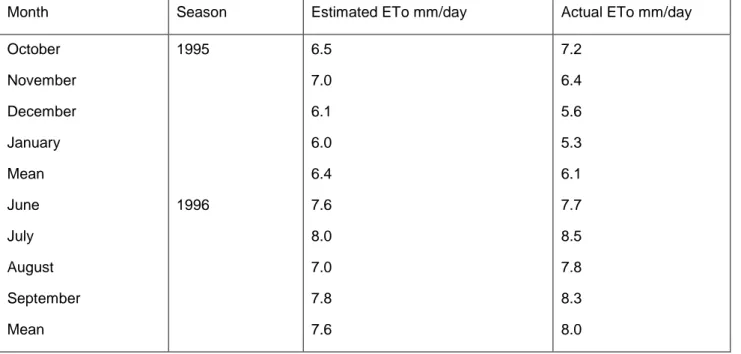
Table 2. shows the estimated and actual crop evapotranspiration in the two seasons. The variation between the estimated and actual ETo within the two seasons was found 5% on the winter season and 7% on the summer season. These variations may be attributed to the changes in at the recent years. While the variations on crop water requirements between summer and winter seasons are due to the differences on seasonal climatic conditions e.g. mean temperature, relative humidity, sunshine,
...etc. The results agreed with the result obtained by Adam (2014) who reported that water shortage and water productivity significantly affected by the climate change especially in arid and semi-arid regions. The amount of water increased as irrigation decreased up to the 5th irrigation then
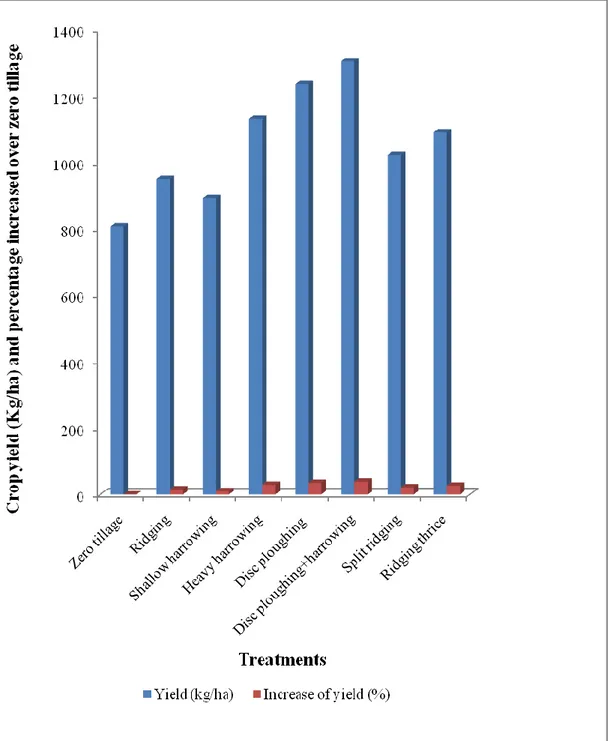
decreased in final stages of the crop development. These may be due to the changes in the crop factor (kc) which increased during the development stage and decreased at the initial and maturity stages. The use of crop water requirement technique resulted on saving the amount of water applied at the winter season by 13.2% compared with the summer season. The results were in line with result obtained by Mohamed et al. (2017) who reported that tillage systems and irrigation water amount are necessary to create optimum conditions for increasing crop production. As presented in Table 3 and Fig. 1 Growth parameters of wheat crop significantly (P ≤ 0.05) affected by the different tillage operations. Disc ploughing + harrowing gave the tallest plant height, no. of tillering and the highest crop yield as compared to zero tillage which ranked the least. The superiority of discing + harrowing over zero tillage may be attributed to the good uniformity of water distribution in that plot and improvement of soil aeration conditions and moisture status and good control of weeds which led to good crop stand as stated by Guirgius et al. (2015).
Table 1. Effect of different tillage systems on bulk density g/cm3 and moisture content
cm/m after three days from 1st and 8th irrigation for two seasons
Parameter Season ZT Rid. SH HH Disc DH SR RT SE±
Bulk density
Ød 1st moisture
Ød 8th moisture
Bulk density
Ød 1st moisture
Ød 8th moisture
Means with the same letter (s) within a row are not significantly differences at (P ≤ 0.05) according to DMRT. Where: ZT = Zero tillage (control). Rid. = Ridging. SH = Shallow
harrowing. HH = Heavy harrowing. Disc = Disc ploughing. DH = Disc ploughing + harrowing. SR = Split ridging. RT = Ridging thrice.
Table 2. Actual ETo using Penman Monteith equation as stated by Smith et al.(1998) and histological metrological data (1990 to 1995) for the 1995 and 1996
Month Season Estimated ETo mm/day Actual ETo mm/day
October
November
December
January
Mean
June
July
August
September
Mean
1995
1996
6.5
7.0
6.1
6.0
6.4
7.6
8.0
7.0
7.8
7.6
7.2
6.4
5.6
5.3
6.1
7.7
8.5
7.8
8.3
8.0
Table 3. Effect of different tillage systems on plant height, tillering and yield of wheat over zero tillage
Treatment Plant height (cm) No. of tillering/m2 Yield (kg/ha) Increase of yield (%)
Zero tillage
Ridging
Shallow harrowing
Heavy harrowing
Disc ploughing
Disc ploughing+harrowing
Split ridging
Ridging thrice
LSD
43.26c
43.33c
42.39c
52.57b
64.21a
65.83a
62.74a
62.17a
5.57
202.3 c
207.4 c
225.3 b
229.0 b
241.1 a
246.3 a
238.6 a
238.6 a
11.58
806.8 d
950.3 c
893.2 c
1131 b
1236 a
1305 a
1022 b
1091 b
84.5
-
15.1
9.7
28.7
34.7
38.2
21.1
26.0
-
Fig. 1 Effect of different tillage operations on yield and yield percentage over zero tillage
4. Conclusion:
Tillage package composed of disc ploughing + harrowing was the most superior over the other treatments and significantly increased the yield and yield components over zero tillage system.
5. References
1 Adam, H.S. (2014). Agroclimatology, Crop Water Requirement and Water Management. Water Management and Irrigation Institute, University of Gezira Book. 2nd Edition. University of Gezira
Press.
2 Copec, K.; Filipovic, D.; Husnjak, S.; Kovacev, I. and Kosutic, S. (2015). Effects of tillage systems on soil water content and yield in maize and
winter wheat production, Plant, Soil and Environment, 61(5) (2015), 213–219.
3 Farah, S.M. (1995). Water Relations and Water Requirements of Wheat. Pages 125-147, In: Wheat Production and Improvement in the Sudan. O.A. Ageeb; A.B. El Ahmadi; M.B. Solh and M.C. Saxena (eds.), ARC - Sudan, ICARDA Syria, and DGIS-The Netherlands.
4 Fernandez-Garcia, P.; Lopez-Bellido, G. and Munoz-Romero, V. (2013). Chickpea water use efficiency as affected by tillage in rainfed Mediterranean conditions. Agricultural Water Management, 129:194–199.
response to furrow irrigation inflow rate and tillage system. Misr J. Agric. Eng., 25(1): 38-57.
6 Jalota, S.K.; Arora, V.K. and Singh, O. (2006). Development and evaluation of a soil water evaporation model to assess the effects of soil texture, tillage and crop residue management under field conditions, Soil Use and Management, 16:194–199.
7 Johnson, J.R. (1945). An accurate method for determining volume of soil clod. J. of soil sciences 59:449-453.
8 Mert, A.; Ismail, C. and Hikmet, G. (2017). Effects of long-term tillage systems on soil water content and wheat yield under mediterranean conditions. Journal of New Theory, 17:98-108.
9 Michael, A.M. (1978). Irrigation theory and practices. VIKAS Publishing House. LTD Newdelhe.
10 Ministry of Finance and National Economy (1996) .The economic overview, Sudan Government, Khartoum.
11 Mohamed, A.E.; Bush, A.A. and Mohamed, Z.Y. (2017). Effect of Irrigation Quantities and Tillage Systems on Sunflower Yield under Khartoum State Conditions, Sudan. International Research Journal of Agricultural Science and Soil Science. Vol. 7(1) Pp. 001-007.