Seasonal Influences on Milk Yield and Composition
Dynamics during a Normal Lactation in Dairy Cows: Milk
Yield, Fat and Protein Precentage
Simona Baul
1,*, Ludovic-Toma Cziszter
1, Stelian Acatincai
1, Dinu Gavojdian
2, Silvia Erina
1,
Adela Marcu
1, Genoveva Buzamat
1, Gabriel George R
ă
ducan
11
Faculty of Animal Science and Biotechnologies, Banat University of Agricultural Sciences and Veterinary Medicine, 300645, Timisoara, Romania
2
Research and Development Station for Sheep and Goats of the Romanian Academy for Agricultural Sciences and Forestry, 325400, Caransebes, Romania
Abstract
Researches were made on 125 lactations from Romanian Black Spotted cows and aimed to study the evolution of the interval between calving on milk yield and quality. Data were recorded and statistically analyzed by means of ANOVA / MANOVA determining the average values and dispersion indices. Based on averages parameters of lactation curves were calculated using the mathematical model called the incomplete gamma function. Cows that calved in winter and spring had steeper lactation curves for milk yield. The lactation curve for butter-fat percentage was significantly different (p<0.05) between summer-winter and summer-autumn seasons. Evolution of the lactation curve for protein percentage was significantly different (p<0.05) between winter and spring, distinct significant (p<0.01) between summer-autumn, winter-autumn and very significant (p<0.001) between spring and autumn.
Keywords: calving season; dairy cows; milk yield; proteins; Romanian Black and White Spotted breed.
1. Introduction
From researches conducted by Stanciu et al. [1], on Romanian Black and White Spotted breed reared in western Romania, results showed that cows which calved in summer had on average on normal lactations a lower milk production compared to those that have calved in the other seasons.
Season of calving affects milk production, both through the feeding regime and through the level of feeding, as well as by climatic factors. In temperate climates, cow which calve in late fall and early winter achieved higher production of milk per lactation than those who give birth in spring or in summer [2].
* Corresponding author: Baul Simona, Tel 0040-256
Season of calving influences the percentage of milk fat [3]. The highest fat percentage in dairy cows is registered in those which calve in winter, drops in cows which are calving in May and reach the lowest value in cows which are calving in July and August, and then again begin to grow.
Differences in the average percentage of milk fat in cows when calving in different seasons can be 0.2-0.4 %. Highest values of the fat percentage and thus the total dry matter from milk, in cows when calving in autumn and winter, is recorded in temperate climates and are caused by humidity, ambient temperature and other factors, including the type and level of feeding [4].
2. Materials and methods
The study was conducted at the Didactical Station of the Banat University of Agricultural Sciences and Veterinary Medicine from Timisoara, on cows from the Romanian Black and White Spotted breed, using data from a number of 125 lactations. Data were recorded and statistically analyzed by the method ANOVA/ MANOVA, determining the average values and dispersion indices.
Based on the obtained data, the average milking curves parameters were calculated using the mathematical model first proposed by Wood [5], called incomplete gamma function.
3. Results and discussion
Among the environmental factors, the greatest influence on the appearance of the lactation curve it is calving season through ration structure . If for winter births the constancy of the lactation curve is higher, sometimes appearing lactation curves with two peaks [2].
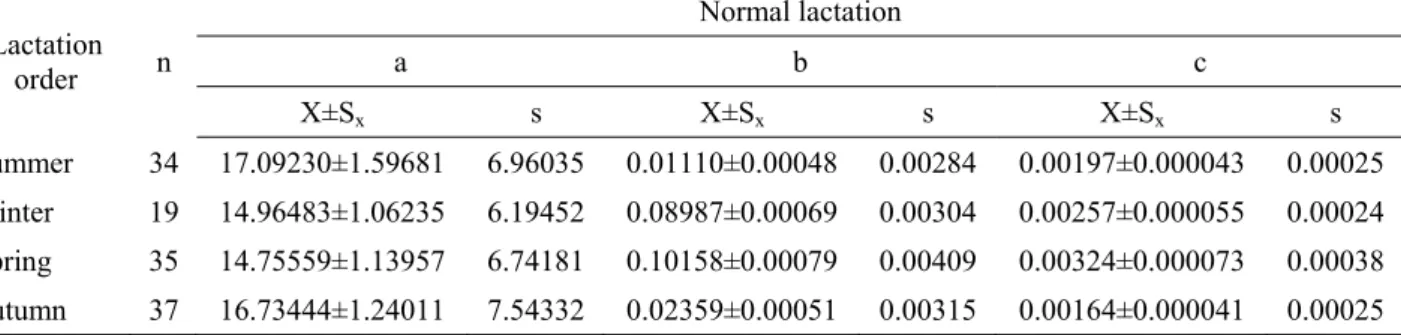
Table 1 presents the average values and dispersion indices for incomplete gamma function parameters to the daily amount of milk per normal lactation, based on the season of calving.
The amount of milk on the first day of control (parameter a) was the lowest in cows which calved in spring, 14.75 kg, followed by cows that calved in winter, 14.96 kg. Highest initial quantity of milk was achieved by cows which calved in summer, 17.09 kg of milk, followed by cows that calved in autumn, registering an amount of 16.73 kg milk.
Growth rate of daily milk production (parameter b) had the lowest value (0.011 kg) from cows that calved in summer and 0,023 kg in autumn calved cows. The value of this parameter is obtained from cows that have calved in spring, ie 0.101 kg. The values of the parameter b describing the rate of increase of the quantity of milk until reaching lactation curve peak, the cow calved in winter (0.089 kg) and which the spring calving (0.101 kg) had similar values.
The daily rate of decrease of milk (parameter c) had the lowest values in cows that calved in autumn, only 0.00164 kg, rising to a value of 0.00197 kg in cows that calved in summer. The highest rate of decrease in the quantity of daily milk after reaching peak lactation curve was
obtained from cows that have calved in spring, being 0.00324 kg.
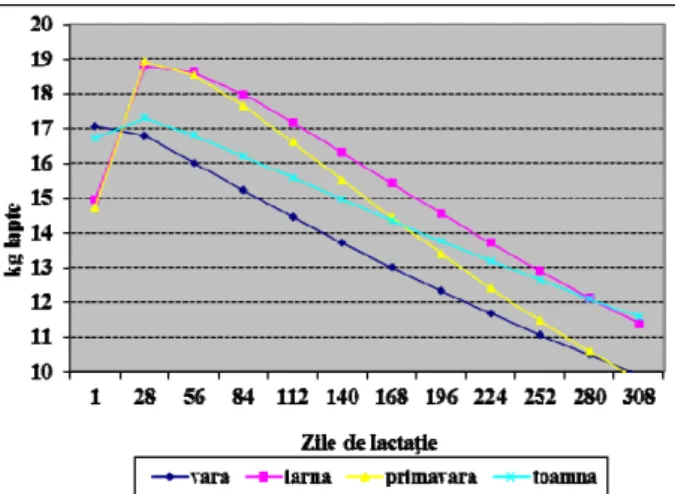
Variation of Wood's function parameters from season to season results in obtaining lactation curves with different aspect in relation to calving season. Thus, in Figure 1, it appears that cows which calved in winter and spring had a lactation curve with a sharp increase in the first month of lactation compared to cows that calved in summer where appearance lactation curve is downward to weaning, and those that have calved in the fall slightly in the first month of lactation and then decreases slowly until the end of lactation.
Cows that calved in summer achieved the highest daily amount of milk to 6 days after birth, of 17.23 kg, after which the atypical production declines until weaning (9.91 kg). Similarly, for cows which calved in autumn, the lactation curve peaks early, 14 days after calving when produced 17,40 kg milk/day, after which the amount gradually decreases until weaning (11.56 kg).
Table 2 presents the average values and dispersion indices for incomplete gamma function parameters to the percentage of fat per day depending on the season on normal lactation.
The percentage of fat in the first day of control (parameter a) was lower in cows that calved in summer and spring averaging 4.27 %, followed by autumn calved cows that fat percentage was the 4 78%, the highest value being 5.15% for cows that calved in winter.
The rate of decline in the percentage of fat daily (parameter b) was maximum at autumn calved cows (-0.056%), gradually decreases from cows that calved in winter value being -0.044%.
for the percentage of protein per day for normal lactation.
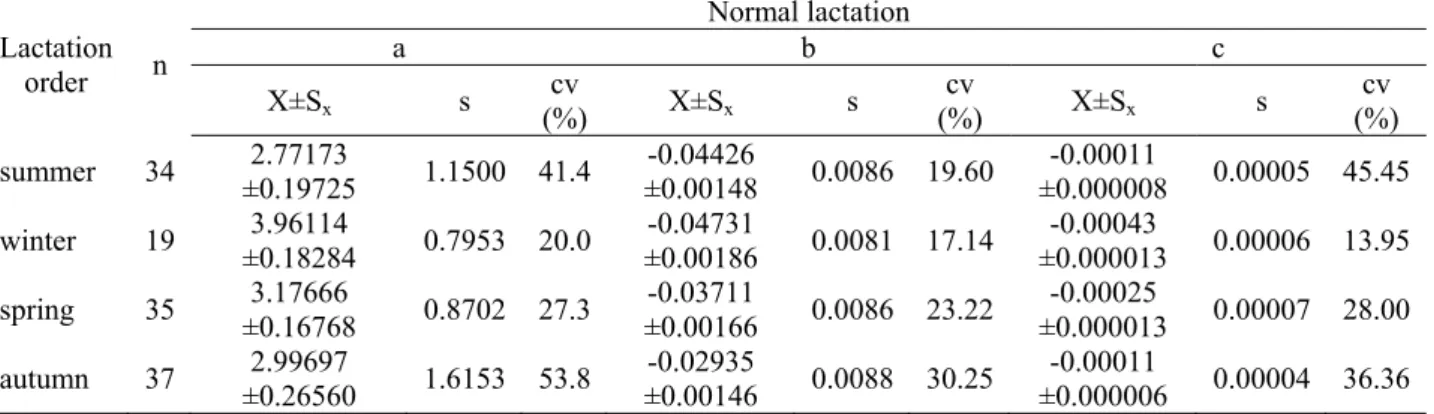
The percentage of protein in the control day (parameter a) was lower in cows that calved in summer 2.77 %, followed by cows that calved in autumn when protein percentage value was of 2.99 %. Averages for cows that calved in spring increased to the value of 3.17 %, reaching a maximum of 3.96 % in cows that calved in winter. The rate of decline in the percentage of daily protein (parameter b) had the maximum from cows that calved in winter ( -0.047 %), decreased slightly from cows that calved in summer ( -0.044 % ) and in those that calved in spring, when value percentage of protein was of -0.037 %, reaching the lowest value in cows that calved in autumn, -0.0029 %. The daily rate of increase in the percentage of protein (parameter c) was the lowest in cows that calved in summer and autumn ( -0.00011 %). The highest rate of increase in the percentage of protein was obtained from cows that calved in winter (-0.00043 %).
In Figure 3, is observed the evolution of the percentage of milk protein by normal lactation. Using Wood's function parameters change from one season to another resulted in flatter lactation curves for protein percentage. In all seasons, the
protein content of the milk was high at the beginning of lactation and then decreased to a minimum, then to increase continuously until the end of lactation.
Table 4 presents the differences and statistical significance for the evolution of incomplete gamma function parameters of milk and milk chemical components in cows studied. From the table it can be seen that between the examined parameters were no significant differences (p < 0.05) for the evolution of the daily quantity of milk (parameter a) between first and lactation 3 (-4.39805 kg) , daily growth rate (parameter b) of the milk was no significant difference (p < 0.05) between the lactation 1 and 3 (-0.07683 kg) and daily loss rate (parameter c) the amount of milk were no significant differences (p < 0.01) between lactation 1 and lactation 3 (-0.00254). There were significant differences (p < 0.05) for the rate of decline in milk production between lactation 2 and lactation 3 (-0.00093 kg). In addition, there were significant differences (p < 0.05) for the growth rate per day lactation of milk from 3 to 5 and over lactation (0.02134 kg) and the daily rate of decrease in milk production is the difference 0.00045 kg.
Table 1. Averages and dispersion indices for the incomplete gamma equation parameters for the daily milk production (kg) on normal lactation based on calving season of the Romanian Black and White cows
Lactation
order n
Normal lactation
a b c
X±Sx s X±Sx s X±Sx s
summer 34 17.09230±1.59681 6.96035 0.01110±0.00048 0.00284 0.00197±0.000043 0.00025 winter 19 14.96483±1.06235 6.19452 0.08987±0.00069 0.00304 0.00257±0.000055 0.00024 spring 35 14.75559±1.13957 6.74181 0.10158±0.00079 0.00409 0.00324±0.000073 0.00038 autumn 37 16.73444±1.24011 7.54332 0.02359±0.00051 0.00315 0.00164±0.000041 0.00025
Table 2. Averages and dispersion indices for the incomplete gamma equation parameters for the daily fat percent on normal lactation based on calving season of the Romanian Black and White cows
Lactation
order n
Normal lactation
a b c
X±Sx s X±Sx s X±Sx s
summer 34 4.28778±0.42542 2.48020
-0.03213±0.02557 0.01491 -0.00039±0.000021 0.00124
winter 19 5.15577±0.25701 1.12027
-0.04470±0.01758 0.00766 -0.00030±0.000001 0.00005
spring 35 4.26060±0.47401 2.46012
-0.00862±0.00036 0.00191 -0.00033±0.000027 0.00014
autumn 37 4.78968±0.37475 2.27949
Table 3. Averages and dispersion indices for the incomplete gamma equation parameters for the daily protein percent on normal lactation based on calving season of the Romanian Black and White cows
Lactation order n
Normal lactation
a b c
X±Sx s (%) cv X±Sx s (%) cv X±Sx s (%) cv
summer 34 ±0.19725 2.77173 1.1500 41.4 ±0.00148 -0.04426 0.0086 19.60 ±0.000008 -0.00011 0.00005 45.45
winter 19 ±0.18284 3.96114 0.7953 20.0 ±0.00186 -0.04731 0.0081 17.14 ±0.000013 -0.00043 0.00006 13.95
spring 35 ±0.16768 3.17666 0.8702 27.3 ±0.00166 -0.03711 0.0086 23.22 ±0.000013 -0.00025 0.00007 28.00
autumn 37 ±0.26560 2.99697 1.6153 53.8 ±0.00146 -0.02935 0.0088 30.25 ±0.000006 -0.00011 0.00004 36.36
Table 4. Differences and their significance for the incomplete gamma equation parameters for daily evolution of milk quantity and chemical components during lactation based on age of cows
Trait Lactation order Parameter Lactation order
5 and higher 4 3 2
Mi
lk
yi
el
d (k
g)
1 a ns ns b ns ns -4.39805* -0.07683* ns ns
c ns ns -0.00254** ns
2
a ns ns ns - b ns ns ns -
c ns ns -0.00093* -
3 a ns ns - - b 0.02134* ns - -
c 0.00045* ns - -
4
a ns - - - b ns - - - c ns - - -
Fat p
ercen
tag
e
1 a ns ns ns ns b ns ns ns ns
c ns ns ns ns
2 a ns ns ns - b 0.05111* ns ns -
c 0.00032* ns ns -
3 a ns ns - - b ns ns - -
c ns ns - -
4
a -0.86594* - - -
b 0.00914* - - -
c -0.00008* - - -
Prot
ei
n perce
nt
age
1 a ns ns ns ns
b ns ns ns ns c ns ns ns ns
2 a -0.37199* ns ns -
b ns -0.00808* ns -
c -0.00003* -0.00020* ns -
3 a ns ns - -
b ns -0.01985* - -
c ns -0.00037* - -
4 a ns - - -
Figure 1. Evolution of the milk yield during the normal lactation according to the calving season of Romanian
Black and White cows
Figure 2. Evolution of milk fat percentage during the normal lactation according to the calving season of
Romanian Black and White cows
Figure 3. Evolution of the milk proteins percentage during the normal lactation according to the calving
season of Romanian Black and White cows
For the evolution of the percentage of fat obtained and significant differences (p < 0.05), the percentage of the daily rate of fat loss (parameter b) between second and fifth lactation and above (0.05111 %), and the daily rate the increase in the percentage of fat (parameter c) are significant differences (p < 0.05) between 2 and lactation 5 (0.00032 %). Between 4 lactation and lactation 5 and over, the percentage of fat daily evolution (parameter a) values were significant (p < 0.05), at a difference of -0.8659.
The rate of decrease in the percentage of daily fat significant differences (p < 0.05) between the lactation 4 and 5 and over was observed. Also between the lactation were no significant differences (p < 0.05) the rate of increase of the percentage of fat per day, the amount being -0.00008 %.
The evolution of the percentage of protein daily were significant differences (p < 0.05) between lactation 2 and lactation 4 (-0.00808 %) rate of decline in the percentage of protein and the growth rate of the percentage of protein (0.00020 %). Lactation, between 2 and 5 and above, there were significant differences (p < 0.05) the percentage of protein, the difference being -0.37199 %. There are significant differences (p < 0.05) between the lactation 3 and 4 for lactation daily loss rate (-0.01985 %) and daily growth rate (-0.00037 %) in the percentage of protein.
4. Conclusions
► Season of calving significantly influenced (p 0.05) the aspect of the lactation curve for milk daily amount, and changed the fat and protein evolution during lactation.
► Cows that calved during winter and spring had lactation curves for milk quantity sharper, registered an increase of the daily amount of milk in the first month of lactation, and then begin to decline until the end of lactation. Cows that calved in summer had a lactation curve decreasing until the end of lactation.
► Lactation curve for fat percentage was significantly different (p 0.05) between summer - winter seasons and summer - autumns. Fat percentage had maximum values at calving, decreases sharply in the first two months of lactation and begins to increase slightly towards the end of lactation.
References
[1] Stanciu, G., Cziszter, L.T., Acatincăi, S., Contribuţii la cunoaşterea unor factori care influenţează aspectul curbei de lactaţie la vacile din rasa Bălţată românească, 1996, Simpozion ştiinţific internaţional de zootehnie, 13 decembrie Iaşi
[2] Stanciu, G., Tehnologia creşterii bovinelor, Ed. Brumar, 1999, pp. 125-130
[3] Cziszter, L.T., Dirijarea funcţiei glandei mamare, Ed. Eurostampa, 2003, pp. 130-133
[4] Acatincai, S., Tehnologia cresterii bovinelor, Ed. Agroprint, 2010, pp. 77-83