RESEARCH
Obesity is a major public health problem in developed countries and is fast becoming a growing threat to human health in developing
nations.[1] In recent years, it has been established that several chronic
diseases of lifestyle (CDLs) typically reported for adults in Western countries, such as diabetes, cardiovascular diseases (CVD) and hypertension, can also be observed in children and are frequently associated with body weight disorders such as underweight,
overweight and obesity.[2] The current US statistics published by
the National Health and Nutrition Examination Survey (NHANES) reported 21.5% overweight and 10.4% obesity among 2 - 5-year-olds.
[2] In addition, increases in this condition were reported in the same
age group in Europe[3] and Australia.[4] However, obesity is not only
a problem in developed nations, but is rapidly becoming a public health concern in countries undergoing the nutrition transition,
such as Thailand, Chile and South Africa (SA),[5-7] to such an extent
that the situation has been declared a global epidemic by the World
Health Organization (WHO).[1] The WHO[8] views obesity as an
independent risk factor for CVD, which significantly increases the risk of morbidity and mortality.
In Africa, the menace of CVDs has now become a serious health issue. In particular, sub-Saharan Africa has seen a tremendous increase in CVD risk factors, which has caused many deaths in both young and
older persons.[9] SA is one of the countries in the sub-Saharan region
of Africa undergoing a nutritional transition, in terms of changes in the dietary profile of the human population as a result of a shift from a traditional to a Western diet. Such a transition determines the
nutritional status of the overall population.[10-11] Although obesity and
CMD seem less life-threatening during childhood, their risk factors are particularly prevalent in the country and are progressing at a rapid pace. The prevalence of obesity and CMD has been partly attributed to the increase in urbanisation, industrialisation and adoption of a Western lifestyle, which negatively affect the quality of lives of many
South Africans.[5,12] According to the American Heart Association,[13]
CDLs are strongly and closely related to obesity and CMD risks, and
strong evidence exists that elevated cholesterol levels in childhood
may play a role in the development of hypertension later in life.[14] In
addition, poor dietary intake and physical inactivity,[15-17] along with
excessive body fat,[18-20] adversely affect CMD risks. These habits are
often established during childhood,[8] thus allowing overweight and
obesity to reach epidemic proportions in many countries.
Popkin et al.[21] highlightthe high global prevalence of overweight
and obesity among children and adolescents, particularly in urban areas and among girls: 9% and 27% in 15 - 17-year-old boys and girls, and 10% and 23% in boys and girls aged 10 - 14 years old, respectively. These trends have been supported by other national
and regional studies,[10,11] which also showed an increased prevalence
of obesity. In a recent SA survey published by Awotidebe et al.,[22]
an indication of 8.7% pre-hypertensive and 4.3% hypertensive children was also reported. The findings of these surveys seem to warn against the potential health crises which could result given the increased incidence of childhood overweight, excessive body fat and abdominal adiposity as they are likely to add to the enormous socio-economic and public health burden in future. Therefore, these trends should be closely monitored and prioritised in the face of all other health needs in the country.
Despite the fact that research reports overwhelmingly support the association between bodyweight disorders, such as underweight,
overweight and obesity, with CMD,[12] regional comparisons among
children in the SA context are problematic, in view of the different criteria used to evaluate the anthropometric and CMD variables
among the children in the various studies.[22-24] A number of studies
have also determined the correlation of different anthropometric indices with obesity and CMD risk factors among children in
developed countries.[3,4] The results of such studies have been
based on a number of criteria derived from the Childhood Obesity Working Group of the International Obesity Task Force (COWG/
IOTF) age- and sex-specific BMI cut-off point,[25] the Centers for
Disease Control and Prevention BMI-dependent cut-off point of the Background. Obesity is a major public health problem in developed countries, and is also a growing concern in developing nations. This study assessed the predictors of overweight and obesity in South African (SA) children and adolescents, and examined the extent to which these dependent measures correlate with cardiometabolic disease (CMD) risk.
Objectives. To assess the predictors of overweight and obesity in SA children and adolescents.
Methods. A total of 1 361 (boys, n=678; girls, n=683) children aged 9 - 11 (boys, n=455; girls, n=411) and adolescents aged ≥12 - 13 (boys,
n=288; girls n= 267) participated in the study. The children’s anthropometric and physiological measurements were taken. Body mass index
(BMI) was calculated and used to classify the children as underweight, of normal weight overweight or obese, as well as to screen them for CMD risk.
Results. Findings indicated that 81.2%, 17.4%, 0.9 and 0.5% of the children (<12 years old) were underweight, of normal weight, overweight, and obese, respectively. For adolescents (12 - 13 years old), 63.0%, 32.5%, 3.4% and 1.0% were underweight, of normal weight, overweight and obese, respectively. Provincial analysis of the results showed that the likelihood of a girl in Mpumalanga Province becoming overweight or obese was 0.33 times that of a female child in Limpopo Province.
Conclusion. Periodic assessment of predictors of obesity and CMD disease risk in SA children is necessary. Intervention and prevention
strategies are also needed to curb the rising tendency of CMD risk among the youths.
S Afr J Child Health 2017;11(4):186-191. DOI:10.7196/SAJCH.2017.v11i4.1331
Predictors of obesity and cardiometabolic disease
risk in South African children
V K Moselakgomo, PhD; M Van Staden, PhD
Department of Physiology and Environmental Health, School of Molecular and Life Sciences, University of Limpopo, Sovenga, South Africa
Corresponding author: V K Moselakgomo ([email protected])
RESEARCH
upper 5th percentile, developed by Must and Strauss[26] based on the
US NHANES and the standards suggested by the WHO/US National Center for Health Statistics. These studies used both percentile norms by age and gender and cut-off points to classify children as underweight, normal, overweight or obese.
Although these references proved to be good indicators of adverse
health outcomes in developed countries,[27-29] the trends are, however,
difficult to quantify, in view of the existence of a wide variety of definitions of childhood obesity. Moreover, little is known about the health consequences of bodyweight disorders among SA children. Consequently, studies evaluating associations between health outcomes and bodyweight categories defined by different sets of cut-off points are needed to inform the decision on which method best assesses the risk. Therefore, in this study, the age- and sex-specific
BMI cut-off point developed by Cole et al.,[25] for COWG/IOTF was
used to assess the risk factors of obesity and CMD in SA children. The rationale for the use of IOTF classification is that it has been, firstly, recommended internationally as a screening rather than a diagnostic tool for paediatric obesity. Secondly, the IOTF criteria correlate with total body fat and CMD risk factors. Thirdly, the definition is less haphazard and more internationally acceptable than others, and should encourage direct comparison of trends in childhood obesity worldwide. Nevertheless, definitions of the interaction effects for phenotypes related to obesity and CMD are important because they have the potential to screen and identify children at risk, detect early development of complications and recognise those that are likely to be resistant to health-related interventions.
Therefore, the objectives of this study were to assess the predictors of overweight and obesity in SA children and adolescents, and examine the extent to which these dependent measures correlate with CMD risk.
Methods
Ethical considerations
The Health Sciences Research Ethics Committee of the Faculty of Health Sciences, North-West University, SA (Ethics Ref. no. NWU-00088-12-S1) granted ethics approval for the research to be carried out. Before data collection, permission to conduct the study was granted by the provincial heads of the education departments and the district managers for the Department of Basic Education in Limpopo and Mpumalanga provinces. Information leaflets and informed consent forms were administered to the head teachers, pupils and their parents or guardians, who gave permission for the study to be conducted. The research complied with the Health Professions
Council of SA’s General Ethical Guidelines for Health Researchers.[30]
Sampling
The study was conducted using a cross-sectional design, in which data were collected on body composition and blood pressure among targeted samples of primary-school children in the Limpopo and Mpumalanga provinces of SA. These provinces, which share a common boundary, are relatively under-resourced compared with the other provinces in the country, and the majority of the people belong to the lower socioeconomic brackets. The study sample comprised 1 361 participants (678 boys and 683 girls, aged 9 - 13 years) who were selected from rural primary schools located in the two provinces.
To select the samples, schools in each province were numbered serially based on an alphabetical listing. Subsequently, eight schools were randomly selected from each province. Class registers were used to draw targeted groups of children whose ages could be verified. Children who were reportedly ill and/or were outside of the age limits set for the study were excluded. Overall, participants were randomly selected from 16 rural primary schools located in
various parts of the provinces. Demographic data, which included age, gender and ethnicity, were obtained from participants, as these were regarded as correlates of obesity, normal weight, overweight and underweight among the children. For convenience and ease of data interpretation, the participants were categorised as children (ages 9 - 11 years) and adolescents (ages ≥12 - 13 years).
Anthropometric measurements
Height and weight were measured using the protocol of the International Society for the Advancement of Kinanthropometry.[31] Body composition indices of BMI (weight/height2) were derived. BMI was used to classify the children into the following weight categories: underweight, normal weight, overweight or obese for age and gender.
Based on the BMI classification, COWG/IOTF’s age- and sex-specific
BMI cut-off point, developed by Cole et al.,[25] was applied in order to evaluate the children at risk of obesity and CMD. The results were then compared with available normative data.
Blood pressure measurements
Blood pressure (BP) was measured using an electronic BP monitor (Omron HEM-705 CP devices (Omron Corporation, Japan). The standardised guidelines of the National Heart, Lung, and Blood Institute’s National High Blood Pressure Education Program (NHLBI/NHBPEP) were applied for the assessment of BP among
the children.[32] Elevated BP was defined as the mean systolic and
the diastolic BP above the 95th percentile for age and gender, after
adjusting for weight and height.[32] Based on these guidelines, the
first and third readings of the BP monitor were taken as systolic and diastolic BP (SBP and DBP), respectively. The averages of the two BP measurements were used to examine the existence of the incidence of hypertension associated with obesity and CMD risks among SA children.
Defining weight categories
BMI was determined by dividing the participants’ weight (kg) by the
square of their height (m); BMI defined as kg/m2 offers a reasonable
measure of fatness in children. The IOTF cut-off points are widely accepted, and have been used as the global standard for age- and gender-specific norms of BMI classifications to categorise overweight
and obesity in youths aged 2 - 18 years old.[25,26] In this study, the BMI
cut-off point was used as a determinant of overweight and obesity among children and adolescents aged 9 - 13 years.
Pilot study
A pilot study was conducted before the actual data collection, to ascertain the logistical and technical procedures for taking the measurements. This was preceded by an intensive training workshop conducted by two experts in kinanthropometry, who have many years of experience and have published extensively in the area of body composition and childhood and adolescent physiology. The objectives of the workshop and pilot study were to ensure that the field workers could competently undertake the anthropometric and physiological measurements.
Statistical analysis
RESEARCH
All data analyses were performed with the Statistical Package for the Social Sciences (SPSS) version 24.0 (IBM Corp., USA). For all statistical analyses the level
of significance was set at p≤0.05.
Results
The children’s physical characteristics according to age categories and gender are provided in Table 1. The results showed that there were significant age-related differences between boys and girls in terms of body mass, height, BMI, SBP, and DBP. For instance, boys had a significantly higher mean body weight at ages 11, 12 and 13 years compared with the girls. Age-related significant differences were also observed for height in boys at ages 11, 12 and 13
years (p<0.05). Mean BMI values were
significantly higher in boys at ages 12 and 13 years compared with the girls
of the same age groups (p<0.05). A
significantly higher mean SBP was found in boys at ages 9, 10 and 12 years than in girls of the same ages. The mean DBPs for boys were significantly higher than those of girls at ages 10
and 13 years (p<0.05). Comparisons of
the boys’ and girls’ data for body mass, height and BMI at ages 9 and 10 yielded no significant differences.
Anthropometric characteristics and prevalence rates of overweight and obesity in the boys and girls are presented in Table 2. In the younger age group, participants differed only in SBP
(p=0.001), with the boys having higher
mean values. Of the total number of children, 81.2% were underweight, 17.4% had normal BMI, 0.9% were overweight, and 0.5% obese. In the adolescent group, participants differed substantially in four variables (height,
p=0.001; body mass, p<0.001; BMI,
p<0.001; and SBP, p<0.001). BMI was
normal in 32.5% of the adolescents, whereas 3.4% were overweight and 1.0% obese. In both groups, the prevalence of overweight was higher among boys for both children and adolescents than among the girls, whereas the obesity prevalence rate was higher among girls, for children, and among adolescent
boys (p<0.05). When overweight and
obesity were combined (Table 3), the prevalence rate was lower (1.4%) in the children than adolescents (4.4%). The overall rate of overweight and obesity combined was 2.5% in the whole group of subjects.
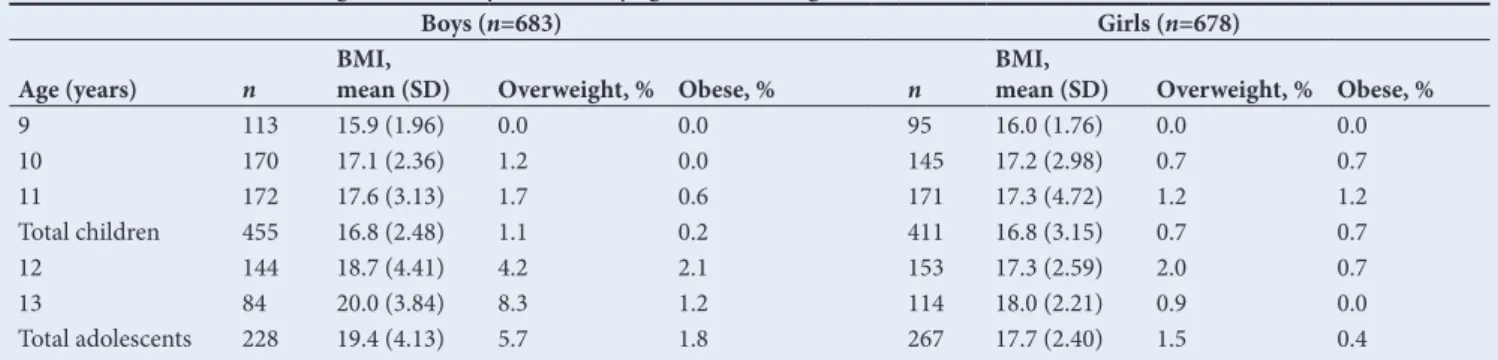
Table 4 details the mean BMI and prevalence rates of overweight and obesity, stratified by age and sex, based
on the IOTF criteria. The average BMI Ta
bl
e 1. P
hy sic al cha rac te ris tics ac co rdin g t
o age g
ro ups a nd ge nd er A ge , (y ea rs) n n Bo
dy mass (kg),
me an (S D) p H eig ht (cm), me an (S D) p BMI (kg/m 2), me an (S D) p SB P (mmH g), me an (S D) p D BP (mmH g), me an (S D) p Boys G irls Al l Boys G irls Al l Boys G irls Al l Boys G irls Al l Boys G irls Al l Boys G irls 9 113 95
27.4 (5.1) 27.5 (5.4) 27.4 (4.7)
0.670
130.6 (6.9) 130.7 (7.2) 130.4 (6.4)
0.977
15.9 (1.8) 15.9 (1.9) 16.0 (1.7)
0.617
108.8 (12.9) 111.3 (13.4) 105.9 (11.7)
0.003*
79.9 (14.7) 79.3 (14.9) 80.8 (14.5)
0.470
10
170
145
31.3 (6.3) 31.5 (6.3) 31.1 (6.2)
0.959
134.9 (6.5) 135.3 (6.8) 134.5 (6.2)
0.446
17.0 (2.8) 17.1 (2.3) 17.0 (3.3)
0.939
111.4 (12.4) 113.3 (11.9) 109.3 (12.6)
0.004*
77.3 (12.9) 79.3 (12.6) 74.9 (12.9)
0.002*
11
172
171
34.0 (9.3) 34.9 (8.1) 33.0 (10.2)
<0.001*
139.3 (6.6) 140.5 (7.2) 138.1 (5.8)
0.001*
17.3 (4.0) 17.4 (3.3) 17.2 (4.7)
0.051
111.7 (13.5) 112.1 (13.1) 111.3 (13.9)
0.604
76.0 (11.9) 75.8 (11.5) 76.1 (12.3)
0.787
12
144
153
37.3 (8.8) 39.6 (9.3) 35.2 (7.7)
<0.001*
143.9 (8.2) 145.7 (8.2) 142.2 (8.0)
<0.001*
17.9 (3.6) 18.6 (4.4) 17.2 (2.5)
0.002*
113.3 (14.8) 116.4 (15.2) 110.5 (13.7)
0.001*
76.9 (12.9) 77.4 (12.1) 76.5 (13.6)
0.551
SD = s
ta nd ar d de vi at io
n; BMI = b
od y m as s in dex; p = p -va
lue; kg = k
ilog
ra
m
s; kg/m2 = k
ilog ra m s p er s qu ar e m et er ; S
BP = sys
to lic b lo od p res sur e; D
BP = di
as to lic b lo od p res sur e; mmH
g = mi
llim et res o f m er cur y. *S ta tis tic al ly sig nific an t ( p ≤0.05). Ta bl
e 2. A
nthr op ome tri c cha rac te ris tics a nd w eig ht s ta tus (me an (S D)) o f p ar tici pa nts ( N =1 361) Chi ldr en ( n=866) Ad ol es ce nts ( n=495) Va ri ab le Boys (n =455) G irls ( n=411) t-va lu e p-va lu e Boys (n =228) G irls ( n=267) t-va lu e p-va lu e A ge (y ea rs) 10.1 (0.78) 10.2 (0.78) –1.04 0.300 12.4 (0.48) 12.4 (0.49) –1.33 0.185 H eig ht (cm) 138.4 (48.4) 137.7 (59.3) 0.17 0.869 147.8 (8.70) 145.2 (8.92) 3.40 0.001 Bo dy m as s (kg) 31.9 (7.48) 31.1 (8.23) 1.42 0.156 42.0 (9.96) 37.4 (7.94) 5.63 0.000 BMI (kg/m 2 ) 16.9 (2.74) 20.6 (7.61) –1.03 0.301 19.2 (4.25) 17.6 (2.45) 4.87 0.000 Sys to lic B P (mmH g) 112.4 (12.8) 109.4 (13.2) 3.38 0.001 116.3 (14.6) 111.4 (13.1) 3.91 0.000 Di as to lic B P (mmH g) 78.0 (12.9) 76.8 (13.3) 1.36 0.176 78.7 (12.2) 76.7 (13.5) 1.75 0.081 U nder w eig ht, n (%) 355 (78) 348 (84.7) -116 (50.9) 196 (73.4) -No rm al , n (%) 94 (20.7) 57 (13.9) -95 (41.6) 66 (24.7) -O ver w eig ht, n (%) 5 (1.1) 3 (0.7) -13 (5.7) 4 (1.5) -O bes e, n (%) 1 (0.2) 3 (0.7) -4 (1.8) 1 (0.4) -O vera ll, n (%) 455 (100) 411(100) -228 (100) 267 (100)
-BMI = b
od
y m
as
s in
dex; B
P = b
lo
od p
res
sur
e; mmH
g = mi
RESEARCH
for boys generally increased with age, from 9 to 10 years and 11 to 13 years, but the trend among the girls was inconsistent, especially for those who were 11 - 13 years old. However, among the adolescent girls, the BMI scores at ages 11 and 12 years remained stable, and thereafter increased at age 13 years. The prevalence of overweight and obesity tended to be higher among adolescent boys and girls (aged 12 - 13 years) than among the children (9 -11 years).
The prevalence of overweight and obesity stratified by sex and province is presented in Table 5.
The results showed that male children living in Limpopo had a lower prevalence of overweight (0.3%), and were not obese (0.0%), compared with those from Mpumalanga Province. However, none of the male participants were obese. Female children living in Mpumalanga Province had higher prevalence rates of Table 3. Prevalence of overweight and obesity combined among participants (N=1 361)
Group n Overweight, n (%) Obese, n (%) Total, n (%)
Children 866 8 (0.9) 4 (0.5) 12 (1.4)
Adolescents 495 17 (3.4) 5 (1.0) 22 (4.4)
Total 1 361 25 (1.8) 9 (0.7) 34 (2.5)
Table 4. Prevalence of overweight and obesity stratified by age and sex using the IOTF criteria
Boys (n=683) Girls (n=678)
Age (years) n BMI, mean (SD) Overweight, % Obese, % n BMI, mean (SD) Overweight, % Obese, %
9 113 15.9 (1.96) 0.0 0.0 95 16.0 (1.76) 0.0 0.0
10 170 17.1 (2.36) 1.2 0.0 145 17.2 (2.98) 0.7 0.7
11 172 17.6 (3.13) 1.7 0.6 171 17.3 (4.72) 1.2 1.2
Total children 455 16.8 (2.48) 1.1 0.2 411 16.8 (3.15) 0.7 0.7
12 144 18.7 (4.41) 4.2 2.1 153 17.3 (2.59) 2.0 0.7
13 84 20.0 (3.84) 8.3 1.2 114 18.0 (2.21) 0.9 0.0
Total adolescents 228 19.4 (4.13) 5.7 1.8 267 17.7 (2.40) 1.5 0.4
IOTF = International Obesity Task Force; BMI = body mass index; SD = standard deviation.
Table 5. Prevalence of overweight and obesity stratified by sex and province using the IOTF criteria
Boys (n=683) Girls (n= 678)
Provinces n BMI, mean (SD) Overweight, % Obese, % n BMI, mean (SD) Overweight, % Obese, %
Children
Limpopo 158 16.5 (2.43) 0.3 - 136 16.3 (1.93) 0.0 0.0
Mpumalanga 125 16.8 (2.04) 0.8 0.0 104 17.3 (3.25) 1.0 0.4
Adolescents
Limpopo 191 18.2 (3.81) 2.2 0.5 223 17.5 (4.40) 1.0 0.5
Mpumalanga 209 18.7 (3.94) 1.4 0.7 215 17.4 (2.26) 0.5 0.2
IOTF = International Obesity Task Force; BMI = body mass index; SD = standard deviation.
Table 6. Correlation matrix showing relationship between BMI and risks factors of CMD variables (N=1 361)
Variables Age Body mass Height BMI SBP DBP
Age Coefficient (r) 1
Body mass Coefficient (r) 0.501* 1
Sig. (2-tailed) 0.000
Height Coefficient (r) 0.129* 0.202* 1
Sig. (2-tailed) 0.000 0.000
BMI Coefficient (r) –0.022 0.026 –0.091* 1
Sig. (2-tailed) (r) 0.418 0.341 0.001
SBP Coefficient (r) 0.113* 0.290* 0.037 0.018 1
Sig. (2-tailed) 0.000 0.000 0.176 0.516
DBP Coefficient (r) –0.029 0.133* 0.065† 0.074* 0.440* 1
Sig. (2-tailed) 0.286 0.000 0.016 0.007 0.000
BMI = body mass index; CMD = cardiometabolic disease; SBP = systolic blood pressure; DBP = diastolic blood pressure. *Significant at 0.01.
RESEARCH
overweight (1.0%) and obesity (0.4%) than their counterparts in Limpopo Province. In the adolescent group, boys in Limpopo Province had a higher percentage of overweight (2.2%) than their contemporaries in Mpumalanga Province, with a 1.4% overweight prevalence rate. Furthermore, boys from Mpumalanga Province had a higher prevalence of obesity (0.7%) compared with their peers from Limpopo Province (0.5%). However, girls from Limpopo demonstrated a higher prevalence of overweight (1.0%) and obesity (0.5%) than their peers from Mpumalanga. The results also showed a statistically significant relationship between age and body mass
(r=0.501; p=0.000), height (r=0.129; p=0.000), and SBP (r=0.113;
p=0.000) of the participants in the combined group of children and
adolescents. BMI correlated significantly with height (r=–0.091;
p=0.001) and DBP (r=0.074; p=0.007). Height was also found to be
significantly positively correlated with DBP (r=0.065; p=0.016), while
SBP (r=0.018; p=0.516) and age (r=–0.022; p=0.418) yielded
non-significant correlations with BMI (Table 6).
Analysis of the influence of age, gender and province on overweight and obesity among female children revealed that the regression
model was not significant (α2(2, N=411)=–14.742; p=0.201) (Table 7). The
model explained between 1.1% and 7.5% of the variation in weight status, and correctly classified 58.2% of the cases. Furthermore, age did not make a significant contribution to the model, with an odds ratio of 2.88, suggesting that the likelihood of being overweight decreases by a factor of 2.9 with a unit increase in age among the children and adolescents. The results by province indicated that the likelihood of a girl from Mpumalanga becoming overweight or obese was 0.33 times higher than that of a girl in Limpopo.
Discussion
This study assessed the risk factors for obesity and CMD among
1 361 primary school children (boys, n=678; girls, n=683) aged
9 - 13 years in the Mpumalanga and Limpopo provinces of SA. Using the IOTF norms, we observed the prevalence of overweight and obesity by gender and age among the children. Furthermore, bivariate correlations between BMI and the risk factors for CMD were observed. The study of bodyweight disorders using the IOTF’s BMI criteria is of potential interest from a public-health standpoint. The use of age- and gender-related BMI centiles for assessing bodyweight disorders in SA youngsters could provide a window of opportunity to observe levels of overweight or underweight, which can be used as a tool to recognise such disorders, so that interventions to prevent health complications can be made.
However, during the quest to determine the right definition of overweight and obesity, to avoid overestimation, overweight and
obesity in youth continue to rise globally.[35] The findings from our
study revealed that underweight was most prevalent among the
participants. The present findings corroborate those of Goon et al.,[33]
who reported a higher prevalence of underweight than overweight and obesity in Nigerian children and adolescents. Despite the prevalence of underweight found in this study, the fact of overweight and obesity still needs to be recognised as a potential public-health concern.
Studies have established that the prevalence of overweight and obesity is no longer limited to technologically advanced countries,
but is currently a rising public health problem in emerging economies.[33,34]
As stated by Reddy etal.,[35] one out of five children in SA is either
overweight or obese. Findings from this present study showed that the prevalence of overweight and obesity combined for boys and girls in the younger age category were 1.1% and 1.2%, respectively. The equivalent rates for adolescent boys and girls were 8.0% and 1.9%, respectively. In younger age groups, the rates were higher in girls, while among adolescents, higher prevalence rates were noted
among the boys. This contradicts the results of a study by Musa et
al.,[34] which found a high prevalence of combined overweight and
obesity of 19.7% and 23.2% for 9 - 11-year-old Nigerian children. In our study, it was observed that the rate of combined overweight
and obesity was higher for adolescent boys than girls.This finding
was surprising, in that girls usually have a higher propensity to
be overweight and obese than boys of a similar age group.[27-29]
Overweight and obesity were more common in adolescents than in children in the present study. These findings contradict those of
Schnohr et al.,[36] which showed a higher prevalence of overweight
and obesity in children than in adolescents.
Both male and female children in Mpumalanga province exhibited a higher prevalence of overweight and obesity than those from Limpopo province. From a public health perspective, the epidemic of overweight and obesity could have damaging consequences, resulting in poor health outcomes as a result of its association with CMD risk. Furthermore, both overweight and obesity might have destructive
consequences for the growth and motor development of children.[37]
Studies have also indicated that overweight and obesity could have deleterious outcomes if left without any preventive intervention, as
the youngsters in these studies were in developmental stages.[33-35]
The results of this study underscore the significance of adopting
a healthy lifestyle at an early developmental stage.[38] Although our
study focused mainly on overweight and obesity, the existence of underweight conditions in this cohort of children and adolescents should not be ignored. Some of the reasons stated in previous studies as possible causes of underweight in developing countries were poverty levels, low socioeconomic backgrounds, environmental factors, poor nutritional intake and food practices and parents’
ignorance of this,[33-35] and of the dangers of a sedentary lifestyle or
the influence of genetic endowment.[33-35] As many children from
public primary schools in our study were from low socioeconomic backgrounds, they probably had limited access to daily balanced diets.
Limitations
The findings of this study should be interpreted in light of a number of limitations. Firstly, BMI is only a surrogate measure of body composition, and cannot reliably distinguish between fat-free mass and adipose tissue. Secondly, since our study was carried out in only two provinces of SA, the present findings cannot be generalised to the entire country, because of its demographic and racial diversity. Thirdly, hereditary endowment may also partly account for the observed outcomes, but this aspect was beyond the scope of the study. Lastly, children’s socioeconomic background and nutrition were not assessed in the present study, but these may give a proper indication of their lifestyles, and further elucidate the results.
Conclusion
The occurrence of overweight and obesity in a combined sample of SA children was lower than the rate observed for adolescent boys and girls. Overall, children from Mpumalanga Province exhibited a higher incidence of overweight and obesity than those from Limpopo Province. Owing to the increasing prevalence of overweight and obesity in these children and adolescents, urgent preventive interventions that target high-risk behaviours in early life should be implemented in primary and secondary schools, thereby creating Table 7. The odds of becoming overweight in female children
according to age and province (n=411)
Variables OR 95% CI p-value
Province
Limpopo 1 0.06 - 1.82 0.201
Mpumalanga 0.33
Age 2.88 0.69 - 11.9 0.144
RESEARCH
awareness of the consequences of bodyweight disorders, especially in low socioeconomic groups.
Acknowledgements. The authors are thankful to the provincial Departments of Basic Education of Limpopo and Mpumalanga provinces, the Department of Education District Offices, school authorities, teachers, parents and the children who participated in the study, for their co-operation. Sincere gratitude goes to the University of Limpopo students’ research team for their assistance in data collection. The authors express their profound appreciation to the Physical Activity, Sport and Recreation School for Biokinetics, Recreation and Sports Science, North-West University, as well as the Department of Sport, Rehabilitation and Dental Sciences, Tshwane University of Technology, for facilitating the logistics of the study.
Author contributions. VKM developed the concepts, collected data, performed the data cleaning, analysis and interpretation, and drafted the manuscript. MvS technically reviewed the manuscript.
Funding. This material is based upon work supported financially by the National Research Foundation (NRF) of SA.
Conflicts of interest. Any opinions, findings and conclusions or recommendations expressed in this material are those of the authors, and therefore the NRF does not accept any liability in this regard.
1. World Health Organization. Global Strategy on Diet, Physical Activity and Health: Childhood Overweight and Obesity. Geneva: WHO, 2011. http://www.who.int/ dietphysicalactivity/childhood/en/ (accessed 8 February 2012)
2. Ogden CL, Carroll MD, Curtin LR, Lamb MM, Flegal KM. Prevalence of high body mass index in US children and adolescents, 2007-2008. JAMA 2010;303(3):242-249.
https://doi.org/10.1001/jama.2009.2012
3. Del-Rio-Navarro BE, Velazquez-Monroy O, Lara-Esqueda A, et al. Obesity and metabolic risks in children. Arch Med Res 2008;39(2):215-221. https://doi. org/10.1016/j.arcmed.2007.07.008
4. Wake M, Hardy P, Canterford L, Sawyer M, Carlin JB. Overweight, obesity and girth of Australian preschoolers: Prevalence and socioeconomic correlates. Int J Obes 2007;31(7):1044-1051. https://doi.org/10.1038/ sj.ijo.0803503
5. Rossouw HA, Grant CC, Viljoen M. Overweight and obesity in children and adolescents: The South African problem. S Afr J Sci 2012;108(5-6):31-37. https:// doi.org/10.4102/sajs.v108i5/6.907
6. Toriola AL, Moselakgomo VK, Shaw BS, Goon DT. Overweight, obesity and underweight in rural black South African children. S Afr J Clin Nutr 2012;25(2):57-61. https://doi.org/10.1080/16070658.2012.11734406
7. Singh R. Childhood obesity: An epidemic in waiting? Int J Med Public Health 2013;3(1):2-7. https://doi.org/10.4103/2230-8598.109298
8. World Health Organization. Obesity and overweight: Diet and physical activity. Geneva: WHO, 2010. http://www.who.int/dietphysicalactivity/childhoo/en/
(accessed 20 November 2010).
9. Ramoshaba N, Monyeki K, Hay L. Components of height and blood pressure among Ellisras rural children: Ellisras longitudinal study. Int J Environ Res Public Health 2016;13(9):856. https://doi.org/10.3390/ijerph13090856
10. Kimani-Murage EW. Exploring the paradox: Double burden of malnutrition in rural South Africa. Glob Health Act 2013;6(0):1924-1929. https://doi.org/10.3402/ gha.v6i0.19249
11. Tathiah N, Moodley I, Mubaiwa V, Denny L, Taylor M. South Africa’s nutritional transition: Overweight, obesity, underweight and stunting in female primary school learners in rural KwaZulu-Natal, South Africa. A Afr Med J 2013;103(10):718-723. https://doi.org/10.7196/samj.6922
12. Kimani-Murage EW, Kahn K, Pettifor JM, et al. The prevalence of stunting, overweight and obesity, and metabolic disease risk in rural South African children. BMC Public Health 2010;10(1):158. https://doi. org/10.1186/1471-2458-10-158
13. American Heart Association. Cardiovascular Disease Statistics. Dallas: AHA, 2010. http//www.circ.ahajournals.org (accessed 4 November 2016).
14. Shields M, Tremblay MS. Canadian childhood obesity estimates based on World Health Organization, International Obesity Task Force and Centers for Disease Control and Prevention cut-off points. Int J Pediatr Obes 2010;5(2):265-273. https:// doi.org/10.3109/17477160903268282
15. Foo LH. Influence of body composition, muscle strength, diet and physical activity and total body and forearm bone mass in Chinese adolescents girls. Brit J Nutr 2007;98(6):1281-1287. https://doi.org/10.1017/ s0007114507787421
16. Ford C, Ward D, White M. Television viewing associated with adverse dietary outcomes in children ages 2 - 6. Obes Rev 2012;13(12):1139-1147. https://doi. org/10.1111/j.1467-789x.2012.01028.x
17. Ferreira FS. Relationship between physical fitness and nutritional status in Portuguese sample of school adolescents. J Obes Weight Loss Ther 2013;3(5):3-6. https://doi.org/10.4172/2165-7904.1000190
18. Lee DC, Artero EG, Sui X, Blair SN. Review: Mortality trends in the general population: The importance of cardiorespiratory fitness. J Psychopharmacol 2010;24(Suppl 4):S27-S35. https://doi. org/10.1177/1359786810382057
19. Amusa LO, Goon DT, Amey AK, Toriola AL. Health-related physical fitness and associations with anthropometric measurements in 7 - 15 year old school children. J Pediatr 2011;86(6):497-502.
20. Goon DT, Toriola AL, Shaw BS, Akinyemi O. Can waist circumference be estimated from BMI in Nigerian children? Gazz Med Ital 2011;170(4):225-228. 21. Popkin BM, Adair LS, Ng SW. Global nutrition transition and the pandemic
of obesity in developing countries. Nutri Rev 2012;70(1):3-21. https://doi. org/10.1111/j.1753-4887.2011.00456.x
22. Awotidebe A, Monyeki MA, Moss SJ, Strydom GL, Amstrong M, Kemper HCG. Relationship of adiposity and cardiorespiratory fitness with resting blood pressure of South African adolescents: The PAHL Study. J Hum Hyper 2016;30(4):245-251. https://doi.org/10.1038/jhh.2015.81
23. Wakabayashi I. Age-dependent influence of gender on the association between obesity and a cluster of cardiometabolic risk factors. Gender Med 2012;9(4):267-277.
24. Goon DT, Toriola AL, Shaw BS, Amusa LO, Musa DI. Sex differences in anthropometric characteristics of Nigerian school children aged 9 - 2 years. Afr J Phys Health Educ Recr Dance 2008;14(2):130-142. https://doi.org/10.4314/ ajpherd.v14i2.24798
25. Cole TJ, Flegal KM, Nicholls D, Jackson AA. Body mass index cut-offs to define thinness in children and adolescents: International survey. BMJ 2007; 335(7612):194. https://doi.org/10.1136/bmj.39238.399444.55
26. Must A, Strauss RS. Risks and consequences of childhood and adolescent obesity. Int J Obes Relat Metabol Disord 2000;23(Suppl 2):S2-S11. https://doi. org/10.1038/sj/ijo/0800852
27. Hajian-Tilaki K, Heidari B. A comparison between International Obesity Task Force and Center for Disease Control references in assessment of overweight and obesity among adolescents in Babol, northern Iran. Int J Prev Med 2013;4(2):226-231.
28. Valerio G, Maffeis C, Balsamo A. Severe obesity and cardiometabolic risk in children: Comparison from two international classification systems. PloS One 2013;8(12):e83793. https://doi.org/10.1371/journal.pone.0083793
29. Edginton CR, Chin M, Amusa LO, Toriola AL. Health and physical education: A new global statement of consensus – perspectives from South Africa. Afr J Phys Health Educ Recr Dance 2012;18(2):434-441.
30. Edeling HJ, Mabuya NB, Engelbrecht P, Rosman KD, Birrel DA. HPCSA Serious Injury Narrative Test Guideline. S Afr MedJ 2013;103(10):763-766. https://doi. org/10.7196/SAMJ.7118
31. The International Society for the Advancement of Kinanthropometry. International Standard for Anthropometric Assessment, South Africa. Glasgow: ISAK, 2006.
32. Cooper CB. Blood pressure measurement, hypertension and endurance exercise. ACSM Health Fit, 2000;4:32-33.
33. Goon DT, Toriola AL, Shaw BS. Screening for body weight disorders in Nigerian children using contrasting definitions. Obes Rev 2010;11(7):508-515.
https://doi.org/10.1111/j.1467-789x.2009.00682.x
34. Musa DI, Toriola AL, Monyeki MA, Lawal B. Prevalence of childhood and adolescent overweight and obesity in Benue State (Nigeria). Trop Medicine Int Health 2012;17(11):1369-1375. https://doi.org/10.1111/j.1365-3156.2012.03083.x
35. Reddy SP, Resnicow K, James S. Rapid increase in overweight and obesity among South African adolescents: Comparison of data from the South African National Youth Risk Behaviour Survey in 2002 and 2008. Am J Pub Health 2012;102(2):262-268. https://doi.org/10.2105/ajph.2011.300222
36. Schnohr C, Sørensen TI, Niclasen BVL. Changes since 1980 in body mass index and the prevalence of overweight among inschooling children in Nuuk, Greenland. Int J Circumpolar Health 2005;64(2):157-162. https://doi. org/10.3402/ijch.v64i2.17968
37. Malina RM, Bouchard C, Bar-Or O. Growth, Maturation and Physical Activity (2nd ed.). Champaign, Illinois: Human Kinetics, 2004.
38. Koning M, Hoekstra T, de Jong E, Visscher TLS, Seidell JC, Renders CM. Identifying developmental trajectories of body mass index in childhood using latent class growth (mixture) modelling: Associations with dietary, sedentary and physical activity behaviours: A longitudinal study. BMC Public Health 2016;16(4):1128-1134. https://doi.org/10.1186/s12889-016-3757-7