Mortality Table Development Update
2014 VBT/CSO & Preneed/GI/SI
Society of Actuaries & American Academy of Actuaries Joint
Project Oversight Group
Mary Bahna-Nolan, FSA, CERA, MAAA
Chairperson, Academy’s Life Experience Subcommittee
April 4, 2013
Copyright © 2013 by the American Academy of Actuaries All Rights Reserved.
2
Underlying 2014 VBT - Considerations
Significant increase in exposures from 2001 or 2008
VBT:
7 exposure years (2002-2009)
$30.7 exposure amount; $2.55 million claims
Preferred experience
Non-tobacco versus Non-smoker
Older issue ages
Female risks
Underlying experience shows significant variation by
issue age, face amount, smoking status
Improvement in underlying mortality
Study Period
Male
Female
Aggregate
Exposure
(Trillion)
# Death
Claims
2002-2004
101.1%
100.5%
100.9%
$ 7.4
699,890
2002-2007
96.2%
97.0%
96.4%
21.1
1,800,912
2002-2009 - Preliminary
94.2%
94.7%
94.3%
30.7
2,549,490
2002-2007 Common Companies
94.6
95.4
94.8
12.4
1,393,521
2002-2009 – Preliminary
Common Companies
92.3%
94.3%
92.8%
19.2
1,940,403
2002 – 2009 Preliminary 100k+
88.3%
89.2%
88.5%
26.9
162,095
2002 – 2009 Preliminary 250k+
84.1%
85.4%
84.4%
20.6
46,570
Insured lives mortality varies by many
factors
Smoking Status
A/E Ratio by
Amount
non-smoker
92.3%
Smoker
97.5%
Unknown Status
99.8%
Aggregate
94.3%
Face Amount Band
($)
A/E Ratio by
Amount
50,000 – 99,999
105.6%
250,000 – 499,999
88.6%
1,000,000 – 2,499,999
81.9%
5,000,000 – 9,999,999
74.1%
Aggregate
92.7%
In addition to gender, life insurance mortality experience varies by many
factors including face amount, smoking status, and issue age
A/E* Ratio – by Face Amount
A/E* Ratio – NS versus SM
A/E* Ratio – By Issue Age
Issue Age
A/E Ratio by
Amount
40 – 49
100.1%
60 – 69
95.1%
80-89**
61.6%
* Expected basis = 2008 VBT Primary Tables, ANB
** 80-90 for common companies drops to 55%
Copyright © 2013 by the American Academy of Actuaries All Rights Reserved.
5
Table structure
Likely to have 3 sets of tables
Experience table
VBT
CSO
VBT will have aggregate and preferred structure tables
Focused first on aggregate VBT tables; preferred tables
and CSO will follow
VBT and CSO prospective tables – consider expected
experience for issues 2014 and later informed from
underlying historical experience versus purely a historical
or retrospective table
Table structure
Similar structure as 2008 VBT, with Primary and RR Tables
RR Tables expected to be same in number but perhaps have different
relativity amongst the classes
Need for limited underwriting table still under examination
Relies partially on results from GI/SI study
To date, have not excluded any data for aggregate and ultimate
experience but still examining impact on older age slope
Considering excluding certain policies (smaller face amounts) based on
issue year and issue age
Select factor variation by gender and issue age
Omega rate per 1,000 (0.5000 at attained age 112) but no omega
age
Preliminary
Ultimate mortality
rates (aggregate)
versus 2008 VBT
(NS/SM distinct)
are lower than
2008 VBT
Ultimate mortality
will be further
split into NS/SM
distinct rates
0 50 100 150 200 250 300 350 400 450 500 550 Q x pe r 10 00 Attained AgePreliminary Qx Male Aggregate Smoker Ultimate
2008 VBT RR100 MNS Ultimate 2008 VBT RR100 MSM Ultimate
Source: 2014 Valuation Basic Table Team of the Society of Actuaries & American Academy of Actuaries Joint Project Oversight Group
Preliminary Ultimate Mortality Rates
0 5 10 15 20 25 30 35
Q
x
pe
r
10
00
Attained AgePreliminary Male Ultimate Aggregate Smoker
2008 Male Ultimate Nonsmoker 2008 Male Ultimate Smoker
Select Period
Varies by issue age
Considered both observable as well as prospective select
period
Underlying select period independent of preferred wear-off
Observable select period
Based on underlying data of both common companies as well as all companies
Data analyzed based on count rather than amount to remove influence of
variations/fluctuations by size of claim
Attempted to normalize the socio-economic impact over time
Focused on gender/smoking status level, quinquennial age groupings
Used GAM (Generalized Additive Model) to test fit of actual mortality to
mortality predicted by the GAM model by duration as ratios to ultimate
mortality, averaged across all attained ages
Select Period, cont’d
Prospective select period
Looked to “events” or changes in underwriting which have impacted
the select period in the underlying 2002-2009 data
E.g., Movement from smoker to non-smoker rates (1980s), movement
from non-smoker/smoker to non-tobacco/tobacco distinction (1990s),
liberal underwriting period with increased level of underwriting
exceptions (2000-2005), development of mature age underwriting
requirements such as cognitive function (2005-present)
Most “events” thought to shorten select period from that in observed
data; a couple such as NT versus NS and older age cognitive function
testing may elongate
Modified the observed select period for changes in smoker
Select Period, cont’d
Proposed Select Period Based on Observable Data
Source: 2014 Valuation Basic Table Team of the Society of Actuaries & American Academy of Actuaries Joint Project Oversight Group
Issue Age Male Female
Issue Age Male Female
0-17
0
0
76
14
13
18-53
25
20
77
13
12
54-55
24
20
78
13
11
56-57
23
20
79
12
11
58-59
22
20
80-81
11
10
60-61
21
20
82
10
9
62
20
20
83
9
8
63
20
19
84
8
8
64
19
18
85
8
7
65
19
17
86
7
6
66
18
16
87
6
6
67-69
18
15
88-89
5
5
70-72
17
15
90
4
4
73-74
16
14
91
3
3
75
15
13
92-95
2
2
Select Period, cont’d
Preliminary MNS Select Period
Issue Ages 30-39
Source: 2014 Valuation Basic Table Team of the Society of Actuaries & American Academy of Actuaries Joint Project Oversight Group
-100 200 300 400 500 600 700 800 -0.0020 0.0040 0.0060 0.0080 0.0100 0.0120 1 2 3 4 5 6 7 8 9 10 11 12 13 14 15 16 17 18 19 20 21 22 23 24 25 Actual_Deaths Raw Qx by Count
Select Qx by Count Ultimate Qx by Count 08VBT Agg Ultimate Qx by Count
-200 400 600 800 1,000 1,200 1,400 -0.0050 0.0100 0.0150 0.0200 0.0250 0.0300 0.0350 0.0400 1 2 3 4 5 6 7 8 9 10 11 12 13 14 15 16 17 18 19 20 21 22 23 24 25 Actual_Deaths Raw Qx by Count
Select Qx by Count Ultimate Qx by Count 08VBT Agg Ultimate Qx by Count
Preliminary MNS Select Period
Issue Ages 50-59
Select Period, cont’d
Preliminary Mortality Rates, MNS Select Period
Issue Ages 70-79
Source: 2014 Valuation Basic Table Team of the Society of Actuaries & American Academy of Actuaries Joint Project Oversight Group
-50 100 150 200 250 300 350 400 -0.0200 0.0400 0.0600 0.0800 0.1000 0.1200 1 2 3 4 5 6 7 8 9 10 11 12 13 14 15 16 17 18
Actual_Deaths Raw Qx by Count
Select Qx by Count Ultimate Qx by Count 08VBT Agg Ultimate Qx by Count
Juveniles
Examined mortality relative to population mortality and
insured mortality (2008 VBT)
No clear relationship to population mortality
Consider ages 0-17 as juveniles
No smoker/non-smoker distinction
No observable select period
Proposed table juvenile rates attained age only
Some grading/graduation may be needed to smoothly grade at
attained age 26 into adult attained ages, possibly causing some
element of select mortality rates for smoothness purposes at
higher juvenile issue ages and select durations
Juveniles, cont’d
Juvenile Preliminary Mortality Rates per 1000, Male Risks
Source: 2014 Valuation Basic Table Team of the Society of Actuaries & American Academy of Actuaries Joint Project Oversight Group
0.00
0.20
0.40
0.60
0.80
1.00
1.20
1 2 3 4 5 6 7 8 9 1011121314151617181920212223242526
Qx
p
e
r
1
0
0
0
Attained Age
Preliminary Qx
2008 VBT Qx
Adjustment to remove effects of post
level term mortality
Examined underlying experience for term plans only
Calculated actual to expected (A/E) ratios based on face amount by issue
age group and duration in total and for 10, 15 and 20 year term plans
The ratios were calculated for male and female separately and for both
genders combined and were not split by smoker status (that is, the ratios
were calculated for all smoker statuses combined)
Recalculated the A/E ratios estimating impact of removing the post level
term experience
Determined the ratio of the A/E excluding post-level term to the total A/E.
This provided the proposed adjustment to decrease the total rates to
account for the impact of post-level term experience.
Factors vary by issue age/duration
Preferred wear-off
Still closely examining
Looking at prevalence of preferred risk in underlying
exposures and relationship of mortality for
preferred/residual structures to aggregate class
Will have one weighted aggregate NS class; however,
considering development of preferred structure classes
(RR Tables) to have different base or slope than
aggregate classes
Deviation from what was done for 2008 VBT
Preferred wear-off, cont’d
Concerned with % of aggregate NS data – continuing to investigate
adjustments
% aggregate NS significantly higher than expected and seen in other recent mortality
studies
Experience varies significantly between aggregate smoker and non-smoker/smoker
distinct
60% 70% 80% 90% 100% 110% 120% 130% 1 3 5 7 9 11 13 15 17 19 21 23 25Pref NS Classes to Total
Weighted by # of Claims
Pref Era NS Total NS Aggr NS
Sm Raw Pref Smth Raw Aggr
80% 90% 100% 110% 120% 130% 1 3 5 7 9 11 13 15 17 19 21 23 25
Pref Sm Classes to Total
Weighted by # of Claims
Pref Era Sm Total SM Aggr SM
Sm Raw Pref Sm Raw Aggr
Example – Issue age 45
2014 VBT Next Steps and Timing
Aggregate NS/SM Tables
Select & Ultimate NS/SM Tables
This summer
Hope to have first look at preferred structure tables
Begin work on CSO
2014 CSO
2014 VBT will be underlying table for CSO tables to be
used for Net Premium Reserve under PBR, non-forfeiture
and tax
Prescribed table with no adjustment for own company
experience
Table not yet developed; will build from 2014 VBT
Margin determination and structure still under discussion
but will be embedded within table
Likely to focus on smoothness over fit
Copyright © 2013 by the American Academy of Actuaries All Rights Reserved.
20
Margins – 2014 CSO
Focus on net premium valuation
Look to cover x% of contributing companies, likely in
form of Margin for Company Variation risk
Covers deviations from a selected industry mortality due
to differences in underwriting practices and the
demographics of the underlying insured lives
Fixed amount that varies by attained age
For 2008 VBT, this would have ranged from 21% at
younger ages to 9% at older ages
Comparison of life valuation mortality
table structures
Criteria/Table Structure
2001 CSO
2014 CSO
2014 VBT
Uses
•
Net Premium Reserves
•
Tax Reserves
•
Non-forfeiture
•
Net Premium Reserves
•
Tax Reserves
•
Non-forfeiture
•
VM20 Deterministic
•
VM20 Stochastic Reserves
Underlying mortality table and
experience
2001 VBT
(1990-1995 data)
2014 VBT
(2002-2009 data)
Individual Life Experience
Committee (ILEC) and US
population data
Number of tables
•
Gender distinct/Composite
•
Smoker distinct/Composite
•
3 NT/NS
•
2 TB/SM
Expect to be similar to 2001
CSO
Expect to be similar to 2008 VBT
Risk class tables aggregate back
to composite
Yes
Yes (proposed)
No
Preferred/Residual/Aggregate
Prescribed table
Yes
Yes
No, subject to VM-20 requirements
Considers mortality
improvement
No
No
Yes, to valuation date – prescribed
and own company
Smoothness versus fit
Smoothness
Smoothness
Fit
Preneed/GI/SI
•
All three studies in
various stages of
analysis
•
Project is behind
schedule but trying to
get back on track
•
Compared mortality
experience to 4 tables
•
SOA 75/80 Ultimate
•
SOA 2001 VBT
Ultimate
•
SOA 2007 VBT
Ultimate
•
SOA 2008 VBT LU
Ultimate
SI
Preneed
GI
Companies submitting
data
33
13
15
Count Exposed*
18,840,681 7,976,643 4,774,450
Death Count
272,967 639,084
212,487
Units Exposed* 492,247,920 35,096,568 34,607,741
Death Amount In Units
2,305,043 2,992,148 1,370,634
Expected Deaths By Units*
2,275,344 1,887,021 795,216
A/E Ratio by Unit*
101.3%
158.6%
172.4%
Average Size Exposed
26,127 4,400 7,249
Average Size - Deaths
8,444 4,682 6,450
Exposure by units at
attained ages 80+
<1%
40%
8%
* Expected basis is 2008 VBT LU Ultimate
√
Source: GI/SI/Preneed Team of the Society of Actuaries & American Academy of
Actuaries Joint Project Oversight Group
Simplified Issue
Initial review nearly complete
Mortality shows fairly good fit with the 2008 VBT
LU Table
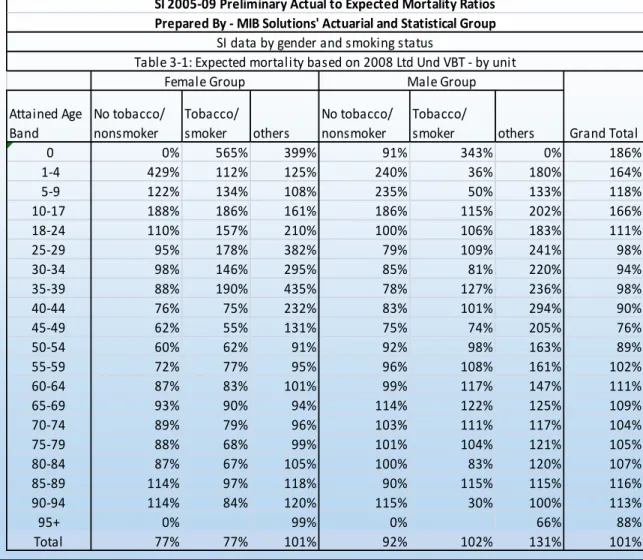
Simplified Issue, cont’d
Seeing some large differences between business
issued as uni-smoke versus SM/NS distinct – still
investigating
For aggregate smoking status:
Significant volume of data submitted at < 25 units (1
unit=$1,000)
Early duration A/E approximately 25% > than experience
for units of 25+
Simplified Issue, cont’d
Much of difference
between other and
NS/SM distinct due to
lower face
amounts/number of
units
Differences such that
may not be possible to
develop a consistent
set of
NS/SM/Composite
mortality rates to
accurately reproduce
the mortality rates in
each group
Attained Age
Band
No tobacco/
nonsmoker
Tobacco/
smoker
others
No tobacco/
nonsmoker
Tobacco/
smoker
others
0
0%
565%
399%
91%
343%
0%
186%
1-4
429%
112%
125%
240%
36%
180%
164%
5-9
122%
134%
108%
235%
50%
133%
118%
10-17
188%
186%
161%
186%
115%
202%
166%
18-24
110%
157%
210%
100%
106%
183%
111%
25-29
95%
178%
382%
79%
109%
241%
98%
30-34
98%
146%
295%
85%
81%
220%
94%
35-39
88%
190%
435%
78%
127%
236%
98%
40-44
76%
75%
232%
83%
101%
294%
90%
45-49
62%
55%
131%
75%
74%
205%
76%
50-54
60%
62%
91%
92%
98%
163%
89%
55-59
72%
77%
95%
96%
108%
161%
102%
60-64
87%
83%
101%
99%
117%
147%
111%
65-69
93%
90%
94%
114%
122%
125%
109%
70-74
89%
79%
96%
103%
111%
117%
104%
75-79
88%
68%
99%
101%
104%
121%
105%
80-84
87%
67%
105%
100%
83%
120%
107%
85-89
114%
97%
118%
90%
115%
115%
116%
90-94
114%
84%
120%
115%
30%
100%
113%
95+
0%
99%
0%
66%
88%
Total
77%
77%
101%
92%
102%
131%
101%
SI 2005-09 Preliminary Actual to Expected Mortality Ratios
Prepared By - MIB Solutions' Actuarial and Statistical Group
SI data by gender and smoking status
Female Group
Male Group
Table 3-1: Expected mortality based on 2008 Ltd Und VBT - by unit
Grand Total
Source: GI/SI/Preneed Team of the Society
of Actuaries & American Academy of
Actuaries Joint Project Oversight Group
Simplified Issue, cont’d
Significant variation in experience by size of policy and
between aggregate versus NS/SM distinct
0.0%
50.0%
100.0%
150.0%
200.0%
250.0%
1
2
3
4
6
9
13
18
23
26
A
/E
a
s
%
2
0
0
8
V
B
T
LU
U
lt
im
at
e
Duration Group
Agg < 25
Agg 25-250
Agg < 250
Agg NS < 250
Agg SM < 250
Simplified Issue, cont’d
Variation in experience by size of policy prominent for NS/SM distinct
business as well but relationship to 2008 VBT LU and slope are
consistent between NS and SM
Observable 2-year select period
0.0%
20.0%
40.0%
60.0%
80.0%
100.0%
120.0%
140.0%
160.0%
1
2
3
4
6
9
13
18
23
A
/E
a
s
%
2
00
8
V
BT
L
U
U
lt
im
at
e
Duration Group
NS < 50
NS 50-250
Agg NS < 250
SM < 50
SM 50-250
Agg SM < 250
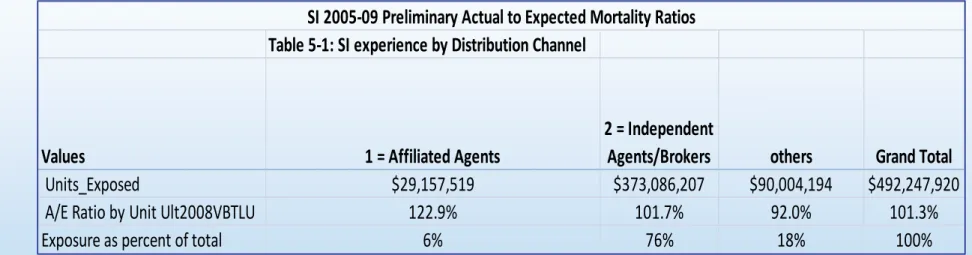
Simplified Issue, cont’d
Seeing some variation by distribution channel but not much
Table 5-1: SI experience by Distribution Channel
Values
1 = Affiliated Agents
2 = Independent
Agents/Brokers
others
Grand Total
Units_Exposed
$29,157,519
$373,086,207
$90,004,194
$492,247,920
A/E Ratio by Unit Ult2008VBTLU
122.9%
101.7%
92.0%
101.3%
Exposure as percent of total
6%
76%
18%
100%
SI 2005-09 Preliminary Actual to Expected Mortality Ratios
Guaranteed Issue
Mortality does not show as nice a fit with the 2008
VBT LU Table as SI
Excluding data submitted as smoker distinct as
experience considerably different from the rest and
skewed toward later durations
Removes approximate 4 million claims – study still
includes over 31 million claims
Data shows sharply decreasing mortality ratios by
Guaranteed Issue, cont’d
Mortality ratios vary significantly by attained age
0%
100%
200%
300%
400%
500%
600%
700%
800%
900%
1000%
53 54 55 56 57 58 59 60 61 62 63 64 65 66 67 68 69 70 71 72 73 74 75 76 77 78 79 80 81 82 83 84 85 86
R
a
ti
o
t
o
2
0
0
8
V
B
T
LU
A
L
B
U
lt
C
o
m
p
o
si
te
Attained age
Mortality ratio by attained age
Female
Male
Guaranteed Issue, cont’d
Overall experience mortality is fairly smooth over the attained
age range shown
The excess over 2008 VBTLU declines with increasing attained
age - extending mortality to younger ages may be problematic
Guaranteed Issue, cont’d
Observable level of anti-selection in early durations
Fairly flat after duration 4 for males and duration 8 for females
1
2
3
4
5
6
7
8
9
10
11
12
13
14
15
16
17
18
19
20+
Female 112% 105% 105% 101% 100% 100% 98% 97% 96% 97% 97% 94% 95% 95% 94% 92% 94% 95% 93% 105%
Male
116% 103% 101% 97% 96% 94% 95% 97% 97% 96% 99% 96% 96% 97% 97% 97% 99% 97% 96% 108%
80%
85%
90%
95%
100%
105%
110%
115%
120%
Mortality ratio by duration
Expected mortality based on attained age
Guaranteed Issue, cont’d
Mortality ratios higher at younger ages from those in previous study
45-49
50-54
55-59
60-64
65-69
70-74
75-79
80&above
Grand
Total
Female
360.0% 255.7% 205.0% 149.4% 116.3%
98.2%
88.3%
87.1%
129.1%
Male
303.2% 232.3% 172.4% 125.1% 103.5%
96.6%
89.8%
90.2%
120.9%
Total
328.3% 243.1% 186.9% 136.0% 109.3%
97.4%
89.0%
88.3%
124.9%
45-49
50-54
55-59
60-64
65-69
70-74
75-79
80&above
Grand
Total
Male
276.0% 241.1% 221.7% 173.7% 138.4% 116.1% 91.4%
150.4%
Female
255.1% 245.5% 192.4% 162.9% 134.9% 118.3% 92.1%
143.5%
Combined 267.8% 242.8% 205.7% 169.1% 137.0% 117.1% 91.8%
147.4%
* REPORT OF THE DIRECT RESPONSE PERSISTENCY AND MORTALITY TASK FORCE TRANSACTIONS OF SOCIETY OF ACTUARIES 1993-94 REPORTS MORTALITY AND PERSISTENCY EXPERIENCE OF DIRECT MARKETED LIFE AND SUPPLEMENTAL HEALTH CONTRACTS BETWEEN 1990 AND 1992 Page 148, Table 4