Use of group discussion and learning portfolio to build
knowledge for managing web group learning
Gwo-Dong Chen ,Kuo-Liang Ou , Chin-Yeh Wang Department of Computer Science and Information Engineering
National Central University Chung-Li TAIWAN 32054 [email protected]
Abstract
To monitor and enhance the learning performance of learning groups in a web learning system, teachers need to know the learning status of the group and determine the key influences affecting group learning outcomes. Teachers can achieve this goal by observing the group discussions and learning behavior from web logs and analyzing the web log data to obtain the relevant information. However, web logs are not systematically organized and the discussions are extensive. Consequently, teachers must struggle to extract information from logs and intuitively apply teaching rules based on experience when managing the groups. Rather than using statistics packages to evaluate hypotheses, this work presents a methodology of applying existing data and text mining tools to automatically gather learning status and predict performance of learning groups from the contents of discussions, and from log records of learning behaviors. Meanwhile, the methodology infers a causal network exists between learning features and learning performance. Knowledge is inferred based on statistics and probability reasoning and social interdependency theory. The causal network can suggest means of enhancing learning performance to teachers. Simultaneously, teachers can use the knowledge of learning groups obtained to manage group learning process on the web. Experimental results of applying the novel methodology to manage a group learning class organized over the web and containing 706 students are also presented.
1) Introduction
In existing web learning systems, students may need to learn independently, without the opportunity to interact with other learning companions. Simultaneously, numerous researches have indicated that students learn better in a group [1] [2] [3]. Student learning motivation and performance may be enhanced by peer support and competitive pressure from the group [4]. Thus, the group learning mechanism can be
adopted into web learning systems to enhance learning performance.
However, to manage learning groups in a web-based system, the teachers need to expend significant effort to obtain the learning status for monitoring and guiding the learning groups. To obtain the status of the learning groups, the teachers need to collect the relevant information from the web logs that represent the history of group members actions in carrying out their assigned projects. The web logs include group portfolio and inner group discussion. Because the amount of logs is huge and is not organized to facilitate pedagogical research, teachers will find trying to manage groups by seeking meaningful and useful information from the logs a great burden. The situation is worsened by the involvement of hundreds of students in group learning and by the need to manually analyze thousands of web and discussion logs.
To facilitate the obtaining of information from the web log, web masters have developed numerous tools to enhance web performance [5]. However, these tools mostly merely summarize the access log of a website, including information such as access time, access frequencies, and the IP addresses. This statistical information is insufficient to let teachers capture the status of groups in a group learning system. What teachers really need to know is the information that can be inferred from access logs and group portfolios. For instance, teachers are interested in information such as which groups are discussing the topic of group goal [6], which groups have difficulties in learning a specific chapter, which group members are unwilling to help others [7], and so on.
One way to derive information about group learning status is to track and analyze group discussions and the behavior of individual group members in carrying out group projects. Teachers can observe the relationships among group members, and can capture the status of the group by analyzing the contents of discussions within the group and the group portfolio. After accumulating observational experience from the discussion contents of classes with the same curriculum and similar learning model, the teacher can induce heuristic rules on how to predict final group performance according to initial group behavior. Thus, the teachers can thus use past experiences to predict learning status conditions in similar groups in the future, and can then use timely intervention to enhance performance. However, in accomplishing the above, teachers face the following problems:
Thegroup’sdiscussion board willreflecttheindividuallearning statusesofthegroup’smembers.
The contents of the discussions include information about learning performance in reading curriculums, discussion of group tasks, group atmosphere, knowledge sharing, and so on. Teachers can thus capture the learning status of the group by tracking group discussions and helping groups learn. However, the contents of the discussion are always not only large in quantity but are also unorganized, making analysis difficult. Consequently, filtering out uninteresting discussion contents and extracting interesting information are key issues in tracking group discussions.
Second, discovering the important impacts of group learning status for teachers to monitor and thus manage group learning is difficult.
Teachers can estimate and infer group learning status and many other factors by tracking group discussion and portfolio. However, the discussion board and group portfolio include numerous elements, with examples including resource sharing, effective leadership, and discussion quantities. The teachers should first determine which elements significantly influence learning performance, and then focus on these factors. To locate groups needing help effectively promote performance, teachers should determine the key influences on group learning performance. However, it is difficult to obtain the causal relationship between factors and performance based on learning logs and group discussions. Therefore, how to obtain the causal relationship between learning status and factors is another key issue for teachers wishing to monitor and guide group learning in a web collaborative web learning system.
Third, predicting which groups may suffer low performance and then intervening to prevent learning failure is difficult.
After finding determining the dominant influences on the success of a learning group, teachers require a map of causal relationships within the group as a base for making decisions on teaching strategies to apply and how to guide group learning. By constructing and refining the map based on several semesters of experience, teachers can use this map of past experience to prevent a group from failing. Simultaneously, the teachers can infer information on unobservable factors from relevant data and the network of relationships within the group. A mechanism is needed to integrate individual experiences so that other
teachers or teaching assistants can share these experiences and use them to predict student performance. Consequently, the teachers can intervene in group learning in time to prevent failure.
To overcome the above problems, this investigation employed data mining techniques [8] to extract useful information from web logs and group portfolios and allow teachers to manage collaborative learning on the web. The novel methodology employs three tools to extract information to assist teachers in managing the learning groups.
1) Capture learning status by extracting the topics and summaries from the inner group discussion contents:
Text Miner, from the IBM DB2 database management system [9], is employed to identify discussion topics and extract summaries of articles. This approach allows teachers to track group discussions simply by reading the discussion topics and summaries, rather than reading through the actual articles on the discussion board.
2. Determining key influences on learning performance by analyzing the causal dependence of learning status indicators:
TheBayesianKnowledgeDiscoverer (BKD) [10], based on conditional probability and Bayesian belief network (BBN) [34], is employed to derive the causal relationships among factors and learning performance. In the derived causal network [35], BKD also extracts the conditional probability distributions of each node based on the data provided. Teachers can then monitor and predict learning status based on the BBN and can manipulate the key influence of learning performance.
3. Predict group learning performance to prevent learning failure:
The causal network built based on Bayesian belief network can be used in the RobustClassifier
(RoC) [11] to predict group learning performance based on data from discussions within the group and from the makeup of the group. The teachers then can use the tool to predict and locate the groups that are likely to experience poor learning performance. Teachers can then intervene and provide guidance to enhance the learning performance of these groups.
2. Methodological Overview
information and guide group learning. The three processes are (1) capturing learning status by tracking group discussion, (2) discovering the key influence and causal relationships by analyzing the causal relationship between learning status indicators and learning performance, and (3) intervening and preventing group failure according to predicted learning performance.
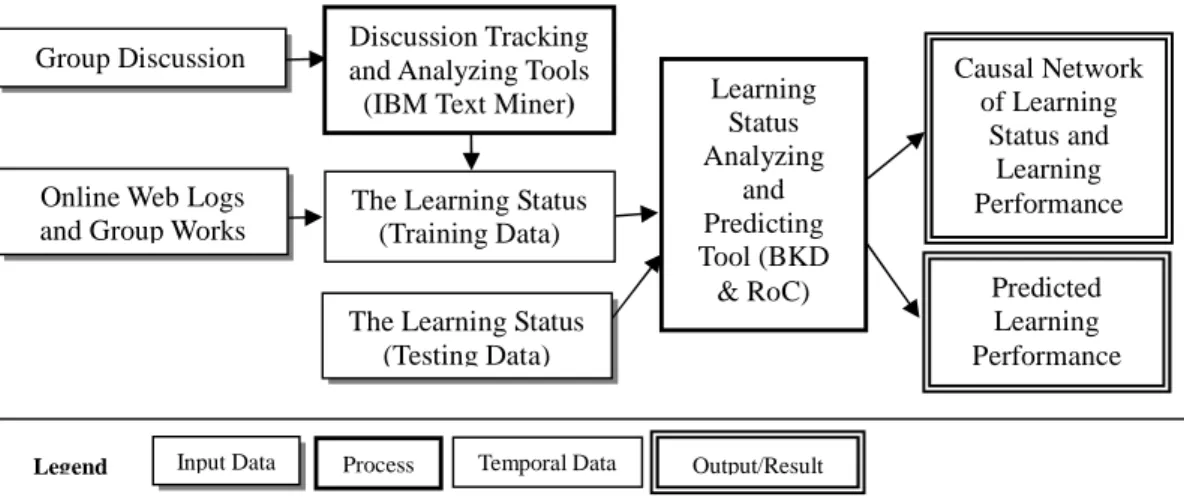
Figure 1: The process for monitoring and predicting the learning situation
To allow group discussion to be monitored, the contents of discussion were inputted into IBM Intelligent Miner for Text, and discussion topics and summaries were derived. TheIBM Intelligent Miner for Text [9] is a set of information mining [12] tools for retrieving interesting patterns and gathering information from large quantities of articles. Monitoring the discussion topics and abstracts derived byIBM Intelligent Miner for Textallows teachers to determine learning status without excessive reading.
Moreover, fully represent learning status, teachers collected web access logs and group portfolios including answers of questionnaires, and the status of the discussion. These data are treated as training data and inputted into theBayesianKnowledgeDiscoverer(BKD) [10] system. BKD is a knowledge discovery
softwaredeveloped by KnowledgeMediaInstituteoftheUK’sOpen University.BKD isan automated
modeling tool that can transform a database into a Bayesian network by seeking for the model most likely responsible for the observed data. BKD does not use conditional-independence tests but instead uses Bayesian methods [10]. BKD could establish the casual dependence network of the learning status indicators and represent the network in a graphically network according to the data in a table, with each field/attribute represented having a corresponding learning status indicator or learning performance. The
Online Web Logs and Group Works
The Learning Status (Testing Data) Learning Status Analyzing and Predicting Tool (BKD & RoC) The Learning Status
(Training Data) Predicted Learning Performance Causal Network of Learning Status and Learning Performance Group Discussion and Analyzing ToolsDiscussion Tracking
(IBM Text Miner)
Input Data Process Temporal Data Output/Result
result of applying BKD can help teachers to realize the key influences on learning performance. Meanwhile, each node in the network contains a joint probability distribution for all possible values, thus allowing teachers to obtain information on still unobservable learning status indicators by Bayesian inference from the network and data from other available learning status indicators. Microsoft Belief Network tool MSBN [15] is used herein as the inference tool.
Teachers can employ theRobustClassifier(RoC) [11] system to predict group learning performance. The RoC system is a Bayesian based classification software developed by the developer of BKD. RoC can use known learning status indicator values and performance to produce a mechanism for predicting performance. Teachers can thus predict the learning performance of groups based on existing records of learning status indicators. Thus, RoC supports teachers by giving them the information necessary to intervene in group learning and prevent poor group performance.
Bayesian net learning is a machine learning method based on the Bayes theorem [33], and was proposed in the 18th century by Rev. Thomas Bayes. The Bayesian learning method calculates explicit probability distribution for hypotheses based on given training data [13] and in some cases can competitive with other learning algorithms, including decision tree and neural network algorithms [14].
In a collaborative learning environment, each grade/category for group learning performance/status is treated as a hypothesis in the Bayesian net learning method. The Bayesian belief net builder, called BKD herein, constructs the causal net and probability distribution of the learning status indicators/performance based on the training data provided, namely records of previous class learning behavior data. With the derived Bayesian net and current student learning behavior data, Bayesian net reasoning modules such as Microsoft MSBN [15], or Bayesian classifier such as RoC, calculate the probability distribution of each hypothesis. The reasoning module then select the maximum probable hypothesis, called the Maximum a
PosterioriHypothesis(HMAP), or theMaximumLikelihoodHypothesis (HML), using evidence of currently
available attributes and the derived BBN. For example, if the module estimates the final grade probability distribution of a student under other available learning statuses as (A, 20%), (B, 78%),(C, 2%),(D, 0%), then the module predicts that the final grade of this student will be B. That is, hypothesisfinal grade = Bis HMLor HMAPamong all hypothesesfinal grade = A or B or C or D.The causal network is easy for teachers
the following features [13] of Bayesian learning methods make it adaptable for teachers wishing to manage a classroom:
1. The training examples can influence the estimated probability of a hypothesis being correct. This feature provides additional flexibility for teachers wishing to increase or eliminate a hypothesis.
2. Prior knowledge can be combined with observed data to determine the final probability of a hypothesis, allowing teachers to accumulate their teaching experience when managing the group.
3. Bayesian methods can accommodate hypotheses that make probabilistic predictions, allowing teachers to predict the present learning status of the group based on past experience.
The experimental testing of the novel method includes 7 teachers, 5 teaching assistants and 706 students. The curriculum materials were distributed to students via video compacted disc(VCD), and the class adopted a group learning strategy with a web interface for performing and recording group projects and inter and intra group discussions. The novel method captured 52 attributes. Each attribute represents a
partofagroup’slearning statuses. Thus, we called them learning status indicators. Among the 52 attributes, 44 attributes s are derived from group discussion and web logs, and other 8 attributes are from questionnaires. These learning statuses indicators are defined using Johnson and Johnson’spositivesocial interdependence, which is essential to effective group learning [20]. The analytical result reveals that the novel tools let teachers monitor and guide the collaborative web-based learning, aided by knowledge and information derived from group discussions and portfolio logs.
3.
Monitoring and Analyzing the Group Discussion
The contents of the group discussion board of a group include various subjects, such as problems in the curriculum, group goals, group task schedule, resourcesharing,and members’responsibilities,and so on. This information is important in helping teachers to determine the learning status of groups and helping their learning. However, a single discussion board often includes discussion of many subjects, some of which are trivial and unrelated to learning activities. Thus, to capture the status of groups, teachers need to expend significant effort on locating relevant on sifting the vast and disorganized discussion logs for useful information.. To capture the learning status of the group, the teachers thus need tools to assist them
in tracking the group discussion and extracting important information from the discussion board. This section illustrates the tools that teachers use to extract this information from the discussion board and thus monitor the learning status of the group.
3.1 Extracting the discussion topics
One sentence of a discussion, the topic sentence, generally contains the most important information in the article. The topic sentence may be represented by the most keywords. Thus, the first step of tracking the discussion is to classify them into topics by analyzing the occurrence, position and frequency of keywords. The IBM Intelligent Miner for Text supports several tools that help users extract information from text-mode data. Herein, the Text Analysis tools [9] of the IBM Intelligent Miner for Textare employed to help teachers analyze inner group discussion articles and thus determine group learning status.
Five types of Text Analysis tools exist, outlined briefly below:
1) Language Identification: Automatically identifies the language in which a document is written. 2) Topic Categorization: Automatically assigns documents to predefined categories, topics, or
themes. Teachers can then capture the learning status of the group by reading articles in specific categories. For example, an increasing number of articles in the group conflict [16] category indicates a high possibility of group conflict existing.
3) Feature Extraction: Automatically recognizes significant vocabulary items in a text, and classifies the documents into appropriate categories without the need of using a predefined vocabulary. Teachers could extract out the interesting information from discussion topics.
4) Clustering: Automatically groups collections of similar documents, allowing teachers to seek groups that may reflect similar learning status and then help these groups together.
5) Summarizer: Analyzes the sentences in a document as a basis for producing a summary. Teachers can then capture the learning status of the group by reading summaries of discussion instead of reading the entire articles.
This investigation uses the topic categorization tool to extract the discussion topics of groups, and then uses the summarizer tool summarizes group discussions. For example, the following sample sentence
Dear teammates:
I am sorry to be late for the on-line conference of our group this morning. I have a question and need a favor from you. In the chapter 4, page 45, teachers have illustrated last week. Can anybody kindly tell me the purpose of a member function in an object in the object oriented programming language?
Michael Chen
To categorize discussions by topic, teachers must first define a set of interesting discussion categories. Example categories include inquiries about system usage, gossip among members, questions about the context of a specific chapter, and so on. The categories listed in theTopic Categorization toolrepresent the topics of interest to the teachers. For each discussion article, theTopic Categorization toolassigns a score for each of the categories, and will usually classify the article under the category for which the highest score is obtained. This approach helps teachers to classify the discussion into predefined discussion categories. To define the categories, teachers must first train the Topic Categorization tool with several sample discussion articles, after which the Topic Categorization tool will generate a category schema. The tool can then be used to categorize the discussion articles
BecauseIBM Intelligent Miner for Text does not support Chinese, a similar text classification tool using TFIDF [17] is employed herein [18]. All the examples in this paper are translated from Chinese to English for illustration. Teachers could recreate the experimental results reported herein under the support of tools such asIBM Intelligent Miner for Text.
MichaelChen’sdiscussionscan betaken asan example.Theteachersfirstused severaldiscussion in
thecategory “Question forChapter4”astraining samplesusing thekeywords:what,source code,member function,object, andobject oriented programming language. Most of the keywords are curriculum related, and are aimed to let the teachers know which curriculum areas the groups are focused on. The topic categorization tool then classifies all the discussion articles according to keyword type, frequency, and position.Theexample discussion isassigned thehighestscoreto thecategory “Question forChapter4”. Table 1 lists the categorization and output file obtained from applying Text Analysis Tool to the above example.
Category List Ranking Score
Question for Chapter 1 0.421165
Question for Chapter 2 0.200785
Question for Chapter 3 0.212877
Question for Chapter 4 0.554322
Inquiry for system and environment 0.287286
Gossips discussion 0.336911
… …
Table1.Thecategory resultand outputfileofMichaelChen’sdiscussion
Table 1 lists the scores in defined categories generated by Text Analysis Tool for the example
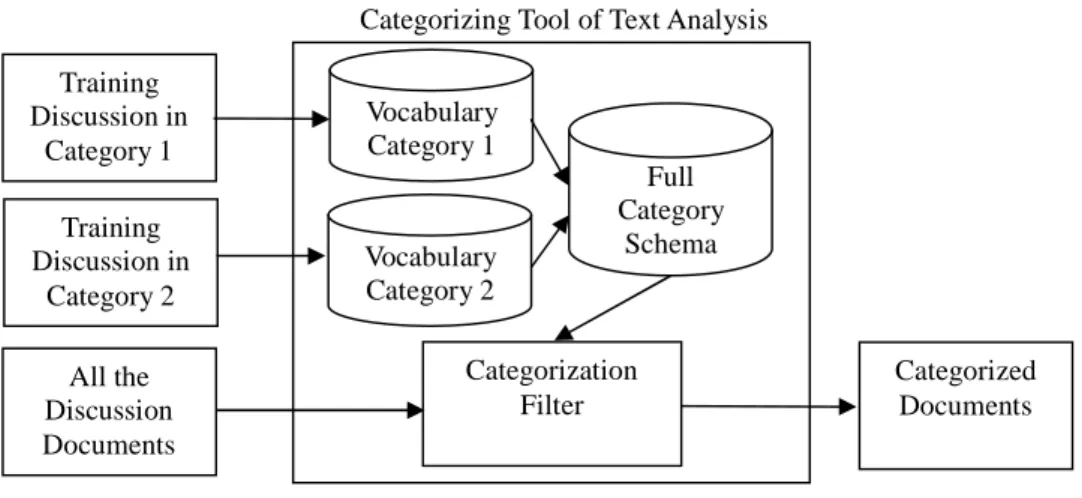
discussion. In table 1, the example discussion was categorized into “Question for Chapter 4”.Text Analysis Toolhelps teachers to partially capture the learning status of a group, for example finding whether a group has problems in understanding chapter 4. The following figure illustrates the steps involved in training the discussion topic categories and categorizing the discussions in the IBM Intelligent Miner for Text:
Figure 2. Training and Filter in the Categorizing Tool
3.2 Summarizing the discussion of a group
After classifying the discussions, the teachers may need to read the discussions and their contents to monitor the learning statuses of a group. However, the discussions can be very long and their contents irrelevant. Consequently, teachers summarize each discussion by locating the important sentences in each article, and then combining these sentences to summarize the article. The teachers employ Text Analysis tools such asIBM Intelligent Miner for Textto summarize the discussion and capture the learning status of
Categorizing Tool of Text Analysis Training Discussion in Category 1 Training Discussion in Category 2 Vocabulary Category 1 Vocabulary Category 2 Full Category Schema All the Discussion Documents Categorization Filter Categorized Documents
a group.
Forexample,theTextAnalysistoolsextractthefollowing sentenceasthesummary ofMichaelChen’s
discussion:
What is the purpose of a member function in an object in object oriented programming language?
Other sentences in the example discussion are filtered out, allowing teachers to more easily capture the learning status of the group. That is a member of the group has difficulty in understanding the term
“member function”in an object oriented programming language.
The categorization and summaries extracted from the discussion board assist teachers in capturing the current learning status of the group. These learning statuses help teachers to intervene in group learning and enhance learning performance. Furthermore, these learning statuses are important information that helps teachers to discover the causal network of influence on learning performance and predict the influence on learning performance, which will be described in the following two sections.
4. Discover the Causal Dependence net of Group social interdependency
factors and learning status indicators
The aims of discovering the causal dependency net include (1) to find the key influences on final group performance, (2) to find a way for teachers to locate the group most likely to suffer low learning performance, (3) to suggest ways for teachers to enhance the performance of a learning group by manipulating important learning status indicators, (4) to provide a way to determine unobservable factors influence the learning performance based on available observed factors. Thus, the teachers can know how to apply appropriate strategies to enhance learning performance of a group by monitoring and manipulating the key influence factors, learning status indicators, such as the status of working on group project. Simultaneously, teachers can learn from the joint probability among these factors and learning performance, guiding them in applying strategies to promote the factors and thus enhance group learning.
The previous section describes how learning status can be obtained from discussion contents. Additional learning statuses can be derived from group activity behavior that is recorded in the web logs
login frequency, reading path, page reading count, and so on. Meanwhile, the group portfolio is a history of
thegroup’sactionsand outcomesduring theperiod in which thegroup wasperforming thetasksassigned
to it. The portfolio includes the outcomes of tasks assigned to the group, amount of resources shared among group members, and the role assigned for each member.
To enhance group learning performance, teachers need a tool to determine the major dominant influences that can improve group performance from the causal network of the learning status indicators. TheBayesian Belief Network(BBN) [19] is a directed graph comprising nodes and arcs that represents the causal relationships [35] between learning status indicator attributes. This section demonstrates the BBN analyzing tool that helps teachers determine learning status based on the group activity status.
4.1 Group learning status represented in a Bayesian Belief Network
BBN is a directed graph comprising several nodes and arcs. The nodes represent learning status indicators, while the arcs represent that there is a causal dependency between two learning statuses [13]. For example, the status working on group project will influence the status group final grade. BBN is widespread in many fields for representing causal relationships among variables. Each node in BBN also stores the probability distribution of possible values of the node over all the possible value combinations of the variables in the source nodes of the incoming edges of the node. In an educational environment, the
nodes represent the indicators of the group’s learning status, while the arcs represent the causal
relationships among two or more learning status indicators/outcomes. Our novel methodology uses the BKD tool to create BBN from learning status indicators and outcomes that are derived from the discussion board and the group portfolio. BBN assists teachers in deriving the causal relationships between the learning status indicators. Teachers can then use BBN to enhance learning performance and prevent group learning failure.
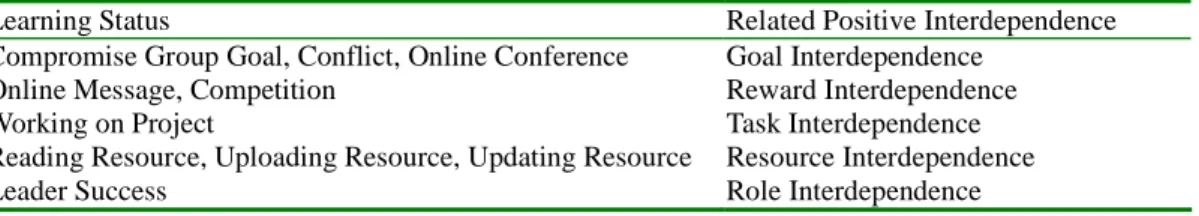
Table 2 lists some of the learning status indicators that teachers use to monitor and analyze relationships among the groups. The learning status indicators are defined according positive social interdependence, as proposed in [20]. In the above example, teachers try to determine the relationships among positive social interdependence and the group learning achievement. The categories defined by
reward interdependence), andmean interdependence(task, resource and role interdependence).
This study defines a list of group learning status indicators that can be extracted from the group discussion board and group portfolio. The group portfolio includes answers to online questionnaires. The group learning status indicators include Compromise Group Goal, Online Conference, Conflict, Online MessageandCompetition.
Compromise Group Goal, Online Conference and Conflict are of the goal interdependence.
Compromise Group Goalis the degree to which the group compromises on its group goals. Conflictis the frequency of conflicts during discussions on reaching a compromise reaching the group goal. Finally,
Online Conferenceis the frequency with which group members use real time discussion boards for group discussions.
Online Message and Competition are of the reward interdependence. Online Message is the frequency with which group members help other teammates to increase the rewards of the group. Finally,
Competitionis the frequency of competition with other groups.
Working on Projectis the task interdependence, and is represented by the time group members spend working on group tasks.
Reading Resource, Uploading Resource and Updating Resource are of source interdependence, and are represented by the reading, sharing, and updating frequency of members on the group resource space.
Leader Success is of the role interdependenceand isrepresented by thegroup leader’scapability in fulfilling her/his duties.Graderepresents the grades of the group.
Learning Status Related Positive Interdependence
Compromise Group Goal, Conflict, Online Conference Goal Interdependence
Online Message, Competition Reward Interdependence
Working on Project Task Interdependence
Reading Resource, Uploading Resource, Updating Resource Resource Interdependence
Leader Success Role Interdependence
Table 2. The partial learning statuses related to positive interdependences
TheConflictnode represents the frequency of conflict in each group discussion board. Working on Project, Reading Resource, Uploading Resource, Updating Resource, Online Message and Competition
nodes represent the frequency with which these actions occur in the web logs and group portfolio.
The articles in the discussion board are first categorized using the text categorization tool, and information of interest is then extracted from the discussion board on the basis of the classification. For
example, the frequency of conflict is measured as the number of articles categorized as dealing with conflict that occurring within a defined period.
The Leader Success and Compromise Group Goal nodes are derived based on the relevant answers obtained from questionnaires.
Gradewas based on the examination results. All of the learning statuses indicators are inputted into BKD to construct a causal network.
4.2 Observing group learning status and discovering the key influence on learning performance by BKD
BKD is a knowledge discovery tool that can extract usable knowledge from databases without requiring users to have a background in statistics and programming. BKD uses BBN to graphically represent the causal network of learning status indicators and outcome. Once the BBN is constructed from the database, the network can be used in a BBN reasoning system to provide information for teachers, including observations, predictions and support for decision-making.
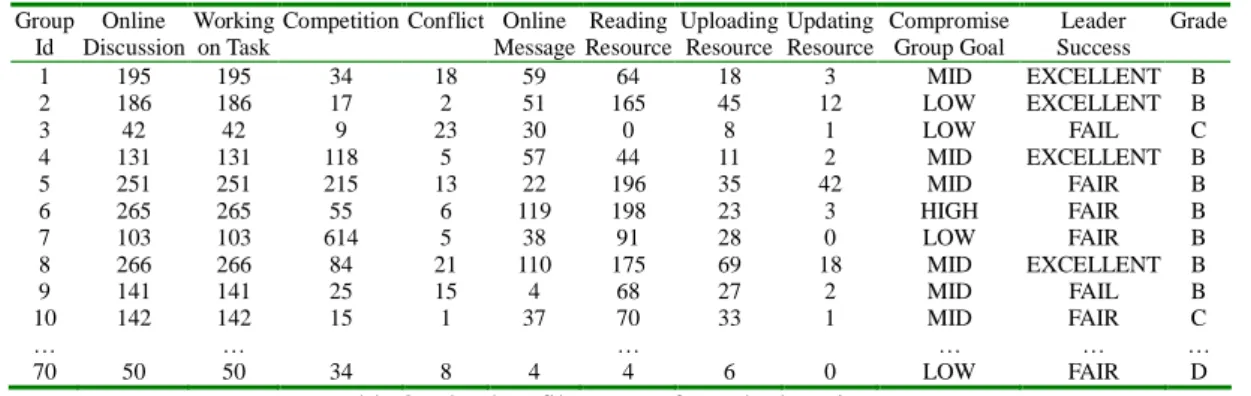
BKD needs a text file to be exported from a database to construct BBN, and this input data can be numeric or discrete data [21]. Table 3 lists 70 groups in each class. All the values are derived from the discussion contents, group portfolio, web logs, and questionnaires. Various quantity attributes/learning status indicators that are extracted from the web logs are converted into three levels (HIGH-MID-LOW, and so on) so that they can be used to predict other attributes, learning status indicators, and learning outcome. Group Id Online Discussion Working on Task
Competition Conflict Online Message Reading Resource Uploading Resource Updating Resource Compromise Group Goal Leader Success Grade 1 195 195 34 18 59 64 18 3 MID EXCELLENT B 2 186 186 17 2 51 165 45 12 LOW EXCELLENT B 3 42 42 9 23 30 0 8 1 LOW FAIL C 4 131 131 118 5 57 44 11 2 MID EXCELLENT B 5 251 251 215 13 22 196 35 42 MID FAIR B 6 265 265 55 6 119 198 23 3 HIGH FAIR B 7 103 103 614 5 38 91 28 0 LOW FAIR B 8 266 266 84 21 110 175 69 18 MID EXCELLENT B 9 141 141 25 15 4 68 27 2 MID FAIL B 10 142 142 15 1 37 70 33 1 MID FAIR C … … … … 70 50 50 34 8 4 4 6 0 LOW FAIR D
Table 3: The data file extract from the learning statues
BKD derives the causal relationships between learning status indicators, but becomes inefficient if the learning status indicators continue to increase. The major reason for this phenomenon is that BKD
needs to find relationship among learning status indicators trying all possible pairings. This research spent over an hour analyzing the causal relationships between all 52 of these learning status indicators. For the sake of efficiency and readability, the novel methodology uses the factor analysis of SPSS [22] to reduce the number of variables. Following the Kaiser [23] varimax factor analysis, the 52 attributes can be reduced to 11 rotated components (λ1 ,cumulative variance=77.737%), simplifying the causal
relationship construction for BKD. The teachers can use the factor analysis tool of SPSS to cluster all learning status indicators into components. In order to estimate group final grade, the teachers could select the set of learning status indicators that are of the same a component with group final grade. Then, they can use BKD to build the causal relationship between the selected indicators f andgroup final grade.
After importing the table into BKD, a BBN of the causal relationships and associate probability
distributions will be constructed. Figure 3 illustrates one of the BKD results of the “Introduction of
Computer Network and Application” course. In this figure, the nodes represent the learning status
indicators, while the arcs represent the causal relationships among the nodes. This figure will support teachers in observing the learning status of the group and make instructional decisions to assist and enhance group learning performance.
Teachers observed two kinds of BKD results:
1) Enhance a set of learning status indicators by determining the learning status indicator that affects most of them
Forexample,theBBN in Figure3 illustratesthatthe“Working on Project”learning statusmay influencethethreelearning status:“Reading Resource”,“Uploading Resource”,and “Grade”.
Accordingly, if group members frequently work on the group project, they are prefer reading the group resources, to share their resource with the members. Meanwhile, the group grade also has high probability affected by this frequency. Thus, if the teachers wish to enhance the frequency of sharing resource and enhance the group grade simultaneously, they should encourage group members to frequently engage in group tasks.
2. Enhance learning status by determine the learning statuses that influence it
For example, the BBN in Fig. 3 illustrates that the frequency of “Online Discussion” is
Resource”isin turn affected by thefrequency of“Working on Project”.Thus,teacherscan thus
probably promote discussion within a group (Online Discussion) by encouraging members of the group to work on the group project (Working on Project)
Figure 3: The example of Bayesian Belief Network
In the BBN derived by BKD, presented in Fig. 3, each node contains a probability distribution table that represents the probability distribution of all value combinations for each possible value of the node.
Meanwhile,Table4 liststheconditionaldistribution of“Grade”nodesthatdepend on the“Working on
Project”node. Thefrequency of“Working on Project”isdivided into levels by BKD: 11-75, 75-181, 181-265 and 265-478, and the table thus contains four rows, one corresponding to each level. The group grade can have 4 possible values, A, B, C, and D, ranging from excellent to a fail. Grade A represent group grades that exceed the average by one standard deviation, grade B represents group grades that exceed the average by less than one standard deviation, grade C represents the group grades are below the average grade by less than one standard deviation, and grade D represents group grades that are below the average grade by more than one standard deviation. The first column of table 4 is the values ofworking on project
attribute. The other columns show the probability of group final grade(for the value indicated in the first row) for the correspondingworking on project ( for the vlue indicated in the first column). For example,
ifthedegreeof“Working on Project”is 181-265 , there is a 0.931 probability (93.1%) that the group will
receiveaB grade.Meanwhile,ifthefrequency of“Working on Project”is11-75, the group has 0.699 probability (69.9%) of receiving D grade.
Table 4: The probability table of Grade learning status
The BKD system can assist teachers in deriving the causal relationships among learning status indicators and outcome. Teachers can thus help a group to improve group learning performance by enhancing the status that will influence group performance. For example, encourage group members to
work on the group project will improve the group performance.. After several semesters, the results of applying BKD could be used to predict learning status for different teachers, as will be described in the following section.
5. Predicting group performance from initial group discussions and
portfolio
The causal network and probability distribution constructed by BKD are important teaching experiences for teachers. Moreover, these relationships are presented in a graphical form that is easy for different teachers to understand and exchange. However, these teaching experiences do not support predictions of group learning performance. The teaching experience and help teachers predict learning performance, tools to assist teachers to accumulate past teaching experience are necessary, along with tools for predicting group learning performance early in a class.
Predicting learning performance is intended to locate groups destined to fail. For example, if the BKD causal net of past experience infers that a group is going fail, the teacher should intervene in the group to enhance associate learning statuses.
A Bayesian classifier RoC is adopted herein to predict the eventual group performance by using data taken early on in a class. The prediction involves two phases: training and prediction. First, RoC is used to produce a prediction scheme from learning statuses and the target valuegroup final gradeof a previous
class. RoC then uses this prediction scheme to predict the final grades of groups in the current class based on available learning statuses before the final grades of the groups are known.
Four steps are involved in applying RoC to predict learning performance: 1) Define the Bayesian classifier (prediction scheme) from a database:
The input of the RoC is the set of attributes that are indicators of learning statuses derived from discussion, web log, and group portfolio. Table 3 illustrates an input file to RoC. The file format is as in BKD system, with the first row showing the attribute names, while the other rows list the values of corresponding attributes. The values can be numerical or categorical. 2) Class selection:
Select one of the learning status indicators as the class, that is, the target attribute being predicted. The class in RoC represents the attribute that the teachers want to predict. Before predicting evaluation data, the RoC system generates a classifier from learning data for the selectedclass.
3) Learning the BBN:
RoC automatically learns a prediction model from thelearning data, and then determines the dependence and probability distribution among the attributes (learning status indicators). The output of this step is called the classifier, and supports teachers’ predictions of learning
performance evaluation data in the following step. 4) Predicting learning performance:
Once theclassifierhas been trained, current learning groups can be classified into aclass. The classifier generated by RoC classifies current groups and predicts their grades.
The current experiment involves 706 students and 70 groups. Each group collaboratively learns the same curriculum on web. The teachers collected 52 learning status indicators, defined based on the basis of
Johnson’spositivesocialinterdependence[20].Herein, teachers collect these learning statuses based on
justonecoursefrom each semester.Thus,the“leave-one-out”crossvalidation method [32]isemployed to demonstrate the prediction capability of the RoC system. The following paragraph illustrates the
“leave-one-out”method ofRoC prediction:
data for constructing the classifier. All attributes are clustered into components by factor analysis tool of SPSS. In our experiment, we only select the attributes that are of the same component with group final grade.
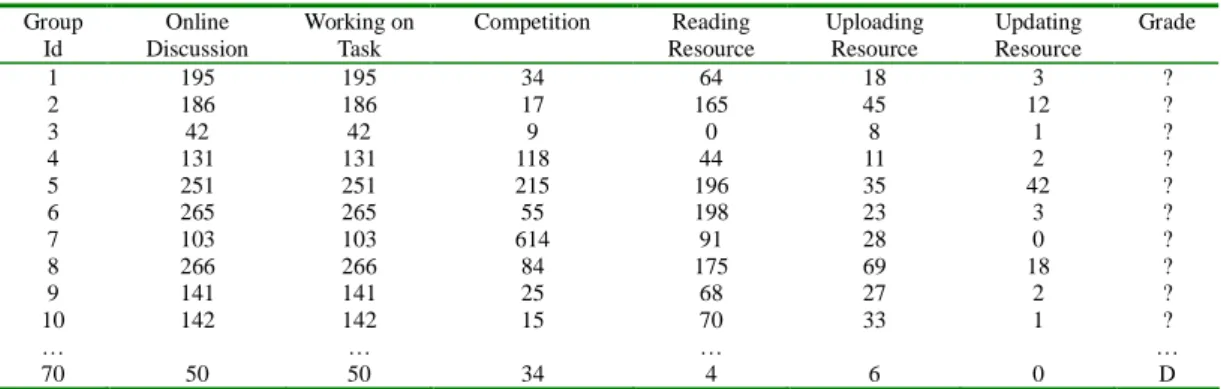
Step2. Select one of the learning status indicators of input data as theclass. For example in Table 5, the teachers attempt to determine which group will have lower grades at the end of the semester, and thus the Grade was selected as theclass.
Step3. Select some of the groups as the evaluation group, and define the others as training groups. For example in Table 5, the evaluation group is groups 1 to 10, and the grade value of the evaluation
group ismarked as“?”forpredicting RoC.Theevaluation groupsareused to evaluatethe accuracy
of the classifier.
Step 4. Discover the rules of the training data and predict the class value of the evaluation group. Table 6 lists predicted results for groups 1 to 10.
Step 5. Repeat steps 1 to 4, using different sets of ten groups as the evaluation data until the class
value of all of the groups has been predicted. Table 7 lists the predicted results following 7 predictions. Group Id Online Discussion Working on Task Competition Reading Resource Uploading Resource Updating Resource Grade 1 195 195 34 64 18 3 ? 2 186 186 17 165 45 12 ? 3 42 42 9 0 8 1 ? 4 131 131 118 44 11 2 ? 5 251 251 215 196 35 42 ? 6 265 265 55 198 23 3 ? 7 103 103 614 91 28 0 ? 8 266 266 84 175 69 18 ? 9 141 141 25 68 27 2 ? 10 142 142 15 70 33 1 ? … … … … 70 50 50 34 4 6 0 D
Group id Predicted Grade Grade Probability of Grade A Probability of Grade B Probability of Grade C Probability of Grade D 1 B B 0.049 0.730 0.213 0.007 2 B B 0.018 0.901 0.079 0.001 3 D C 0.011 0.006 0.472 0.611 4 C B 0.250 0.246 0.450 0.054 5 B B 0.006 0.938 0.055 0.000 6 B B 0.024 0.832 0.141 0.002 7 C B 0.258 0.367 0.348 0.028 8 B B 0.007 0.974 0.019 0.000 9 B B 0.142 0.513 0.342 0.003 10 C C 0.172 0.343 0.464 0.021 Correct: 8 Incorrect: 2 Accuracy: 80 % Coverage 100.0 %
Table 6: The output file of predicted result
In Table 6, the coverage shows that all cases of evaluation data are predictable in RoC. The column
“Grades”representstheoriginalgradevaluesofevaluation data,whilethecolumn “Predicted Grade”is
predicted by RoC using the input data from Table 5. The system predicted that group 1 would obtain a Grade B at the end of the semester, and this prediction was proved correct. However, the predictions of
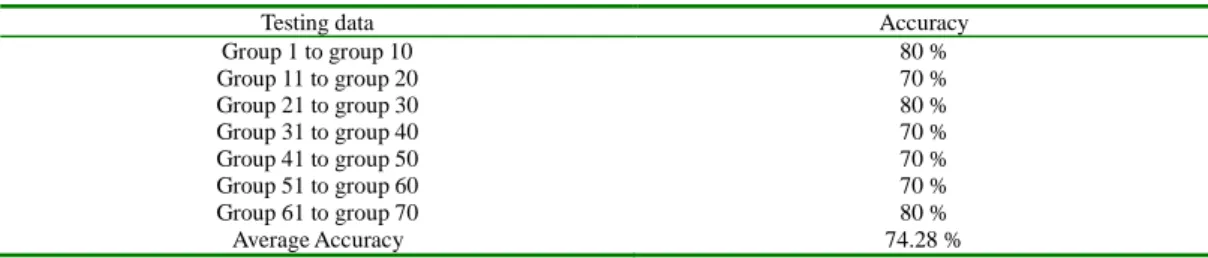
groups3 and 7 werein correct.Thecolumn “Probability”representstheprobability ofaparticulargroup obtaining each grade value. In this experiment, the predictions were found to be 80% accurate (8 correct, 2 incorrect). Meanwhile, Table 7 displays that after running 7 predictions for each testing data, the average accuracy was 74.28%, sufficient for teachers to use to predict the group learning status.
Testing data Accuracy
Group 1 to group 10 80 % Group 11 to group 20 70 % Group 21 to group 30 80 % Group 31 to group 40 70 % Group 41 to group 50 70 % Group 51 to group 60 70 % Group 61 to group 70 80 % Average Accuracy 74.28 %
Table 7. The 7 times of prediction for Grade value and the accuracy
RoC can be used to predict not only Grades but also all other group learning statuses.
6. Experience and Discussion
Ourexperimentwasperformed on the“Introduction ofComputerNetwork and Applications”course,
and took place in a web learning environment. The curriculum included some fundamental concepts of computer networks, and the programming language/application for constructing WWW pages such as
TCP/IP, Network security, HTML, JavaScript, FrontPage, and so on. Meanwhile, data mining tools, Text Analysis Tool, BKD, and RoC, were employed to extract information to assist teachers to track group discussions, observe group learning status, and illustrate causal relationships between leaning statuses. This information helps teachers to prevent groups from failing
The following table shows the issues investigated herein, along with the associated methods, or tools adopted for solving the issues.
Tasks Input Data Tools Output Data
Capture the learning status by extracting a topic and abstract from group discussions
Discussion contents Text Analysis Tool Group status Discussion Status
Discover important influences on learning performance by
analyzing causal dependence of the learning status
Discussion status, web logs, questionnaire answers The Bayesian Knowledge Discoverer (BKD) BBN of learning statuses indicators
Predict learning performance to prevent groups from suffering low performance
Learning statuses and learning performance of previous classes, learning statuses of current class
The Robust Bayesian Classifier (RoC) Final prediction of group learning performance
Table 8: The input/output data and tools of three primary tasks when teachers extract learning information and guide group learning
6.1 The participants and the grouping on web
The participants included 7 teachers, 5 teaching assistants and 706 students at National Central University, Taiwan. 459 (65.0 %) of the students were male, and 247 (35.0 %) were female. The average age was 32.38. After spending a month familiarizing themselves with the learning environment, the students were systematically grouped into several heterogeneous groups [25]. The grouping criterion included personal profile and thinking style, with the personal profiles including gender, age, area of residence,education and so on.Theteachersselected thestudent’sthinking styleasthemajorconcern for grouping. Herein, teachers categorized students according to 13 thinking styles, as proposed by Dr. Sternber, namely [26]: legislative, executive, external, judicial, monarchic, hierarchic, oligarchic, anarchic, global, local, internal, liberal, and conservative. Herein, each group is grouped according to the specification given by the teacher. There are 70 groups. Each group containing 10 to 11 students.
The students read the curriculums on video compact discs (VCD). After reading the curriculums, the students must register with the NCUVC web collaborative learning system [28] [29], which supports a peer
interaction space [29][30], collaborative project space, resource sharing space, and so on. The first group task is to elect a group leader, co-leader and reporter. The group private working space included online and offline discussion rooms, a resource sharing space, a portfolio space [31], a project scheduler, and a window for querying member working status.
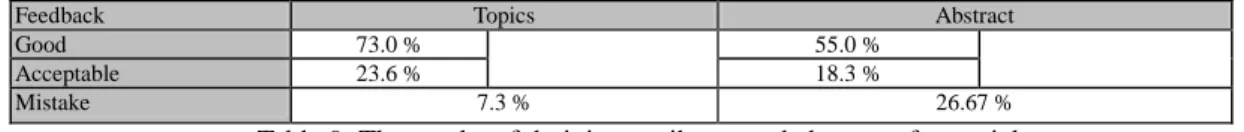
6.2 The results of Monitoring group discussions
The total number of discussion herein is 9118. The teachers defined 25 interesting discussion categories, and selected 25% of the articles as the training data. The teachers immediately assigned one of three —grades, Good, Acceptable, and incorrect, to the analyzed result. The analytical results reveal that 96.6%, and 73.3% of the abstracts received grades of Good and Acceptable, respectively. Furthermore, the longer of an article is, the better the grade it receives. Table 9 illustrates the derived results and teacher feedbacks:
Feedback Topics Abstract
Good 73.0 % 55.0 %
Acceptable 23.6 % 18.3 %
Mistake 7.3 % 26.67 %
Table 9: The results of deriving attributes and abstract of an article
Part of the reasons that cause the incorrect categorization and summarization are listed as follows: :
1) Adages: Some adages are not considered by the teachers and are excluded from the keywords database. These adages could not be derived from articles but are important in the discussion articles.
2) Mistyped keywords: If keywords in articles were mistyped, the system was unable to locate and properly classify them.
3) Program source codes: The program structure could not be derived from keyword retrieval. 4) Short discussion articles: Short discussions contained few representative keywords and
sentences.
6.3 Predicted results for the flunked groups
The classifier produced by RoC system can assist teachers in predicting the final performance of groups. In our experiment, the prediction accuracy achieved herein for predicting performance was 74.28%. Actually, the teachers are more interested in finding the groups that may have poor learning performance or
be flunked. Thus, they can help these groups to improve their learning. Table 10 shows the results of predicting the flunked groups.
Group Id Predicted Result Probability for Predicted Result
11 D 0.942 14 D 0.942 22 D 0.967 30 D 0.967 39 D 0.970 42 D 0.986 47 B 0.630 54 D 0.986 61 D 0.925 62 D 0.925 63 D 0.925 67 D 0.888 68 D 0.867
Accuracy for flunk 92.30 % Table 10. The predicting results and accuracy for flunk groups
Table 10 showed that 12 of the failed groups out of 13 groups were predicted correctly. The learning statuses and final grades of the flunked groups are shown in Table 11.
Group Id Online Discussion Working on Task Competition Reading Resource Uploading Resource Updating Resource Grade 11 2 16 1 2 1 0 D 14 3 30 0 1 1 0 D 22 3 26 1 2 1 0 D 30 2 46 2 5 1 0 D 39 4 37 1 3 6 0 D 42 2 24 0 0 4 0 D 47 15 94 12 10 1 1 D 54 2 43 0 1 1 0 D 61 3 11 0 2 2 0 D 62 3 37 1 1 1 0 D 63 1 70 1 1 1 0 D 67 5 11 0 1 1 0 D 68 2 50 0 1 1 0 D
Table 11. The extract of learning status of flunked groups
Thus, teachers could focus on this group in Table 11 to determine why these groups failed.
7. Conclusion
To assist teachers in monitoring and guiding group learning, this work presented the methodology for deriving knowledge for observing group status, discovering the key influence of group performance, and the rule to predict learning performance. The Bayesian method is an efficient way to achieve the above goals. Without the proposed mechanisms, teachers must spend considerable time in trying to infer group status from vast unorganized web logs. The causal relationships of group learning situations are hard to
track.In traditionalapproaches,group learning situation have to bedetermined based on theteacher’s
helped teachers to track discussion of group, derive the discussion attributes and extract the abstract; (2) supported the graphical BBN for monitoring the learning status and discovering the causal relationships and key influence on web collaborative learning; and (3) predicted the learning situation successfully before the end of the semester based on the online learning situation and experience from the previous semester.
Observation and monitoring thegroup’s learning situation helps teachers to determine instructional strategies and group learning performance. The advantages of feature space and BBN help teachers to observe learning performance and analyze the influence of learning situation. Learning status is constructed as a hierarchical graph and teachers can easily and meaningfully define features via the instructional domain knowledge. The BBN illustrates the causal network of learning situations. Past experience of monitoring and guiding allows teachers to predict the learning situation before the end of the semester. Teachers could thus intervene in group learning to prevent group failure.
Finally, the experimental result confirms that teachers could successfully and efficiently monitor and guide a collaborative on-line learning program involving 706 students.
Acknowledgement
The authors would like to thank the National Science Council and Ministry of Education of the Republic of China for financially supporting this research under Contract No. NSC88-2520-S-008-002 and Contract No. 89-H-FA07-1-4.
Reference
[1] D.W. Johnson, and R.T. Johnson,Learning together and alone (5th ed.). Allyn and Bacon Publishing, Massachusetts, USA, 1991
[2] B. Collis, T. Andernach, and N. Van Diepen, Web Environments for Group-Based Project Work in Higher Education. International Journal of Educational Telecommunications. No.3 Vol.2 pp.109-130, 1997.
[3] P.G. Shotsberger, K.B. Smith, and C.G. Spell, Collaborative Distance Education on the World Wide Web: What Would That Look Like?,Proceeding of the First Computer Support for Collaborative Learning,(eds. John L. S., and Edward L. C.) pp.312-316, 1995.
[4] J.S. Thousand, R.A. Villa, and A.I. Nevin,Creativity and Collaborative Learning- a practical guide to empowering students and teachers. Paul H Brookes Publishing, Baltimore, MD. USA, 1994.
[5] O. Zaïane, M. Xin, and J. Han, Discovering Web Access Patterns and Trends by Applying OLAP and Data Mining Technology on Web Logs.Proceedings of Advances in Digital Libraries Conference (ed. R.S. Terence), 19–29.IEEE Press, Los Alamitos, CA, USA,1998.
[6] D.W. Johnson, and R.T. Johnson, Meaningful and Manageable Assessment through Cooperative Learning.Interaction Book Company, Minnesota, USA, 1996.
[7] D. M. Adams, and M.E. Hamm,Cooperative Learning, Critical Thinking and Collaboration Across the Curriculum,Charles C Thomas Publisher, 1990.
[8] U. Fayyad, G. Piatetsky-Shapiro, and P. Smyth, From Data Mining to Knowledge Discovery: An Overview.In Advances in Knowledge Discovery and Data Mining,Fayyad et. al. (Eds.) MIT Press, 1996. [9] D. Tkach, Text Mining Technology–Turning Information Into Knowledge.A White paper from IBM. URL is http://www-4.ibm.com/software/data/iminer/fortext/library.html), 1998.
[10] M. Ramoni, and P. Sebastiani, Discovering Bayesian Networks in Incomplete Databases, Technical Report KMi-TR-46, Knowledge Media Institute,The Open University, March, 1997.
[11] M. Ramoni, and P. Sebastiani, An introduction to the Robust Bayesian Classifier. Kmi Technical Report Kmi-TR-79,Knowledge Media Institute,The Open University, Milton Keynes, 1999.
[12] R. Baeza-Yates, and B. Ribeiro-Neto,Modern Information Retrieval.ACM Press, New York, 1999. [13] T.M. Mitchell, Bayesian Learning, Machine Learning The McGraw-Hill Companies, pp.154-200,
1997.
[14] D. Michie, D.J. Spiegelhalter, and C.C. Taylor,Machine learning, neural and statistical classification, (edited collection). New York: Ellis Horwood,1994.
[15] MSBN (Microsoft Belief Network Tools) developed by Microsoft, URL is http://www.research.microsoft.com/research/msbn/.
[16] B.B. Bnuker, and J.Z. Rubin,Introduciton–Conflict, Cooperation, and Justice. Conflict, Cooperation, and Justice.(Eds. Rubin, J.Z.) Joeesy-Bass Publishers, San Francisco, 1995.
[17] G. Salton, and C. Buckley.Text Weighting Approaches in Automatic Text Retrieval. Cornell University Technical Report 87-881, 1987.
[18] J.X. Shi,The Chinese Full Text Retrieval Tools for Network Information and Learning System.Master Thesis of National Central University, 2000.
[19] A.S. Gertner, C. Conati, K. VanLehn,Procedural Help in Andes: Generating, Hints Using a Bayesian Network Student Model.AAAI/IAAI, pp. 106-111, 1998.
[20] D.W. Johnson, and R.T. Johnson, Cooperation and Competition: Theroy and Research. Interaction Book Company. Minnesota, USA, 1989.
[21] P. Spirtes, and C. Meek, Learning Bayesian Networks with Discrete Variables from Data.Proceeding of Knowledge Discovery and Data Mining 1995.
[22] SPSS developed by SPSS Inc.,URL is http://www.spss.com/
[23] H.F. Kaiser, The varimax criterion for analytic retation in analysis.Psychometrika, 23, 187-200,1958. [24] P. Langley, W. Iba, and K. Thompson, An analysis of Bayesian classifier. In Proceedings of the National Conference on Artificial Intelligence,pp 223-228, 1992.
[25] G.D. Chen, K.L. Ou, and C.C. Liu, Instructional Instruments for Grouping, Intervention, and Strategy Analysis on Web Group Learning Systems. Proceeding of International Conference on Compters in Education 99, Chi-ba, Japan, 1999.
[26] R. Sternberg,Thinking Styles ,Cambridge University Press,1997.
[27] K.L. Ou, G.D. Chen, and B.J. Liu, A Group Learning Environment in a Virtual Classroom Built on WWW.Proceeding of 6th International Conference on Computer Assisted Instrution, 1997
[28] C.C. Liu, G.D. Chen, K.L. Ou, B.J. Liu, and J.T. Horng, Managing Activity Dynamics of Web Based CollaborativeApplications. International Journal of Artificial Intelligence Tools,Vol. 8, No. 2, 2000. [29] K.L. Ou, C.K. Chang, and G.D. Chen, Web-based Asynchronous Discussion System. Internatinoal
Conference on Computers in Education, 1998.
[30] N.M. Webb, Peer interaction and learning in small groups. International Journal of Educational Research, 13(1), pp. 21-29,1989.
[31] C.K. Chang, G.D. Chen, K.L. Ou, and B.J. Liu, Student Portfolio Analysis for Decision Support of Web-Based Classroom Teacher by Data Cube Technology.Proceeding of ED-MEDIA/ED-TELECOM 1998
[32] M. Plutowski, S. Sakata, and H. White, Cross-Validation Estimates Integrated Mean Squared Error," in J. Cowan, G. Tesauro, and J. Alspector, eds.,Advances in Neural Information Processing Systems6. San Francisco: Morgan Kaufmann, 391-398, 1994.
[33] Rev. T. Bayes,An Essay Toward Solving a Problem in the Doctrine of Chances, Philos. Trans. R. Soc. London 53, pp.370-418, 1763.
[34] J. Pearl,Probabilistic resoning in intelligent systems: Networks of plausible inference.San Mateo, CA: Morgan-Kaufmann, 1988.
[35] D.J. Spiegelhalter, A.P. Dawid, S.L., Lauritzen, and R.G. Cowell, R. G., Bayesian Analysis in Expert Systems,Statistical Science, 8, 219-283, 1993