Preeclampsia is a complication of pregnancy characterized by novel onset of hypertension after 20 weeks gestation, accompanied by proteinuria. It affects 3%–8% of pregnan-cies in the Western world and is a major cause of morbid-ity and mortalmorbid-ity for both mother and child.1,2 Although the exact biological mechanism of preeclampsia remains unclear, it is generally accepted to be the result of a combi-nation of endothelial dysfunction, excessive inflammation
beyond that of normal pregnancy and placental insuffi-ciency.3 There is evidence of genetic susceptibility to the condition, as women with a maternal history of preec-lampsia are at a 2- to 5-fold increased risk of develop-ing preeclampsia themselves.3 Additionally, women who develop preeclampsia are at a significantly increased risk of future cardiovascular disease, including hypertension and stroke.4,5 Chronic hypertension is an established risk
Genetic Risk Score for Essential Hypertension and Risk of
Preeclampsia
Caitlin J. Smith,
1Audrey F. Saftlas,
1Cassandra N. Spracklen,
1,2Elizabeth W. Triche,
3Andrew Bjonnes,
4,5Brendan Keating,
6,7Richa Saxena,
4,5Patrick J. Breheny,
8Andrew T. Dewan,
9Jennifer G. Robinson,
1Josephine Hoh,
10and Kelli K. Ryckman
1BACKGROUND
Preeclampsia is a hypertensive complication of pregnancy character-ized by novel onset of hypertension after 20 weeks gestation, accom-panied by proteinuria. Epidemiological evidence suggests that genetic susceptibility exists for preeclampsia; however, whether preeclampsia is the result of underlying genetic risk for essential hypertension has yet to be investigated. Based on the hypertensive state that is charac-teristic of preeclampsia, we aimed to determine if established genetic risk scores (GRSs) for hypertension and blood pressure are associated with preeclampsia.
METHODS
Subjects consisted of 162 preeclamptic cases and 108 normotensive pregnant controls, all of Iowa residence. Subjects’ DNA was extracted from buccal swab samples and genotyped on the Affymetrix Genome-wide Human SNP Array 6.0 (Affymetrix, Santa Clara, CA). Missing genotypes were imputed using MaCH and Minimac software. GRSs were calculated for hypertension, systolic blood pressure (SBP), dias-tolic blood pressure (DBP), and mean arterial pressure (MAP) using
established genetic risk loci for each outcome. Regression analyses were performed to determine the association between GRS and risk of preeclampsia. These analyses were replicated in an independent US population of 516 cases and 1,097 controls of European ancestry.
RESULTS
GRSs for hypertension, SBP, DBP, and MAP were not significantly associ-ated with risk for preeclampsia (P > 0.189). The results of the replication analysis also yielded nonsignificant associations.
CONCLUSIONS
GRSs for hypertension and blood pressure are not associated with preeclampsia, suggesting that an underlying predisposition to essen-tial hypertension is not on the causal pathway of preeclampsia.
Keywords: blood pressure; genetic epidemiology; genetic predisposi-tion to disease; hypertension; maternal; preeclampsia; pregnancy.
doi:10.1093/ajh/hpv069
Correspondence: Kelli K. Ryckman ([email protected]).
© American Journal of Hypertension, Ltd 2015. All rights reserved. For Permissions, please email: [email protected]
1Department of Epidemiology, College of Public Health, University of Iowa, Iowa City, Iowa, USA; 2Department of Genetics, University of North Carolina-Chapel Hill, Chapel Hill, North Carolina, USA; 3Department of Epidemiology, School of Public Health, Brown University, Providence, Rhode Island, USA; 4Center for Human Genetic Research and Department of Anesthesia, Critical Care and Pain Medicine, Massachusetts General Hospital, Boston, Massachusetts, USA; 5Program in Medical and Population Genetics, Broad Institute, Cambridge, Massachusetts, USA; 6Department of Surgery, Penn Transplant Institute, Perelman School of Medicine, University of Pennsylvania, Philadelphia, Pennsylvania, USA; 7Center for Applied Genomics, Abramson Research Center, The Children’s Hospital of Philadelphia, Philadelphia, Pennsylvania, USA; 8Department of Biostatistics, University of Iowa College of Public Health, Iowa City, Iowa, USA; 9Department of Chronic Disease Epidemiology, Yale School of Public Health, New Haven, Connecticut, USA; 10Department of Environmental Health Sciences, Yale School of Public Health, New Haven, Connecticut, USA.
Initially submitted January 2, 2015; date of first revision January 24, 2015; accepted for publication April 23, 2015; online publication May 23, 2015.
factor for preeclampsia, although the onset of preeclampsia on a background of existing hypertension is referred to as superimposed preeclampsia.1,2 First trimester systolic blood pressure (SBP), diastolic blood pressure (DBP), and mean arterial pressure (MAP) are significantly elevated in women who go on to develop preeclampsia compared to those with normotensive pregnancies.6,7 These consistent phenom-ena led us to question whether underlying genetic risks for essential hypertension or higher first trimester blood pres-sure are predictors of the manifestation of preeclampsia.
The role of genetics in determining blood pressure has become clearer through genome-wide association studies (GWASs). The use of a genetic risk score (GRS) based on GWAS findings as an indicator of risk for a given condition is a novel method of investigating genetic susceptibility to a complex trait. These GRSs may be investigated for associa-tion with an intermediate phenotype, such as blood pressure, which may then be investigated for association with risk for a disease outcome8,9 and vice versa.10 Specifically, one study constructed a GRS for hypertension based on a meta-anal-ysis of GWAS-identified single nucleotide polymorphisms (SNPs) and its association with ischemic stroke,9,11 while another investigated a GRS for coronary artery disease and its association with hypertension.10
As preeclampsia is considered a hypertensive disorder of pregnancy and there is evidence of genetic susceptibil-ity to the condition, including variants in vasoactive genes, it stands to reason that underlying genetic susceptibility to essential hypertension or higher first trimester blood pres-sure may contribute to the manifestation of preeclampsia. In this study, we investigate the association between an estab-lished GRS for essential hypertension and blood pressure and the outcome of preeclampsia in 2 different study popu-lations. We hypothesize that women with higher genetic risk for elevated blood pressure and/or essential hypertension will be at increased risk of preeclampsia. To our knowledge, this is the first study to use GRS for essential hypertension and blood pressure in relation to preeclampsia.
METHODS Study population
This study involved subjects from the Study of Pregnancy Hypertension in Iowa (SOPHIA) case–control population. The SOPHIA population is composed of nulliparous residents of 42 Iowa counties who had a live birth from August 2002 through April 2005. Two hundred seventy subjects, including 162 cases and 108 controls, were used in GRS analyses.
A replication population consisting of 516 preeclampsia cases and 1,097 normotensive controls of European ancestry was aggregated from 5 US sites. These sites were Institutional Review Board–approved hospital and internet-based collec-tions and subjects were matched to population controls.
Phenotype definition
The methods for classifying preeclampsia in the SOPHIA study have been described previously.12–14 Cases were ini-tially selected based on an indication of “pregnancy-induced
hypertension” or “eclampsia” on birth certificate records. Randomly selected control subjects had no record of hyper-tension on birth certificate records and were frequency matched to cases based on county of residence. Potential subjects were excluded for chronic hypertension, age <18 at delivery, non-English speaking, history of autoimmune dis-ease, recurrent spontaneous abortion, multiple gestations, major congenital anomalies, infant death, or seriously ill infant.14 Medical records were abstracted from the antenatal, intrapartum, and postpartum periods to identify all blood pressure and urinary protein measurements before, during, and after pregnancy; this information was used to classify patients with preeclampsia, gestational hypertension, or as normotensive controls. Preeclampsia was defined accord-ing to National Heart, Lung, and Blood Institute guidelines: (i) sustained de novo hypertension (≥140 mm Hg systolic or
≥90 mm Hg diastolic on ≥2 occasions at least 6 hours apart) beginning no earlier than 20 weeks gestation and (ii) pro-teinuria, defined as urinary protein concentrations ≥30 mg/ dL (equivalent to a dipstick value of 1+ from ≥2 specimens
≥4 hours apart or a 24-hour urine collection with ≥300 mg of protein).15 Gestational hypertension was defined as de novo hypertension in the absence of proteinuria and preeclampsia as gestational hypertension with proteinuria. Normotensive controls consisted of women with no evidence of hyperten-sion or proteinuria during their pregnancy.
In the replication population, preeclampsia was defined according to the same National Heart, Lung, and Blood Institute guidelines as the SOPHIA population. Boston and USC samples also included superimposed preeclampsia in their case definition. Normotensive controls consisted of pregnant women with no history of chronic hypertension and no evidence of hypertensive disorders of pregnancy or proteinuria.
Genotyping
DNA collection, extraction, and genotyping methods for this study have been described previously.14 A subset of sam-ples (N = 270) from the SOPHIA study underwent GWA analysis based on Caucasian race and consent for future research. Genotyping was performed at the Rockefeller University Genomics Resource Center using Affymetrix Genome-wide Human SNP Array 6.0 (Affymetrix, Santa Clara, CA). Samples with a call rate less than 86% were excluded (n = 1).14 The mean call rate among the remain-ing subjects was 94.4%.14 SNPs on chromosomes 1–22 were imputed using MaCH software,16 using the 379 samples of European ancestry (CEPH) from the 1000 Genomes Project phase 1 as the reference panel.17 Haplotypes for the SOPHIA subjects were estimated using MaCH software, and impu-tation was performed using Minimac software.18 All GRS SNPs were available in the SOPHIA population without requiring a proxy SNP.
ancestry were identified using principal component analysis using HapMap3 European (CEU), African (YRI), and Asian (JPT + CHB) panels as reference standards.20 SNPs were removed for genotyping efficiency <95%, departure from Hardy–Weinberg equilibrium (P < 10−6) in controls, differ-ential missingness between cases and controls (P < 0.05), or batch effects (P < 10−6).14 The cardiovascular disease gene-centric array contained a limited number of index SNPs for blood pressure measurements, so GRS analyses utilized proxy SNPs with the strongest correlation (pairwise r2 > 0.8) to the untyped index SNP in the 1KG CEU sample.
Statistical analyses
GRSs for hypertension, SBP, DBP, and MAP were con-structed for each subject based on the beta coefficients of GWAS-significant variants with a source-reported P-value < 1.0E-04.11,21 The number of source SNPs were 27, 28, 28, and 23 for hypertension, SBP, DBP, and MAP, respectively. After imputation of the SOPHIA genotypes, the GRS for hyper-tension consisted of 26 SNPs, the GRS for SBP and DBP con-sisted of 27 SNPs, and the GRS for MAP concon-sisted of 22 SNPs. SNPs and beta coefficients used to construct these GRS are reported in Supplementary Table 1. Specifically, GRSs were constructed based on the reported beta coefficient for the effect allele at the given SNP. Alleles were coded such that the reported beta coefficient would be a positive value; for SNPs where the source allele had a negative beta coefficient, the other allele was used and the beta coefficient was made posi-tive. The beta coefficient of each effect allele was summed for each subject based on their genotypes, such that individuals homozygous for the noncoded allele would receive a value of 0 for that locus, heterozygous individuals would receive the value of the beta coefficient at that locus, and individu-als homozygous for the coded allele would receive double the beta coefficient for that locus. Similar GRSs were con-structed for the replication population. Due to the limited availability of index and proxy SNPs, the replication study used 6 SNPs for hypertension, SBP, and DBP, and 5 SNPs for MAP. SNPs and beta coefficients used to construct these GRS are reported in Supplementary Table 2.
Logistic regression was performed to assess the associa-tion between the 4 GRSs and preeclampsia using Statistical Analysis Software version 9.3 (Cary, NC). Our primary analyses examined the relationship between each GRS, independently, and risk of preeclampsia. In a subset of our sample where first trimester blood pressure measurements were available (n = 131 cases, 87 controls), we examined the relationship between first trimester DBP, SBP, and MAP with risk for preeclampsia. In addition, we examined the relation-ship between each GRS and its associated blood pressure measurement. First trimester MAP was calculated for each subject using the formula (MAP = diastolic + 1/3(systolic − diastolic)) based on subjects’ first trimester average SBP and DBP. Analyses involving the blood pressure measure-ments for SBP, DBP, and MAP were performed unadjusted and adjusted for body mass index (BMI). Other covariates examined included maternal age at delivery, maternal edu-cation level, smoking during the first trimester, and leisure time physical activity. Our replication population did not
include any information on blood pressure measurements or information on maternal age, BMI, or smoking; therefore, these analyses were only examined in our primary popula-tion. GRSs for SBP, DBP, and MAP were also broken into quartiles based on their distributions among control subjects and then assessed for their association with SBP, DBP, and MAP, respectively, using linear regression.
RESULTS
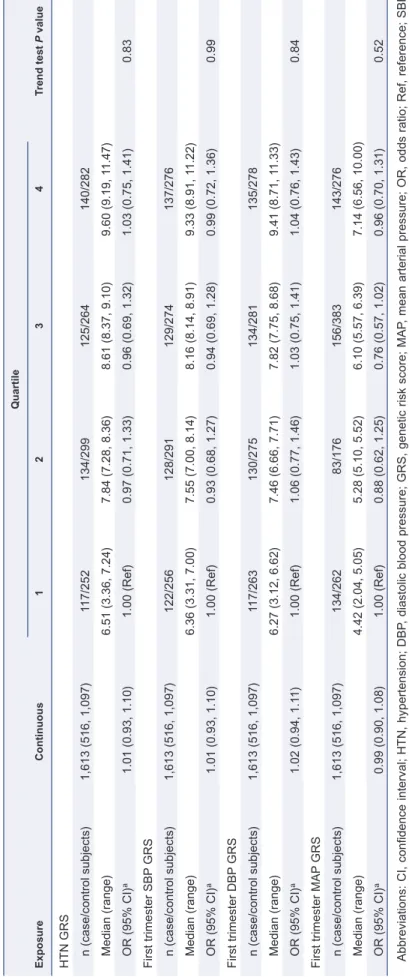
GRSs for hypertension, SBP, DBP, and MAP were not sig-nificantly associated with preeclampsia. Additionally, quar-tile analyses did not demonstrate a statistically significant trend for any of the GRSs (Table 1). Similar analyses in the replication population were also nonsignificant (Table 2).
To determine the effectiveness of each GRS in predicting its respective blood pressure measurement, GRSs for SBP, DBP, and MAP were analyzed against measured SBP, DBP, and MAP values, respectively, using linear regression. The GRS for DBP was significantly associated with DBP before and after adjustment for pre-pregnancy BMI and the GRS for SBP was marginally associated with SBP unadjusted (P = 0.07) and significantly associated after adjustment for pre-pregnancy BMI (P < 0.05) (Supplementary Table 3). The GRS for MAP was not significantly associated with first trimester MAP. In the quartile analyses, tests for trend demonstrated a significant trend for the DBP GRS and measured DBP (P < 0.05), a marginally significant trend for the association between SBP GRS and SBP measurements (P = 0.11) and no trend between the MAP GRS and MAP (Supplementary Table 3).
First trimester SBP, DBP, and MAP were significantly associated with preeclampsia in a subset of the SOPHIA population (P < 0.0001), with increased first trimester blood pressures associated with increased risk of preeclampsia (Supplementary Table 4). These associations remained sig-nificant after adjustment for BMI. All 3 trends were highly significant (P ≤ 0.0001).
DISCUSSION
Table 1.
Association between genetic risk score (GRS) and risk of preeclampsia
Exposure
Continuous
Quartile
Trend test
P
value
1
2
3
4
HTN GRS n (case/control subjects)
270 (162/108)
68 (41/27)
69 (42/27)
65 (38/27)
68 (41/27)
Median (range)
29.2 (21.4, 37.8)
25.6 (21.4, 26.9)
28.0 (26.9, 29.2)
30.4 (29.2, 31.4)
32.7 (31.4, 37.8)
OR (95% CI)
a
0.993 (0.916, 1.076)
1.00 (Ref)
1.024 (0.516, 2.033)
0.927 (0.464, 1.852)
1.000 (0.503, 1.988)
0.929
SBP
GRS
n (case/control subjects)
270 (162/108)
67 (40/27)
66 (39/27)
72 (45/27)
65 (38/27)
Median (range)
29.1 (21.0, 37.2)
25.5 (21.0, 26.8)
28.0 (26.8, 29.0)
30.3 (29.1, 31.6)
33.0 (31.7, 37.2)
OR (95% CI)
a
1.004 (0.928, 1.086)
1.00 (Ref)
0.975 (90.488, 1.948)
1.125 (0.568, 2.226)
0.950 (0.475, 1.902)
1.000
DBP
GRS
n (case/control subjects)
270 (162/108)
63 (36/27)
80 (53/27)
65 (38/27)
62 (35/27)
Median (range)
28.6 (21.7, 37.6)
25.2 (20.5, 26.3)
27.9 (26.4, 28.9)
30.1 (29.0, 31.3)
32.7 (31.3, 37.6)
OR (95% CI)
a
0.978 (0.904, 1.057)
1.00 (Ref)
1.472 (0.745, 2.909)
1.056 (0.523, 2.129)
0.972 (0.479, 1.973)
0.680
MAP
GRS
n (case/control subjects)
270 (162/108)
63 (36/27)
80 (53/27)
65 (38/27)
62 (35/27)
Median (range)
22.7 (12.9, 28.3)
25.2 (20.5, 26.3)
27.9 (26.4, 28.9)
30.1 (29.0, 31.3)
32.7 (31.3, 37.6)
OR (95% CI)
a
1.042 (0.953, 1.140)
1.00 (Ref)
0.649 (0.309, 1.360)
1.595 (0.813, 3.127)
1.135 (0.568, 2.269)
0.262
Abbreviations: CI, confidence interval; HTN, hypertension; DBP
, diastolic blood pressure; GRS, genetic risk score; MAP
, mean arterial pressure; OR, odds ratio; Ref, reference; SBP
,
systolic blood pressure.
Table 2.
Association between genetic risk score (GRS) and risk of preeclampsia in the replication population
Exposure
Continuous
Quartile
Trend test
P
value
1
2
3
4
HTN GRS n (case/control subjects)
1,613 (516, 1,097)
117/252
134/299
125/264
140/282
Median (range)
6.51 (3.36, 7.24)
7.84 (7.28, 8.36)
8.61 (8.37, 9.10)
9.60 (9.19, 1
1.47)
OR (95% CI)
a
1.01 (0.93, 1.10)
1.00 (Ref)
0.97 (0.71, 1.33)
0.96 (0.69, 1.32)
1.03 (0.75, 1.41)
0.83
First trimester SBP
GRS
n (case/control subjects)
1,613 (516, 1,097)
122/256
128/291
129/274
137/276
Median (range)
6.36 (3.31, 7.00)
7.55 (7.00, 8.14)
8.16 (8.14, 8.91)
9.33 (8.91, 1
1.22)
OR (95% CI)
a
1.01 (0.93, 1.10)
1.00 (Ref)
0.93 (0.68, 1.27)
0.94 (0.69, 1.28)
0.99 (0.72, 1.36)
0.99
First trimester DBP
GRS
n (case/control subjects)
1,613 (516, 1,097)
117/263
130/275
134/281
135/278
Median (range)
6.27 (3.12, 6.62)
7.46 (6.66, 7.71)
7.82 (7.75, 8.68)
9.41 (8.71, 1
1.33)
OR (95% CI)
a
1.02 (0.94, 1.1
1)
1.00 (Ref)
1.06 (0.77, 1.46)
1.03 (0.75, 1.41)
1.04 (0.76, 1.43)
0.84
First trimester MAP
GRS
n (case/control subjects)
1,613 (516, 1,097)
134/262
83/176
156/383
143/276
Median (range)
4.42 (2.04, 5.05)
5.28 (5.10, 5.52)
6.10 (5.57, 6.39)
7.14 (6.56, 10.00)
OR (95% CI)
a
0.99 (0.90, 1.08)
1.00 (Ref)
0.88 (0.62, 1.25)
0.76 (0.57, 1.02)
0.96 (0.70, 1.31)
0.52
Abbreviations: CI, confidence interval; HTN, hypertension; DBP
, diastolic blood pressure; GRS, genetic risk score; MAP
, mean arterial pressure; OR, odds ratio; Ref, reference; SBP
,
systolic blood pressure.
hypertension is a risk factor for preeclampsia,2 our findings suggest that genetic susceptibility for hypertension is not a necessary causal factor in the development of preeclampsia.
It is important to note that blood pressure is only one aspect of the pathophysiology of preeclampsia. Meta-analyses of the genetics of preeclampsia have identified several biologi-cal processes associated with risk for preeclampsia repre-sented by only a handful of promising candidate genes.24,25 Although genes involved with vasoactive processes have been implicated in the pathophysiology of preeclampsia, a recent meta-analysis found genes associated with thrombo-philia to be more strongly associated with preeclampsia.24 Another important contributor to the etiology of preec-lampsia includes endothelial dysfunction, including insuf-ficient spiral artery invasion and inappropriate endothelial cell activation,26 which may be mediated by dyslipidemia.27 Epidemiologic studies and GWASs, by our group and oth-ers, support the role of dyslipidemia in preeclampsia. This includes elevated triglycerides throughout pregnancy and decreased high density lipoprotein cholesterol in the third trimester.28,29 Of interest, the lipoprotein lipase gene, LPL, is associated with both preeclampsia and cardiovascular dis-ease.25 We have previously reported an association between a GRS for decreased levels of high density lipoprotein cho-lesterol, which included a variant in LPL, and increased risk for preeclampsia.8 Thus, the etiology of preeclampsia likely encompasses a myriad of factors on its causal pathway, and our current data, which are supported by other genetic stud-ies, suggest that genes involved in the vasoactive process including those that predict blood pressure are not primary candidates on the causal pathway of preeclampsia.
A significant strength of our study was the availability of blood pressure values in addition to the rigorous assessment of preeclampsia status in our primary study population. The availability of first trimester blood pressure measurements allowed us to assess the relationship between first trimester blood pressure and preeclampsia and to evaluate the associa-tion between GRSs for SBP, DBP, and MAP and their respec-tive first trimester blood pressure measurements. Although we were able to include maternal blood pressure measure-ments in our study, we lack blood pressure measuremeasure-ments prior to conception. Thus, although we excluded women with preexisting chronic hypertension, we cannot determine if subjects with preeclampsia had higher blood pressure while still being within the normotensive range prior to con-ception. An additional limitation is the lack of a standard-ized protocol for measuring blood pressure, given the nature of a retrospective case–control study design.
It is important to note that the SNPs involved in this study only explain a small fraction of the heritable varia-tion in blood pressure (<3%); however, this was also the case in the meta-analysis of GWAS from which the SNPs came (~2.2%).11 Furthermore, in our replication, we were only able to include a fraction of the SNPs in the initial GRS, and therefore, replication in other populations is warranted. As additional SNPs influencing blood pressure are identified and the genetic risk factors for hypertension and blood pres-sure are better understood, it will be important to reexamine the relationship between preeclampsia and the genetic risk for hypertension.
The SNPs used to generate GRS for this study were based on the results of the meta-analysis of multiple GWASs of hyper-tension and blood pressure–associated loci, demonstrating the reliability of these SNPs in their association with hyperten-sion and blood pressure.11,21 Further, most of these same SNPs were used in another GRS study of hypertension and ischemic stroke, demonstrating a precedent for the use of a GRS for blood pressure and its association with a disease outcome.9 However, given that all of these studies were in a population of European ancestry and our study population is primarily Caucasian, it is necessary to evaluate these variants in other populations to determine their association with blood pres-sure in other racial and ethnic groups. Although our primary study population was relatively small, the fact that we find that (i) the GRSs of SBP and DBP are associated with their respec-tive first trimester measurement, (ii) first trimester blood pressure measurements are associated with preeclampsia, and (iii) the results of nonsignificant associations between each GRS and preeclampsia were also observed in our replication population strengthens the conclusions of our study.
Our study suggests that elevated first trimester blood pres-sures are likely the result of early pathological changes of preeclampsia, rather than primary causal factors. Based on our findings, we propose that the hypertension present in preec-lampsia is of a different etiology from essential hypertension. Our replication of the well-established association between elevated first trimester blood pressure and subsequent preec-lampsia further supports our conclusion that this increase in blood pressure represents early pathological changes that eventually manifest as preeclampsia. Thus, since an estab-lished risk score for blood pressure was not associated with the development of preeclampsia and none of our subjects had a history of hypertension prior to conception, we can con-clude that the hypertension present in preeclampsia is not due to a risk for chronic or “essential” hypertension but rather the early etiology of preeclampsia. Our previous genetic and epi-demiologic studies suggest that other pathways such as dyslip-idemia may play a causal role in preeclampsia. Given that the origins of preeclampsia are still not well understood, future research is needed on the etiology of preeclampsia in order to explain the origin of this early increase in blood pressure in pregnant subjects who go on to be diagnosed with sia. Although the complex pathophysiology of preeclamp-sia remains unclear, the results of our study suggest that the hypertensive state that is characteristic of preeclampsia is not due to genetic susceptibility for essential hypertension.
SUPPLEMENTARY MATERIAL
Supplementary materials are available at American Journal of Hypertension (http://ajh.oxfordjournals.org).
ACKNOWLEDGMENTS
Institute. The replication study was funded in part by a Gertie Marx Grant from the Society for Obstetric Anesthesia and Perinatology. We acknowledge contribution of samples for IBC array genotyping by preeclampsia investigators from Boston (B. Bateman and S.A. Karumanchi), Iowa (J. Murray), USC (M.L. Wilson), and Yale (E. Norwitz) as well as contribution of genotype data from the preeclampsia CARe IBC study.30
DISCLOSURE
The authors declared no conflict of interest.
REFERENCES
1. Uzan J, Carbonnel M, Piconne O, Asmar R, Ayoubi JM. Pre-eclampsia:
pathophysiology, diagnosis, and management. Vasc Health Risk Manage
2011; 7:467–474.
2. Sibai B, Dekker G, Kupferminc M. Pre-eclampsia. Lancet 2005;
365:785–799.
3. Redman CW, Sacks GP, Sargent IL. Preeclampsia: an excessive
mater-nal inflammatory response to pregnancy. Am J Obstet Gynecol 1999;
180:499–506.
4. Bellamy L, Casas JP, Hingorani AD, Williams DJ. Pre-eclampsia and risk of cardiovascular disease and cancer in later life: systematic review
and meta-analysis. BMJ 2007; 335:974.
5. Wilson BJ, Watson MS, Prescott GJ, Sunderland S, Campbell DM, Hannaford P, Smith WC. Hypertensive diseases of pregnancy and risk
of hypertension and stroke in later life: results from cohort study. BMJ
2003; 326:845.
6. Myatt L, Clifton RG, Roberts JM, Spong CY, Hauth JC, Varner MW, Thorp JM Jr, Mercer BM, Peaceman AM, Ramin SM, Carpenter MW, Iams JD, Sciscione A, Harper M, Tolosa JE, Saade G, Sorokin Y, Anderson GD; Eunice Kennedy Shriver National Institute of Child Health and Human Development (NICHD) Maternal-Fetal Medicine Units (MFMU) Network. First-trimester prediction of preeclampsia in
nulliparous women at low risk. Obstet Gynecol 2012; 119:1234–1242.
7. Miller RS, Rudra CB, Williams MA. First-trimester mean arterial
pres-sure and risk of preeclampsia. Am J Hypertens 2007; 20:573–578.
8. Spracklen CN, Saftlas AF, Triche EW, Bjonnes A, Keating B, Saxena R, Breheny PJ, Dewan AT, Robinson JG, Hoh J, Ryckman KK. Genetic
pre-disposition to dyslipidemia and risk of preeclampsia. Am J Hypertens
2014.
9. Fava C, Sjogren M, Olsson S, Lovkvist H, Jood K, Engstrom G, Hedblad B, Norrving B, Jern C, Lindgren A, Melander O. A genetic risk score for hypertension associates with the risk of ischemic stroke in a Swedish
case-control study. Eur J Hum Genet 2014.
10. Fujimaki T, Oguri M, Horibe H, Kato K, Matsuoka R, Abe S, Tokoro F, Arai M, Noda T, Watanabe S, Yamada Y. Association of a transcription
factor 21 gene polymorphism with hypertension. Biomed Rep 2015;
3:118–122.
11. Ehret GB, Munroe PB, Rice KM, Bochud M, Johnson AD, Chasman DI, Smith AV, Tobin MD, Verwoert GC, Hwang SJ, Pihur V, Vollenweider P, O'Reilly PF, Amin N, Bragg-Gresham JL, Teumer A, Glazer NL, Launer L, Zhao JH, Aulchenko Y, Heath S, Sõber S, Parsa A, Luan J, Arora P, Dehghan A, Zhang F, Lucas G, Hicks AA, Jackson AU, Peden JF, Tanaka T, Wild SH, Rudan I, Igl W, Milaneschi Y, Parker AN, Fava C, Chambers JC, Fox ER, Kumari M, Go MJ, van der Harst P, Kao WH, Sjögren M, Vinay DG, Alexander M, Tabara Y, Shaw-Hawkins S, Whincup PH, Liu Y, Shi G, Kuusisto J, Tayo B, Seielstad M, Sim X, Nguyen KD, Lehtimäki T, Matullo G, Wu Y, Gaunt TR, Onland-Moret NC, Cooper MN, Platou CG, Org E, Hardy R, Dahgam S, Palmen J, Vitart V, Braund PS, Kuznetsova T, Uiterwaal CS, Adeyemo A, Palmas W, Campbell H, Ludwig B, Tomaszewski M, Tzoulaki I, Palmer ND, Aspelund T, Garcia M, Chang YP, O'Connell JR, Steinle NI, Grobbee DE, Arking DE, Kardia SL, Morrison AC, Hernandez D, Najjar S, McArdle WL, Hadley D, Brown MJ, Connell JM, Hingorani AD, Day IN, Lawlor DA, Beilby
JP, Lawrence RW, Clarke R, Hopewell JC, Ongen H, Dreisbach AW, Li Y, Young JH, Bis JC, Kähönen M, Viikari J, Adair LS, Lee NR, Chen MH, Olden M, Pattaro C, Bolton JA, Köttgen A, Bergmann S, Mooser V, Chaturvedi N, Frayling TM, Islam M, Jafar TH, Erdmann J, Kulkarni SR, Bornstein SR, Grässler J, Groop L, Voight BF, Kettunen J, Howard P, Taylor A, Guarrera S, Ricceri F, Emilsson V, Plump A, Barroso I, Khaw KT, Weder AB, Hunt SC, Sun YV, Bergman RN, Collins FS, Bonnycastle LL, Scott LJ, Stringham HM, Peltonen L, Perola M, Vartiainen E, Brand SM, Staessen JA, Wang TJ, Burton PR, Soler Artigas M, Dong Y, Snieder H, Wang X, Zhu H, Lohman KK, Rudock ME, Heckbert SR, Smith NL, Wiggins KL, Doumatey A, Shriner D, Veldre G, Viigimaa M, Kinra S, Prabhakaran D, Tripathy V, Langefeld CD, Rosengren A, Thelle DS, Corsi AM, Singleton A, Forrester T, Hilton G, McKenzie CA, Salako T, Iwai N, Kita Y, Ogihara T, Ohkubo T, Okamura T, Ueshima H, Umemura S, Eyheramendy S, Meitinger T, Wichmann HE, Cho YS, Kim HL, Lee JY, Scott J, Sehmi JS, Zhang W, Hedblad B, Nilsson P, Smith GD, Wong A, Narisu N, Stančáková A, Raffel LJ, Yao J, Kathiresan S, O'Donnell CJ, Schwartz SM, Ikram MA, Longstreth WT Jr, Mosley TH, Seshadri S, Shrine NR, Wain LV, Morken MA, Swift AJ, Laitinen J, Prokopenko I, Zitting P, Cooper JA, Humphries SE, Danesh J, Rasheed A, Goel A, Hamsten A, Watkins H, Bakker SJ, van Gilst WH, Janipalli CS, Mani KR, Yajnik CS, Hofman A, Mattace-Raso FU, Oostra BA, Demirkan A, Isaacs A, Rivadeneira F, Lakatta EG, Orru M, Scuteri A, Ala-Korpela M, Kangas AJ, Lyytikäinen LP, Soininen P, Tukiainen T, Würtz P, Ong RT, Dörr M, Kroemer HK, Völker U, Völzke H, Galan P, Hercberg S, Lathrop M, Zelenika D, Deloukas P, Mangino M, Spector TD, Zhai G, Meschia JF, Nalls MA, Sharma P, Terzic J, Kumar MV, Denniff M, Zukowska-Szczechowska E, Wagenknecht LE, Fowkes FG, Charchar FJ, Schwarz PE, Hayward C, Guo X, Rotimi C, Bots ML, Brand E, Samani NJ, Polasek O, Talmud PJ, Nyberg F, Kuh D, Laan M, Hveem K, Palmer LJ, van der Schouw YT, Casas JP, Mohlke KL, Vineis P, Raitakari O, Ganesh SK, Wong TY, Tai ES, Cooper RS, Laakso M, Rao DC, Harris TB, Morris RW, Dominiczak AF, Kivimaki M, Marmot MG, Miki T, Saleheen D, Chandak GR, Coresh J, Navis G, Salomaa V, Han BG, Zhu X, Kooner JS, Melander O, Ridker PM, Bandinelli S, Gyllensten UB, Wright AF, Wilson JF, Ferrucci L, Farrall M, Tuomilehto J, Pramstaller PP, Elosua R, Soranzo N, Sijbrands EJ, Altshuler D, Loos RJ, Shuldiner AR, Gieger C, Meneton P, Uitterlinden AG, Wareham NJ, Gudnason V, Rotter JI, Rettig R, Uda M, Strachan DP, Witteman JC, Hartikainen AL, Beckmann JS, Boerwinkle E, Vasan RS, Boehnke M, Larson MG, Järvelin MR, Psaty BM, Abecasis GR, Chakravarti A, Elliott P, van Duijn CM, Newton-Cheh C, Levy D, Caulfield MJ, Johnson T; International Consortium for Blood Pressure Genome-Wide Association Studies; CARDIoGRAM Consortium; CKDGen Consortium; KidneyGen Consortium; EchoGen Consortium; CHARGE-HF Consortium. Genetic variants in novel pathways influence blood pressure and
car-diovascular disease risk. Nature 2011; 478:103–109.
12. Saftlas AF, Rubenstein L, Prater K, Harland KK, Field E, Triche EW. Cumulative exposure to paternal seminal fluid prior to
concep-tion and subsequent risk of preeclampsia. J Reprod Immunol 2014;
101–102:104–110.
13. Triche EW, Harland KK, Field EH, Rubenstein LM, Saftlas AF. Maternal-fetal HLA sharing and preeclampsia: variation in effects by seminal fluid exposure in a case-control study of nulliparous women in
Iowa. J Reprod Immunol 2014; 101–102:111–119.
14. Zhao L, Triche EW, Walsh KM, Bracken MB, Saftlas AF, Hoh J, Dewan AT. Genome-wide association study identifies a maternal
copy-num-ber deletion in PSG11 enriched among preeclampsia patients. BMC
Pregnancy Childbirth 2012; 12:61.
15. Roberts JM, Pearson GD, Cutler JA, Lindheimer MD; National Heart Lung and Blood Institute. Summary of the NHLBI working group on
research on hypertension during pregnancy. Hypertens Pregnancy 2003;
22:109–127.
16. Li Y, Willer CJ, Ding J, Scheet P, Abecasis GR. MaCH: using sequence and genotype data to estimate haplotypes and unobserved genotypes.
Genet Epidemiol 2010; 34:816–834.
17. 1000 Genomes Project Consortium, Abecasis GR, Auton A, Brooks LD, DePristo MA, Durbin RM, Handsaker RE, Kang HM, Marth GT, McVean GA. An integrated map of genetic variation from 1,092 human
genomes. Nature 2012; 491:56–65.
18. Howie B, Fuchsberger C, Stephens M, Marchini J, Abecasis GR. Fast and accurate genotype imputation in genome-wide association studies
19. Keating BJ, Tischfield S, Murray SS, Bhangale T, Price TS, Glessner JT, Galver L, Barrett JC, Grant SF, Farlow DN, Chandrupatla HR, Hansen M, Ajmal S, Papanicolaou GJ, Guo Y, Li M, Derohannessian S, de Bakker PI, Bailey SD, Montpetit A, Edmondson AC, Taylor K, Gai X, Wang SS, Fornage M, Shaikh T, Groop L, Boehnke M, Hall AS, Hattersley AT, Frackelton E, Patterson N, Chiang CW, Kim CE, Fabsitz RR, Ouwehand W, Price AL, Munroe P, Caulfield M, Drake T, Boerwinkle E, Reich D, Whitehead AS, Cappola TP, Samani NJ, Lusis AJ, Schadt E, Wilson JG, Koenig W, McCarthy MI, Kathiresan S, Gabriel SB, Hakonarson H, Anand SS, Reilly M, Engert JC, Nickerson DA, Rader DJ, Hirschhorn JN, Fitzgerald GA. Concept, design and implementation of a cardiovas-cular gene-centric 50 k SNP array for large-scale genomic association
studies. PLoS One 2008; 3:e3583.
20. Altshuler DM, Gibbs RA, Peltonen L, Altshuler DM, Gibbs RA, Peltonen L, Dermitzakis E, Schaffner SF, Yu F, Peltonen L, Dermitzakis E, Bonnen PE, Altshuler DM, Gibbs RA, de Bakker PI, Deloukas P, Gabriel SB, Gwilliam R, Hunt S, Inouye M, Jia X, Palotie A, Parkin M, Whittaker P, Yu F, Chang K, Hawes A, Lewis LR, Ren Y, Wheeler D, Gibbs RA, Muzny DM, Barnes C, Darvishi K, Hurles M, Korn JM, Kristiansson K, Lee C, McCarrol SA, Nemesh J, Dermitzakis E, Keinan A, Montgomery SB, Pollack S, Price AL, Soranzo N, Bonnen PE, Gibbs RA, Gonzaga-Jauregui C, Keinan A, Price AL, Yu F, Anttila V, Brodeur W, Daly MJ, Leslie S, McVean G, Moutsianas L, Nguyen H, Schaffner SF, Zhang Q, Ghori MJ, McGinnis R, McLaren W, Pollack S, Price AL, Schaffner SF, Takeuchi F, Grossman SR, Shlyakhter I, Hostetter EB, Sabeti PC, Adebamowo CA, Foster MW, Gordon DR, Licinio J, Manca MC, Marshall PA, Matsuda I, Ngare D, Wang VO, Reddy D, Rotimi CN, Royal CD, Sharp RR, Zeng C, Brooks LD, McEwen JE. Integrating
com-mon and rare genetic variation in diverse human populations. Nature
2010; 467:52–58.
21. Wain LV, Verwoert GC, O'Reilly PF, Shi G, Johnson T, Johnson AD, Bochud M, Rice KM, Henneman P, Smith AV, Ehret GB, Amin N, Larson MG, Mooser V, Hadley D, Dörr M, Bis JC, Aspelund T, Esko T, Janssens AC, Zhao JH, Heath S, Laan M, Fu J, Pistis G, Luan J, Arora P, Lucas G, Pirastu N, Pichler I, Jackson AU, Webster RJ, Zhang F, Peden JF, Schmidt H, Tanaka T, Campbell H, Igl W, Milaneschi Y, Hottenga JJ, Vitart V, Chasman DI, Trompet S, Bragg-Gresham JL, Alizadeh BZ, Chambers JC, Guo X, Lehtimäki T, Kühnel B, Lopez LM, Polašek O, Boban M, Nelson CP, Morrison AC, Pihur V, Ganesh SK, Hofman A, Kundu S, Mattace-Raso FU, Rivadeneira F, Sijbrands EJ, Uitterlinden AG, Hwang SJ, Vasan RS, Wang TJ, Bergmann S, Vollenweider P, Waeber G, Laitinen J, Pouta A, Zitting P, McArdle WL, Kroemer HK, Völker U, Völzke H, Glazer NL, Taylor KD, Harris TB, Alavere H, Haller T, Keis A, Tammesoo ML, Aulchenko Y, Barroso I, Khaw KT, Galan P, Hercberg S, Lathrop M, Eyheramendy S, Org E, Sõber S, Lu X, Nolte IM, Penninx BW, Corre T, Masciullo C, Sala C, Groop L, Voight BF, Melander O, O'Donnell CJ, Salomaa V, d'Adamo AP, Fabretto A, Faletra F, Ulivi S, Del Greco F, Facheris M, Collins FS, Bergman RN, Beilby JP, Hung J, Musk AW, Mangino M, Shin SY, Soranzo N, Watkins H, Goel A, Hamsten A, Gider P, Loitfelder M, Zeginigg M, Hernandez D, Najjar
SS, Navarro P, Wild SH, Corsi AM, Singleton A, de Geus EJ, Willemsen G, Parker AN, Rose LM, Buckley B, Stott D, Orru M, Uda M, van der Klauw MM, Zhang W, Li X, Scott J, Chen YD, Burke GL, Kähönen M, Viikari J, Döring A, Meitinger T, Davies G, Starr JM, Emilsson V, Plump A, Lindeman JH, Hoen PA, König IR, Felix JF, Clarke R, Hopewell JC, Ongen H, Breteler M, Debette S, Destefano AL, Fornage M, Mitchell GF, Smith NL, Holm H, Stefansson K, Thorleifsson G, Thorsteinsdottir U, Samani NJ, Preuss M, Rudan I, Hayward C, Deary IJ, Wichmann HE, Raitakari OT, Palmas W, Kooner JS, Stolk RP, Jukema JW, Wright AF, Boomsma DI, Bandinelli S, Gyllensten UB, Wilson JF, Ferrucci L, Schmidt R, Farrall M, Spector TD, Palmer LJ, Tuomilehto J, Pfeufer A, Gasparini P, Siscovick D, Altshuler D, Loos RJ, Toniolo D, Snieder H, Gieger C, Meneton P, Wareham NJ, Oostra BA, Metspalu A, Launer L, Rettig R, Strachan DP, Beckmann JS, Witteman JC, Erdmann J, van Dijk KW, Boerwinkle E, Boehnke M, Ridker PM, Jarvelin MR, Chakravarti A, Abecasis GR, Gudnason V, Newton-Cheh C, Levy D, Munroe PB, Psaty BM, Caulfield MJ, Rao DC, Tobin MD, Elliott P, van Duijn CM; LifeLines Cohort Study; EchoGen Consortium; AortaGen Consortium; CHARGE Consortium Heart Failure Working Group; KidneyGen Consortium; CKDGen Consortium; Cardiogenics Consortium; CardioGram. Genome-wide association study identifies six new loci
influencing pulse pressure and mean arterial pressure. Nat Genet 2011;
43:1005–1011.
22. Kuc S. Maternal characteristics, mean arterial pressure and serum
markers in early prediction of preeclampsia. PLoS One 2013;
8:e63546
23. Moutquin JM, Rainville C, Giroux L, Raynauld P, Amyot G, Bilodeau R, Pelland N. A prospective study of blood pressure in pregnancy:
predic-tion of preeclampsia. Am J Obstet Gynecol 1985; 151:191–196.
24. Fong FM, Sahemey MK, Hamedi G, Eyitayo R, Yates D, Kuan V, Thangaratinam S, Walton RT. Maternal genotype and severe
preec-lampsia: a HuGE review. Am J Epidemiol 2014; 180:335–345.
25. Buurma AJ, Turner RJ, Driessen JH, Mooyaart AL, Schoones JW, Bruijn JA, Bloemenkamp KW, Dekkers OM, Baelde HJ. Genetic
vari-ants in pre-eclampsia: a meta-analysis. Hum Reprod Update 2013;
19:289–303.
26. Szpera-Gozdziewicz A, Breborowicz GH. Endothelial dysfunction in
the pathogenesis of pre-eclampsia. Front Biosci (Landmark Ed) 2014;
19:734–746.
27. Taylor R, Roberts J. Endothelial Cell Dysfunction, 3rd edn. Elsevier: San
Diego, CA, 2009.
28. Spracklen CN, Smith CJ, Saftlas AF, Robinson JG, Ryckman KK. Maternal hyperlipidemia and the risk of preeclampsia: a meta-analysis.
Am J Epidemiol 2014; 180:346–358.
29. Gallos ID, Sivakumar K, Kilby MD, Coomarasamy A, Thangaratinam S, Vatish M. Pre-eclampsia is associated with, and preceded by,
hypertri-glyceridaemia: a meta-analysis. BJOG 2013; 120:1321–1332.
30. Maric-Bilkan C, Symonds M, Ozanne S, Alexander BT. Impact of
maternal obesity and diabetes on long-term health of the offspring. Exp