Morphological Differences of the Articulating Surfaces of Mandibular Condyles in C3H/HeJ and A/J Mice
Neker E. Bernuy, DDS
A thesis submitted to the faculty of the University of North Carolina at Chapel Hill in partial fulfillment of the requirements for the degree of Master of Science in the
School of Dentistry (Orthodontics).
Chapel Hill 2013
iii
ABSTRACT
NEKER E. BERNUY: Morphological Differences of the Articulating Surfaces of Mandibular Condyles in C3H/HeJ and A/J Mice
(Under the direction of Dr. Eric T. Everett)
iv
. ACKNOWLEGEMENTS
I would like to thank the following for their significant contributions to this project:
Dr. Eric Everett: For his helpful guidance and contribution to the success of this project.
Dr. Lucia Cevidanes: For her enormous cooperation to the research, invaluable guidance,
constructive comments and friendly encouragement during the thesis work.
Dr. Emile Rossouw: For his significant contribution to this work, assistance, and
constructive comments for the improvement of the manuscript.
Dr. Frazier-Bowers: For her thoughtful insight, support and direction.
Drs. Tung Nguyen and Beatriz Paniagua: For their insight and expertise provided
during the development as well as preparation of this project.
v
TABLE OF CONTENTS
LIST OF TABLES ... vi
LIST OF FIGURES ... vii
I. LITERATURE REVIEW ... 1
THE TEMPOROMANDIBULAR JOINT DISEASE ... 1
ANIMAL MODEL AND RATIONALE FOR SELECTING STRAINS TO STUDY TMJ MORPHOLOGIES ... 13
THE USE OF A MOUSE MANDIBLE AS A MODEL TO STUDY DEVELOPMENT AND EVOLUTION OF COMPLEX TRAITS ... 21
MORPHOMETRICS ANALYSIS ... 25
IMAGE ANALYSIS PROCEDURES ... 33
REFERENCES ... 38
II. MANUSCRIPT ... 46
INTRODUCTION ... 46
MATERIALS AND METHODS ... 49
RESULTS ... 53
DISCUSSION ... 57
CONCLUSIONS... 62
FIGURES ... 63
TABLES ... 73
vi
LIST OF TABLES
Table 1. Origin and insertion of muscles of mastication ... 4 Table 2. Signs and symptoms observed in patients with TMD ... 7 Table 3. Maximum difference values between A/J and C3H/HeJ strains
at 3-5 weeks, 6-8 weeks and 9-11 weeks of age ... 73 Table 4. Maximum difference values among A/J strains of mice
vii
LIST OF FIGURES
Figure 1. Methodology used for shape analysis of the condyles... 63
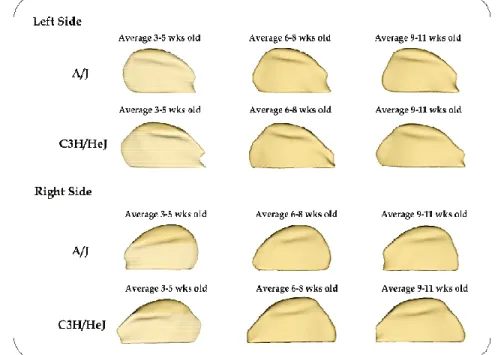
Figure 2. Composite average surface models for each age group, strain and side ... 63
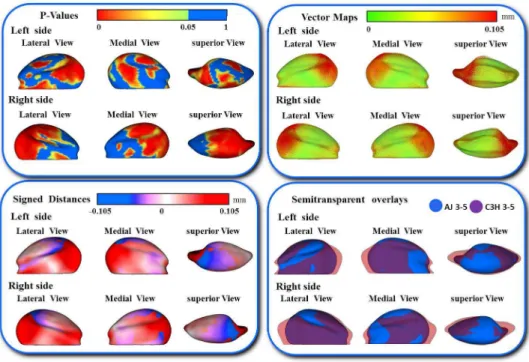
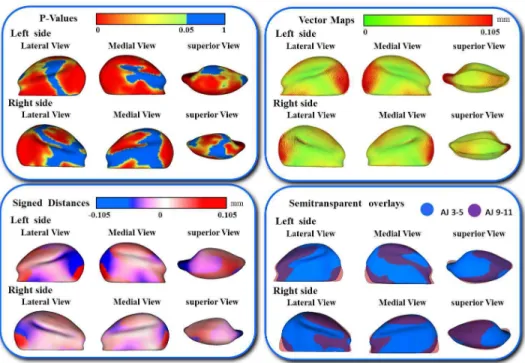
Figure 3. Shape analysis between A/J and C3H/HeJ strains at 3-5 weeks of age ... 64
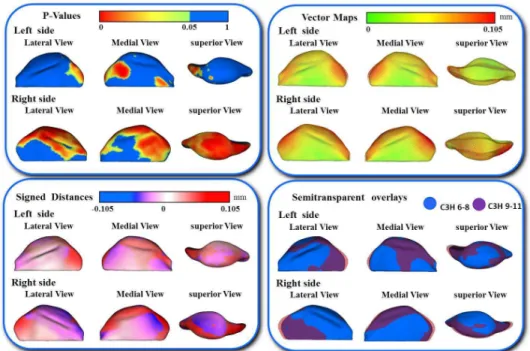
Figure 4. Shape analysis between A/J and C3H/HeJ strains at 6-8 weeks of age ... 64
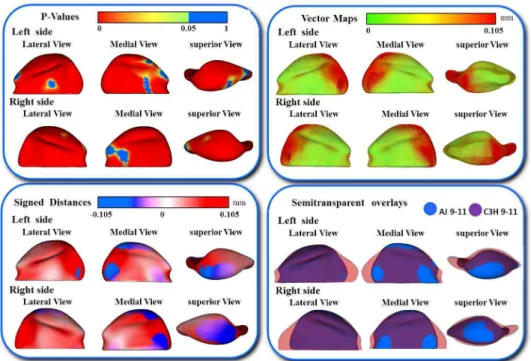
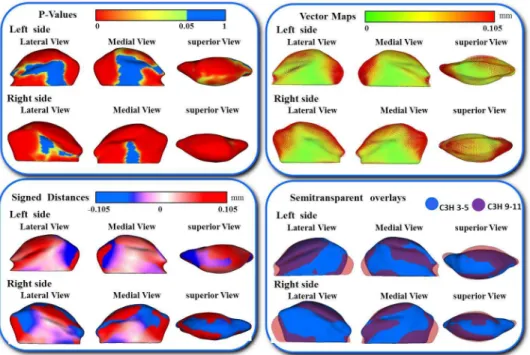
Figure 5. Shape analysis between A/J and C3H/HeJ strains at 9-11 weeks of age ... 65
Figure 6. A/J shape analysis at 3-5 weeks and 6-8 weeks of age ... 65
Figure 7. A/J shape analysis at 6-8 weeks and 9-11 weeks of age. ... 66
Figure 8. A/J shape analysis at 3-5 weeks and 9-11 weeks of age ... 66
Figure 9. C3H/HeJ shape analysis at 3-5 weeks and 6-8 weeks of age ... 67
Figure 10. C3H/HeJ shape analysis at 6-8 weeks and 9-11 weeks of age. ... 67
Figure 11. C3H/HeJ shape analysis at 3-5 weeks and 9-11 weeks of age ... 68
Figure 12. Individual morphological variability of the A/J strain at 3-5 weeks of age ... 69
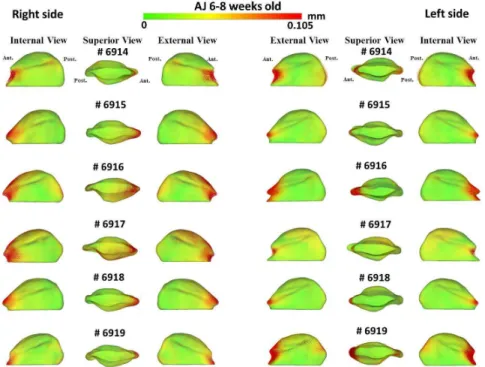
Figure 13. Individual morphological variability of the A/J strain at 6-8 weeks of age ... 69
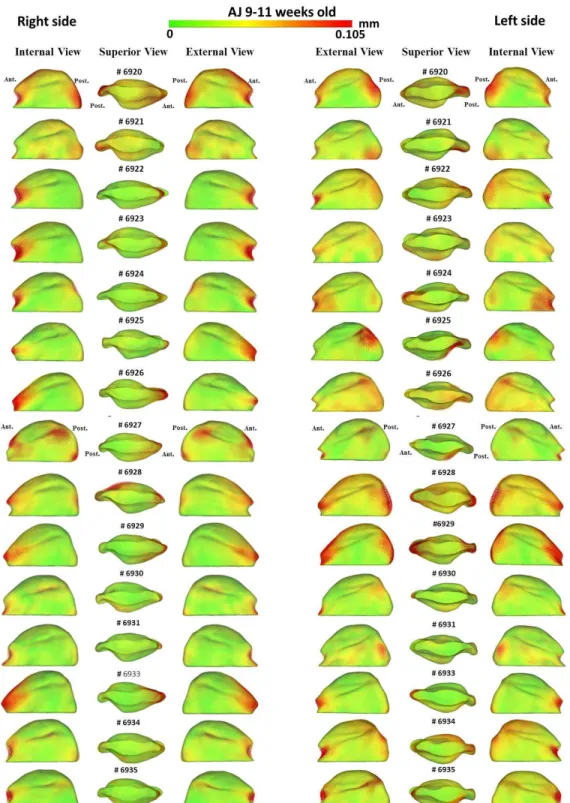
Figure 14. Individual morphological variability of the A/J strain at 9-11 weeks of age ... 70
Figure 15. Individual morphological variability of the C3H/HeJ strain at 3-5 weeks of age ... 71
Figure 16. Individual morphological variability of the C3H/HeJ strain at 6-8 weeks of age ... 71
1
I. LITERATURE REVIEW
1. THE TEMPOROMANDIBULAR JOINT DISEASE
Temporomandibular joints (TMJs) are bilateral synovial joints that play crucial roles in the process of speech, mastication, and deglutition. TMJs are key structures in the craniomandibular apparatus because they allow movement of the mandible in three planes of space, antero-posterior, vertical, and lateral movements. During growth and development of the craniomandibular complex, TMJs influence upper and lower jaw relationships, occlusion, and the masticatory system. Temporomandibular joint disorder (TMD) is described as functional and structural abnormalities of the muscles, tendons, ligaments, blood vessels, and other tissues associated with the temporomandibular joint [1, 2].
The debilitating effects of TMD include muscle stiffness, locking of the jaw and radiating pain in the face, jaw and neck. It is estimated that 75% of the U.S.
population may experience TMD at least once in their lifetime with more prevalence in women than in men. The research indicates that, during any given year, 10% of women and 6% of men have TMD pain, which translates to 20 million adults. [3]
1.1. Joint Embryology
2
and formation of the articulating disc and capsule. During the first stage, the formation of the TMJ cavity is delayed and is not visible. The second stage is termed the cavitation stage, which occurs around weeks 9 to 11 of development. During this stage, the
development of the inferior region of the joint cavity occurs on the squamous part of the temporal bone by intramembranous ossification, and the initiation of condylar
chondrogenesis occurs as well. The third stage of development, the maturation stage, begins during week 12. During this stage, no significant changes are observed because the joint cavity is already well defined; hence, we can observe a well demarcated tympanosquamosal fissure fully formed on the squamous portion of the temporal bone. By week 14, Meckel’s cartilage has undergone a significant anatomical volume reduction and by week 17, consolidation of the anterior portion of the condyle and the lateral pterygoid muscle has been established. During this final stage, we observe the last anatomical incorporation between the lateral pterygoid muscle, the condyle and the antero-internal two-thirds of the articular disc. [4]
1.2. Joint Anatomy
The TMJ consists of many components that work as a unit, these are: the mandibular condyle, the temporomandibular fossa, the articular disc, the joint capsule, the ligaments, the muscles of mastication and the blood and nerve supply. The
3
The second component is located on the squamous region of the temporal bone; this anatomical structure is the temporomandibular fossa. Anteriorly, it is bound by the articular tubercle and posteriorly by the tympanic part of the bone. It is divided into two parts by the petrotympanic fissure.
The third component is the articular disc, also called “the meniscus”, which has a saddle shape and functions to separate the condyle from the temporal bone. The meniscus has a fibrous consistency due to its bands, which vary in thickness [5]. These bands are classified according to thickness with the thin portion at the central intermediate zone; the first thick portion, also called the anterior band, at the posterior articular eminence; and a second thick band, attached to the back of the posterior wall of the mandibular fossa and the squamo-tympanic suture, which was described and named as the posterior bilaminar zone. The location of this band is at the most posterior region of the condylar head [2, 5].
Four areas of fibrocartilage can be observed in the articular region of the mandibular condyle and its articulating disc. The first area, called the articular area, is part of the most superficial layer and is rich in proteoglycan 4 (PRG4) which functions to lubricate the joint. The second area is rich in precursor cells for the flattened and
hypertrophic areas; it is called the polymorphic zone. The third area is called the flattened zone, and the fourth and deepest area is the hypertrophic zone. It is in this last area (the hypertrophic zone) that collagen type X (Col X) expression characterizes the
4
Another crucial component of the TMJ is the joint capsule. Its role is to enclose the joint with its thin consistency to provide stabilization for the complex movements and functions of this articulation. Three ligaments form part of the joint capsule. The major one is the temporomandibular ligament, and the two minor ligaments are the
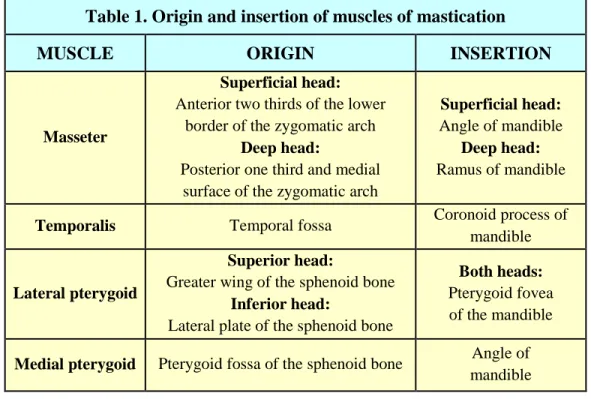
sphenomandibular and stylomandibular ligaments. The muscles that are part of the TMJ are the masseter, the temporalis, the lateral pterygoid and the medial pterygoid. Their origin and insertion are described in (Table 1). [5]
Table 1. Origin and insertion of muscles of mastication
MUSCLE ORIGIN INSERTION
Masseter
Superficial head:
Anterior two thirds of the lower border of the zygomatic arch
Deep head:
Posterior one third and medial surface of the zygomatic arch
Superficial head:
Angle of mandible
Deep head:
Ramus of mandible
Temporalis Temporal fossa Coronoid process of mandible
Lateral pterygoid
Superior head:
Greater wing of the sphenoid bone
Inferior head:
Lateral plate of the sphenoid bone
Both heads:
Pterygoid fovea of the mandible
Medial pterygoid Pterygoid fossa of the sphenoid bone Angle of mandible
1.3. Etiology of TMD
Temporomandibular Disorders (TMDs) are developmental and acquired
pathologies of the hard and soft tissues of the TMJs which affect the size, the form and the functional relationship of the components of the TMJs. TMDs have become common conditions with very high treatment costs. The etiology of TMDs is multifactorial.
5
considerable controversy among investigators regarding other possible causes of TMD. Many theories have evolved, which seem to be designed to justify a particular therapy rather than address the actual cause of the disorder [8].
Trauma to the temporomandibular joint can trigger development of symptoms related to TMD, but may not necessarily initiate the disorder. Trauma due to automobile accidents (e.g. whiplash) is one of the most common causes of TMD. The disorder may also arise from a blow to the face resulting in damage or fracture of the condyles which precipitate an alteration in the function of the TMJ. This alteration can be due to the stretching of the ligaments or the formation of scar tissue due to internal bleeding [9]
Diseases such as rheumatoid arthritis, gout, neoplasia and osteoarthritis also play major roles in the etiology of TMDs. In these disease processes, the inflammatory condition disturbs the equilibrium between the destruction and the repair of joint tissue, thereby compromising its integrity. Osteoarthritis has been a topic of several major research studies due to its progressive nature, in which degeneration of the joint occurs by bony changes and destruction of the disc, ultimately resulting in muscle pain and compromised function of the TMJ [10].
6
results showed that in the healthy patients, the T/T genotype was over-represented, while in the patients with TMD, the C/C genotype was over-represented. They concluded that TMD development may be related to the T102C polymorphism. Despite these findings the overall amount of research done in this field is low, and the results are inconclusive [11].
An additional cause of TMD may be alterations in the stomatognathic system that can occur as a result of changes in posture and parafunctional habits (e.g., bruxism, teeth clenching, and lip biting). These factors may create a predisposition for the development of TMD [12]. Even though parafunctional habits have been thought to cause TMJ, microtrauma and muscle hyperactivity than can lead to TMD. These habits are also present in asymptomatic patients, creating a weak relationship between parafunctional habits and TMD. The prevalence of bruxism reported by Seligman (1988) showed that a higher number of patients experienced bruxism when they were evaluated clinically (48-58%) than when they were assessed by questionnaire (8-21%)[13]. Buescher (2007) suggested that psychosocial factors such as anxiety, stress, depression and other
emotional disturbances exacerbate temporomandibular disease, especially in patients who experience chronic pain. Regardless of the differences of opinions about the influence of habits and head posture that may lead to the development of TMD, anything that could aggravate a pre-existing condition should be avoided. [12, 13]
7
facial pain that leads to related disabilities affecting the jaw, tooth position, and occlusion. Occlusal changes associated with these pathological conditions include a progressive anterior open bite and limitation or deviation of jaw movements (Table 2) [1, 14-16].
Table 2. Signs and symptoms observed in patients with TMD DENTAL
DESTRUCTION
DYSFUNCTIONAL SYMPTOMS PAINFUL
SYMPTOMS • Traumatic occlusion • Clenching • Grinding • Bruxism • Excessive wear • Abrasion of the
dentition
• Limited jaw movement • Deviated jaw movement
• Slow or irregular jaw movement • Limited range of motion
• Joint sounds such as clicking or crepitus
• Locked or dislocated jaw
• Headaches • Facial pain • Pain in the jaw
joints • Ear pain • Ear pressure • Neck, shoulder and
chest pain
1.4. Epidemiology of TMD
The reported prevalence of this disorder varies widely depending on the methodologies and definitions used to diagnose it. Proffit et al (2000) provided an
estimation of the incidence of new cases of TMD based on recorded signs and symptoms, indicating that 5-35% of the population would be affected, which is a much lower
8
49% of patients with TMD pain presented with some kind of radiographic osseous change. [17]
It is estimated that for the 5.3 million U.S. residents who seek treatment for TMD, the cost will be approximately $2.3 billion. TMD was reported to have a significant impact on productivity; 28% of TMD patients were affected to such an extent that they had a limited ability to continue at their current jobs. With this in mind, the projected costs of TMD, based on estimates of the indirect and direct costs outlined by the above researchers, are estimated to be over $4 billion a year [18, 19].
9
1.5. Developmental and Environmental Effects on TMJ
Developmental and environmental stimuli have been shown to affect
craniomandibular morphology including hormonal, vascular, biomechanical and dietary factors. Mechanical stress induced by mastication also affects the mandible especially around the masticatory muscles and mandibular condylar cartilage, as well as progressive changes to the pattern of development and growth of the mandible. Bouvier (1981) demonstrated differences between growing monkeys raised on a hard food diet and those raised on a soft diet.
“Monkeys raised on hard diets showed more cortical bone remodeling, higher density connective tissue, higher subchondral bone, thicker condylar articular cartilage, and greater mandibular depth and cortical bone thickness compared to the temporomandibular joint of soft diet macaques” [25].
Tuominen (1993) demonstrated that the mandible of rabbits change shape with different diets and that functional stress influences the shape of the articular eminence and the intermaxillary relationship [26]. Additionally, another study on rats evaluated the ramus heights of two different diet groups and demonstrated that rats fed with hard diets presented with greater ramus heights than those fed with soft diets. Furthermore, a different study where the condylar dimensions were evaluated in different diet groups showed that rats fed a hard diet presented with greater condyle dimensions and greater spongiosa volumes compared with rats fed a soft diet, because the lateral and inferior periosteal bone growth, along with condylar elongation, were slowed with the soft diet [27].
10
that the hypertrophic chondrocyte zone of mandibular condylar cartilage experiences a change in thickness in rats fed on a hard diet. There are several rat and rabbit studies that have evaluated the effects of altering TMJ force application by differing loading
regimens, tooth extraction, incisor trimming, unilateral bite rise or corticotomy, all of which have been shown to result in gene expression changes and elevated
glycosaminoglycan (GAG) levels in condylar cartilage [26, 29, 30]. In contrast, a study by Chen (2009) demonstrated in an altered functional loading mouse model where the incisor teeth are trimmed frequently and animals placed on a soft diet demonstrated morphological changes in the condylar heads and altered expression of Col2a1, Vegfa, Col1a1, Tnfsf11 and Sox9 genes compared to the normal masticatory loaded (standard
mouse chow hard diet) group after 6-weeks.[31] 1.6. Genetic Control of TMJ Development
11
important to mention that members of the fibroblast growth factor (Fgf),
bone-morphogenetic protein (Bmp), endothelin (ET), hedgehog (Hh), platelet-derived growth factor (Pdgf) and epidermal growth factor (Egf) families of signaling molecules induce regional expression of downstream target genes in the ectomesenchyme [32, 33] .
Many gaps in the knowledge exist, particularly a complete understanding of the genetics behind the development of the TMJ as a synovial joint. Several components of the Hh signaling pathway are expressed in the condyle and disk of the developing TMJ. It was demonstrated that mice deficient in the gene Gli2 displayed abnormal TMJ
development to the extent that the growth-plate-like cellular organization is lost, and the TMJ does not form a disk. The formation of the TMJ disk is a two-step process,
dependent upon Hh signaling. First, there is basic disk formation, which is then followed by disk maturation and culminates in separation from the condyle and formation of the lower joint cavity [34].
12
It is remarkable that in mutant mice, condyle and disc formation are not affected, suggesting that the glenoid fossa is not necessary for development of these structures. Future studies should explore how sprouty genes and other muscle growth and
differentiation signals are related, as well as how these affect fossa formation. [35] Further molecular understanding of TMJ organogenesis is essential for improving diagnosis and developing new therapeutic approaches for TMJ disorders. Phenotypic analyses of animals in which candidate genes are overexpressed in the developing mandible may provide the needed information about the roles of gene products. The phenotypic characterization at each developmental stage of mice with a known genetic background that are subject to controlled environmental factors has the potential to differentiate between the developmental effects of growth, as well as lead to the
development of tools for diagnosing pathological phenotypes in temporomandibular joint disorders [32] .
13
2. ANIMAL MODEL AND RATIONALE FOR SELECTING STRAINS TO STUDY TMJ MORPHOLOGIES
2.1. Role of Mice in Biomedical Research
Rodents are recognized as a useful animal model for biomedical research. Through the routine use of recombinant DNA and the ability to isolate cloned copies of genes and compare DNA of different organisms, we have learned that placental
mammals, including mice and humans, are much more genetically similar than previously believed. Since mouse and rat embryonic development parallels that of humans, we are able to study their genetic development to provide information about complex traits in humans. Also, their utility as model organisms is enhanced by our ability to modify their genomes (transgenic and gene targeted animals) [37].
Additional advantages that mice provide are low cost, short gestation time (19–21 days, depending on the strain), short generation time (10 weeks from being born to giving birth), females reproduce prolifically in the lab with an average of 5-10 pups per litter, and mice have an accelerated lifespan. These advantages permit studies to be conducted and completed within a few years, rather than the decades it would take to study larger mammals. The value of mice also comes from their sharing many complex diseases with humans, i.e. cancer, aging, arthrosclerosis, and diabetes [38]. It is important to mention that, among mammals, the mouse is second only to humans in the frequency and variety of spontaneous cancers it may develop, which makes it an excellent instrument for research in the cancer field [39].
14
and progression in a manner not always possible in humans. The easy manipulation of the mouse’s genetic makeup allows the development of new strains with gene knockout, gene overexpression and genetic breeding strategies [40]. Furthermore, we already know that human genetic characteristics are similar to those of mice; with the exclusion of identical twins, the genetic load in human beings differs significantly from one person to another, making studies of genetic variation in humans very difficult. Well-distinguished animal lines, such as murine inbred strains, can be engineered to have phenotypes related to human disease, and are consequently used to study and analyze homogeneous
populations [37, 38]. Another advantage of working with inbred strains is the potential for reproducing and advancing experiments involving genetically uniform mice; researchers can be confident that the mice used in experiments today are almost genetically identical to mice of the same strain used years ago. Genetic similarities in mice make it easier for researchers to understand complex traits, diseases, susceptibilities and adaptations which occur in mice and later use that information to make conclusions about humans, who are more genetically diverse. Finally, many strains of laboratory mice exist. In order to conduct effective research, it is important to understand the origin and the history of a particular mouse strain to effectively make relevant findings with controlled variability[37, 39, 40].
2.2. Origin Of The Mouse
15
development of farming and domestication of animals led to the establishment of permanent villages where people would store dry grains they had harvested in shelters. The storage of food in granaries and cupboards created the perfect environment for mice, and thus began their longstanding relationship with humankind [37]. Mice followed humans as they wandered from their villages in the Middle East in search of new lands to cultivate. They were able to board merchant ships, which carried them off to distant lands throughout the inhabited world. In many parts of the world with harsh natural
environments, human habitation provided mice with the shelter necessary for their survival. Today, mice can be found wherever human settlements exist, in both rural and urban areas, extending to the north and south of both hemispheres, and even at altitudes as high as 15,600 feet [39].
2.3. Domestication of the laboratory mouse
The word ‘mouse’ comes from the Latin ‘mus’ and Greek ‘mys’, both of which mean “to steal." The etymology is a reflection of mice’s ability to penetrate enclosed spaces and raid human food stores. In fact, the domestication of cats, which began with the ancient Persians and Egyptians, is believed to be directly related to the nuisance caused by mice and the attempt to safeguard human stores of food [37, 39].
16
new varieties of mutant lines. This particular predilection for unique coat colors and patterns extended into the nineteenth century, when the house mouse became “an object of fancy” that spread throughout Europe, China and Japan. Experimentation of breeders with different mice to obtain new patterns was common. At the end of the nineteenth century and beginning of the twentieth century, breeders from different parts of Europe and America came up with unique names like white English sable, creamy buff, red cream, and ruby-eyed yellow as ways to mark the uniqueness of their “fancy mice” [37] [41].
The initial contact of Fanciers, as they were known, with American geneticists occurred through Miss Abbie Lathrop, a retired school teacher dedicated to the breeding of pet mice. Coincidentally, her house and farm were located close to the Bussey
Institute, which was directed by William Castle of Harvard University, who was provided with fancy mice by Lathrop for early experiments in mice genetics. Lathrop bred mice from 1910 until her death in 1918, and many of the common inbred lines used today come from animals provided by Lathrop, including the C57BL/6 and C57BL/10 (commonly abbreviated as B6 and B10) [39].
2.4. Inbred Strains of mice
17
the establishment and production of inbred strains with tumors for experimentation and the generations of precious mutant strains [41].
The process used to obtain a new inbred strain of mice starts with the mating (also called "outcross") of two animals or strains considered genetically dissimilar. The first offspring resulting from this mating is called “First Filial generation” (F1). Because both parents are not genetically similar to each other, the F1 siblings won’t be identical to each other, and this is always the first breeding step in a linkage analysis. The next step is the mating of two F1 siblings, and the result of this mating is called “second filial
generation” (F2). The progressive mating between F2 siblings will produce F3 animals, and this process will continue. An important point that we need to remember, is that this mating needs to be done between brother and sister of each generation following the initial outcross [37, 42].
18
of 99.8% homogeneity. At 40 generations, 99.98% will be homozygous. Mice at 60 generations or higher can be considered 100% homozygous and genetically
indistinguishable from all siblings and close relatives. [37, 39] 2.5. Genealogies of inbred mouse strains
Inbred mice are the organisms used today for modeling human disease, and we can trace their origins to the domesticated “fancy mouse.” Today, over 450 different inbred strains of mice exist, with some new strains being developed and other strains becoming extinct [41, 43].
Looking for the origin of the inbred strain, we determined that the first inbred line was DBA, developed by Clarence Cook Little in 1909, who had a predilection for
genetics, biological individuality and cancer research. Over the following decade, new inbred strains were developed, such as the C57BL that came from the breeding of 57 females with 52 males; by 1918, Clarence Little, as director of the Cold Spring Harbor Laboratory, led the development of new inbred lines with his colleagues Leonell Strong and E.C. MacDawell [37, 39]. They developed the famous B6, B10, C3H, CBA, and the BALB/c. The crucial advantage of the development of these inbred lines was allowing independent researchers in different parts of the world to compare their results globally [37].
2.6. Strains used for the research 2.6.1. A/J inbred strain
19
Bagg albino and an albino from Cold Spring Harbor stock, which gives its coat a white color. This strain of mice has been used in many types of research,
including cancer research and in physiological and morphological studies. The A/J inbred strain is present with a moderate incidence of mammary tumors, primary lung tumors, and with relative high incidence of spontaneous cleft palate sometimes in newborns due to exposure to a variety of agents. By 1990, the A/J strain had 216 filial generations and could be considered 100% homozygous and genetically indistinguishable from all siblings and close relatives [41, 43]. 2.6.2. C3H/HeJ inbred strain
The C3H/HeJ was developed by Leonell Strong (1920), and this inbred strain is a result of mating a Bagg albino female and a DBA/J male. By 1990, the inbreeding process was in the 202nd “filial generation” (F202) [41]. This inbred strain is used to conduct research of mammary tumors, hepatomas in males, and bone
development [44, 45]. Previous studies determined that the C3H/HeJ reaches maximal skeletal biomechanical properties before 16 weeks of age. At this age, C3H/HeJ bone stiffness increased, but strength remained constant, work to failure decreased, and bone became more brittle [44]. A characteristic during
development is nipping tails due to high density populations at the C3H/HeJ cage, without prior knowledge, the lesions developed by this practice can be confused with mousepox or rejected graft [41].
20
different strains of mice have often been identified as a model system for high bone mass (C3H/HeJ) and low bone mass (A/J) phenotypes, respectively[46]. The A/J mouse has a smaller condylar process than the C3H/HeJ; the anterior area of the mandible and the posterior area of the mandible are smaller in size, as well. But, A/J possesses a bigger skull length (23 mm) than C3H/HeJ (21.9 mm), and both possess the same lower jaw length (10.9 mm). The differences between these strains provide the basis for conducting research to determine the morphological differences between these two strains [47].
2.7. Complex Traits
21
3. THE USE OF A MOUSE MANDIBLE AS A MODEL TO STUDY DEVELOPMENT AND EVOLUTION OF COMPLEX TRAITS
Due to the detailed knowledge of the anatomy and development of the mouse mandible, it has long been used as a model for the development of complex structures. Studies using inactivation, or “knockout” of specific genes, demonstrated the effects of these genes on the development of the mandible in different parts [35, 49].
Consequently, the mouse mandible has become an effective model for studying the evolution and development of complex morphological structures in humans. With the use of quantitative methods, we can analyze the effect of genes on the mandible shape. This can help us to understand more clearly the action of genes in the development and evolution of mandibular structures [50]. During the evaluation process, authors
hypothesized that morphological integration results from a relationship between function Right hemi-mandibles viewed buccally from twelve different inbred strains of mice illustrate normal
22
and development, and as a result of this expression, the outcome will tend to evolve together as a unit [51, 52].
Morphological integration can stem from genes, whose products are involved in the developmental process, or it can result from muscular influences as well; direct muscle influence can change the development of the mandibular process as reported by Atchley (1991) [50].
One of the first techniques used to measure the change of the mandible utilized finite element scaling, where well-known mathematical and theoretical traditions that had a long history in the engineering sciences were used. This procedure allows localization of morphological differences between forms [51, 53]. A different technique used by most geneticists evaluates the shape characteristics of the mandible in terms of the relative size; an evaluation of these parts using a series of pairwise linear distances among mandibular landmarks to characterize mandibular morphology is then performed [54].
Soon after the introduction of the geometric concept of shape, focus on features like outlines, angles, or the geometric configuration of a set of landmarks was used for the evaluation of localized morphometric variations. In order to locate quantitative trait loci (QTL) for a change of shape, which is comprised of both magnitude and direction when evaluated in three planes of space, it is necessary to combine geometric
23 3.1. Embryologic Development of the Mandible
The cells of the mandible have odontogenic, chondrogenic and skeletogenic origins. The mandible originates from neural crest cells that have their origin in the neural tube. These epithelial neural crest cells elongate and reposition organelles basally to move away from the neural tube, sending processes through the basal lamina and then transforming into mesenchymal cells. Condensation areas arise as a result of epithelial-mesenchymal interactions, which are considered to be the first signs of differentiation of the skeletal element. Once the condensations have formed, cell differentiation and morphogenesis can begin. Having undergone the epithelial-to-mesenchymal
transformation, these neural cells will be the beginning of the mandibular arch, muscle and connective tissue. Therefore, the mandible is formed partially by active migration and partially by passive displacement [56, 57].
Studies done by Lee (2001) determined the existence of a Mandibular Primary Growth Center (MdPGC) that was described as, “a point of concentric radiopacity at the apical area of deciduous first molars, from which linear trabecular bones radiate to all directions of the mandible”. This growth center is important because of the
morphogenetic implication of the development of the mandible and because it is a point, from which mandibular growth could be measured, based on the radiating trabeculae that eventually form the body of the mandible. Moreover, this point was also the beginning of the endochondral ossification of the condyle [57].
24
bone or can become chondroblasts when needed for fracture repair. Yet another
population of skeletogenic cells produces osteoblasts and secondary chondroblasts that form the coronoid, condyloid and angular processes. The origin of the muscles comes from mesodermally derived mesenchyme, and these muscles influence mandibular development and growth [33, 58].
The origin source of the condyle is endochondral ossification, a process that involves numerous genes. During endochondral ossification, different gene families encode important signals that are consistent with bone formation. Both condyle and fossa contain important features that contribute to the development of the temporomandibular joint. The similarities and differences among the cells present in the chondroprogenitor layer are other issues that should be considered when deciding whether disorders develop in the early stages of jaw development or later in life [59].
3.2. Measures of temporomandibular joint bone morphology
The Senate Report Language for TMJ disorders urged the National Institute of Dental and Craniofacial Research (NIDCR) to work with the National Institute of Arthritis and Musculoskeletal and Skin Disease (NIAMS) and the National Institute of Biomedical Imaging and Bioengineering (NIBIB) to create measures for studying TMJ bone structure, degradation, and repair. In 1996, the NIH (National Institute of Health) Technology Assessment Conference Statement on the Diagnosis and Management of TMDs, suggested that the ideal classification system for the diagnosis of TMDs should be etiologically based rather than symptomology based [60].
25
The RDC/TMD included the Axis I data related to physical diagnoses, primarily based on clinical signs and symptoms, and Axis II data, related to the psychological status of the patient and the pain-related disability. Imaging data are currently used in order to help differentiate disc displacement and arthralgia, osteoarthritis and osteoarthrosis. The results of the RDC/TMD validation project support this practice to enhance the Axis I physical diagnostic protocol. Hence, TMJ imaging recommendations now include computed tomography (CT) and Cone-Beam CT (CBCT) for diagnosis of osseous degenerative changes and MRI for detecting disc displacements and effusion [61].
Radiographic imaging allows evaluation of TMJ hard tissue morphology, thereby providing visualization of a wide spectrum of osseous changes due to growth, adaptive or pathologic processes. A radiographic examination of the TMJ is an essential part of diagnosis and management of TMJ diseases involving the bone supporting the articulating tissues. The growing use of medical imaging, especially RX Computed Tomography, micro-tomography and laser scanners have allowed us to reconstruct 3D images of bony structures. These virtual models and representations have generated new possibilities for quantitative analysis [62, 63]
4. MORPHOMETRIC ANALYSIS
Morphometric analysis is the statistical study of size, shape and shape changes that was applied for first time by Sir D’Arcy Thompson in the early twentieth century,
26
Part of its objective is to evaluate the cause and effect of the forms, and not only focus on the form [64-66].
In different animals and different fields of science, from anthropology to medicine to forensic science, the size and shape of organs have been compared during
developmental stages to ensure that any defect or abnormality is identified. Many studies, such as those done by Klingenberg and Cheverud have quantified morphological differences among structures by translating, rotating and scaling to unit size specimen configurations. Those authors claim that size is distinct from shape, allowing for the separate analysis of these two components, as well as the analysis of their relationship. However, from a biological and clinical perspective, smaller or enlarged condylar sizes are indicative of variability in morphology and/or pathological processes, and size cannot be separated from shape when analyzing the TMJ [49, 51].
Precise quantitative measurements are required for characterization of TMJ morphology and longitudinal assessments; a collection of this data will capture the features of the overall form and characteristics of specific problems under study. Current quantification methods include:
4.1. Unilateral measurements
27 4.2. Volume measurements
Reflect an increase or decrease in size. However, fundamental changes in specific areas are not noticeably reflected in volume measurements. Volume assessment does not reveal location and direction of proliferative or resorptive changes, which are relevant for assessment of clinical results.[67, 68] An alternative to measuring the volume is the three-dimensional coordinates of points that map the content of the closest surface in order to compare the topography or shapes evaluated.
4.3. Landmark-based measurements
In order to analyze the position, size and shape of a particular object or organism, we may use landmarks. These landmarks are points that locate the object in two or three dimensions of space. Using these marks can present errors related to landmark
identification and oversimplified representation of the craniofacial structures [64]. A number of issues relating to the use of landmarks-based data deserve consideration; some of them are mentioned here in the order they are evaluated
i. First, it is important that the landmarks be in same way equivalent or homologous at different time points and across different subjects or specimens. Homologous structures or landmarks in this sense need to be operationally defined on the basis of their correspondence and relations. Locating 3D landmarks on complex curving structures to represent
components of craniofacial form is a problem, and there is a lack of literature to provide standardization.
ii. Second, another problem relating to landmark equivalence may be
28
as the TMJ condyles that undergo continuous bone remodeling throughout life. The displacement of landmarks during ontogeny results from underlying biological processes, such as subchondral growth or bone remodeling. The combination of information from these biological processes with landmark data is required to provide insight into the ontogeny of shape transformation. iii. Third, the way in which inter-landmark distances are commonly collected is
such that no attempt is made to systematically describe the relative location of landmarks, one to another. The result is a collection of measurements that may fail to describe a full 3D disposition of landmarks, as well as an over-sampling of some regions at the expense of others.
iv. Fourth, landmark–based methods leave the form between landmarks un-sampled, as no information related to curvature of the form between landmarks is preserved.
4.4. Thin plate splines
Thin plates are useful for comparing coordinate representations of forms to describe their changes as well as their differences. These shape changes are viewed as a deformation, and when this deformation smoothly rearranges the configuration of landmarks, we are able to estimate maximum stretch and shrinkage due to the
deformation [69]. This technique estimates the difference between two objects by using a series of triangles across the morphology, connecting the homologous points and
29
splines) minimizes the “bending energy” required to take the first form into the second, and if the plate is completely ‘flat,’ then it has zero bending energy. A Cartesian
transformation grid can be constructed using the pair of thin plate splines. The perceiving mapping does not depend on the particular coordinate system, making this a registration-free method for visualizing shape differences [69, 70].
4.5. Finite element analysis
Finite element analysis is used in engineering to measure the effect of loading, and it has been adapted for the mathematical comparison of forms [53, 71]. The analysis uses data derived from a set of interconnected morphological landmarks or nodes to produce a series of triangles or quadrangles. These triangles and quadrangles are 'finite elements' which become the units of morphometric analysis as defined by Richard Courant (1942). These methods are also registration-free since they provide information about the stretching of elements rather than the movements of landmarks relative to the coordinate system [51]. Finite elements have two kinds of methods: homogeneous and non-homogeneous methods.
i. Homogeneous finite element methods assume that shape changes are uniformly distributed throughout each element. This is not necessarily true of biological forms in which an element may span diverse tissue;
consequently, this simplifying assumption of homogeneity may have an effect on the biological interpretation of results. It uses simple unit
30
these changes [64]. Moss (1988) applied the finite element analysis to the mandibles of inbred strains of mice, measuring the morphometric
differences between the two forms [53].
ii. Non-homogeneous finite element methods do not assume homogeneity and use more complex elements (cubes) that allow the computation of local deformations around landmarks. Although the selection of landmarks and finite elements is largely arbitrary, the interpretation of shape changes in particular anatomical regions may differ according to element design [71].
4.6. Biorthogonal Grids
31
4.7. Boundary/Outline, Surface and Medial Axis Morphometric Analysis i. Semi-landmarks or pseudo-landmarks: Several strategies exist for
comparing things or organisms. One approach is to divide the outline of each organism into segments, each of which can be imagined as being delimited by pseudo landmarks. Such pseudo landmarks are operationally, but not necessarily biologically, equivalent to either an evolutionary or developmental sense [66].
ii. Curves: Analysis of curves for statistical interpretation, especially analysis of 3-D structures, comes with many challenges. Comparisons of curves can be made as functions if curves are open, but for closed surfaces, different approaches include tangent angles to points in the outline. These points need to represent operational homologies, be spaced equidistantly around an outline, or represent nodes of the outline divided into equal numbers of segments [66, 72].
iii. Outline/Surface and Medial representation: Medial representation, introduced by Blum in 1967, defines shape by a symmetric axis or
32
determine the medial axis representation and subtle differences in outline form may result in quite different topologies. Since the medial
representation models are based on coarse grids of the medial axis, the shape analysis captures only large scale shape differences, whereas surface shape analysis captures both small and large scale shape differences [64].
4.8. Surface Models
i. Closest Point measurements between the surfaces can display changes with color maps. However, the Closest Point method measures the closest distances, not corresponding distances, between anatomical points on two or more longitudinally obtained images. For this reason, Closest Point measurements fail to quantify large changes in bone during disease progression in a given patient and differences in morphology between individuals [74].
33
spherical harmonic description (SPHARM), which is then sampled into triangulated surfaces (SPHARM-PDM) [74]. These results are better than those obtained using Closest Point (CP) correspondence-based analysis. This standard analysis is currently used by most software systems, but its limitations are that is does not map surfaces based on anatomical geometry and it usually underestimates rotational and large translational movements. For example, in the assessment of surgical outcomes, CP color maps measure surgical jaw displacement as the smallest separation between the boundaries of the same structure, which may not be the correct anatomical corresponding boundaries on anatomical structures pre- and
post-surgery[67, 75].
5. IMAGE ANALYSIS PROCEDURES
34
corresponding spherical harmonic description, which is then sampled into triangulated surfaces [78].
In addition, the differences in the models are visually and statistically assessed using various mapping techniques from each individual in the population to the sample mean. These mapping techniques are the vector mapping technique and distance mapping. Vector maps provide visualization of displacement between paired
correspondent point-based models indicating the magnitude of displacement (expansion or contraction might show depending on the direction of the vector), and distance color maps visualize displacements and localize regions of surface remodeling [79].
A multivariate analysis of covariance is commonly used to calculate and compare the mean group morphology model between the two different strains of A/J and C3H mice. P-value maps for the testing group’s differences are calculated based on the Hotelling T2 metric, based on covariance matrices. Pearson correlation coefficients and their P values compute between individuals global and local morphological variation. Since the scans develop a 3D image, all sides of the mandibular bone are easily viewed and for this reason, any inconsistencies in the bone formation in relation to the ramus or condyle are highlighted for further analysis.
5.1. Micro-CT Technology
35
The micro-CT has recently become the “gold standard’’ for evaluation of bone morphology and micro architecture in mice and other small animal models. Currently available micro CT scanners can provide images of live rodent organs at spatial resolutions from cellular (20 µm) down to sub cellular dimensions (1 µm) and fill the resolution-hiatus between microscope imaging and mini-CT imaging of intact volumes [80].
This scanner can achieve an isotropic voxel size as low as a few micrometers, which is sufficiently small enough to investigate structures such as mouse trabeculae that have widths of approximately 30 to 50 µm. Typically, voxel sizes from micro CT images have three equal dimensions and therefore are described as isotropic voxels. Ideally, the smallest voxel size available would be used for all scans; however, this would require longer acquisition times to collect more projections and generate large data sets. Consequently, the tradeoff between voxel size and scan time should be carefully
considered. In the case of live animals, such as mice, it is almost impossible to obtain the real volume of a bone because scanning time (radiation load) of living tissues should be as short as possible to limit radiation doses absorbed by living tissue during the process of exposure.
There are several advantages of using micro-CT for assessment of bone morphology in different specimens, including mice. It allows for effective 3D
36
rate than typical histologic analyses of histomorphometrical parameters using decalcified bone specimens. Furthermore, assessment of bone morphology by micro CT scanning is non-destructive; therefore, samples can be used subsequently for other assays, such as histologic or mechanical testing. The first study using micro-CT was an examination of subchondral bone changes in a guinea pig model of osteoarthritis. Since that time, micro-CT has been used for a wide range of studies of bone mass and bone morphology, including analysis of growth and development of skeletal phenotypes of different genetically altered mouse strains and animal models used for the study of osteoporosis [82-84].
In summary, TMDs have become a common condition with very high treatment costs. The etiology of TMD is multifactorial, and there exists controversy among authors regarding its different possible causes. TMD is more prevalent in women than in men, and there are approximately 5.3 million Americans currently seeking treatment for this condition. Mouse models have been recognized as useful for the study of this abnormality because mice are genetically very similar to humans.
37
images at spatial resolutions of cellular (20 µm) to subcellular dimensions (1 µm), and provide the best data for the evaluation of the condylar microstructure.
38 REFERENCES
1. Alexiou, K., H. Stamatakis, and K. Tsiklakis, Evaluation of the severity of temporomandibular joint osteoarthritic changes related to age using cone beam computed tomography. Dentomaxillofac Radiol, 2009. 38(3): p. 141-7.
2. Alomar, X., J. Medrano, J. Cabratosa, J.A. Clavero, M. Lorente, I. Serra, J.M. Monill, and A. Salvador, Anatomy of the Temporomandibular Joint. Seminars in Ultrasound, CT and MRI, 2007. 28(3): p. 170-183.
3. LeResche, L., L.A. Mancl, M.T. Drangsholt, G. Huang, and M. Von Korff, Predictors of onset of facial pain and temporomandibular disorders in early adolescence. Pain, 2007. 129(3): p. 269-78.
4. Merida-Velasco, J.R., J.F. Rodriguez-Vazquez, J.A. Merida-Velasco, I. Sanchez-Montesinos, J. Espin-Ferra, and J. Jimenez-Collado, Development of the human temporomandibular joint. The Anatomical record, 1999. 255(1): p. 20-33.
5. Bernard, J.P., The Anatomical Basis of Dentistry. 3rd Edition. ed2001, St. Louis: Mosby.
6. Shibukawa, Y., B. Young, C. Wu, S. Yamada, F. Long, M. Pacifici, and E. Koyama, Temporomandibular joint formation and condyle growth require Indian hedgehog signaling. Dev Dyn, 2007. 236(2): p. 426-34.
7. Ohno, S., T. Schmid, Y. Tanne, T. Kamiya, K. Honda, M. Ohno-Nakahara, N. Swentko, T.A. Desai, K. Tanne, C.B. Knudson, and W. Knudson, Expression of superficial zone protein in mandibular condyle cartilage. Osteoarthritis and cartilage / OARS, Osteoarthritis Research Society, 2006. 14(8): p. 807-13. 8. Mew, J.R., The aetiology of temporomandibular disorders: a philosophical
overview. European journal of orthodontics, 1997. 19(3): p. 249-58.
9. Sale, H. and A. Isberg, Delayed temporomandibular joint pain and dysfunction induced by whiplash trauma: a controlled prospective study. J Am Dent Assoc, 2007. 138(8): p. 1084-91.
10. Cevidanes, L.H., A.K. Hajati, B. Paniagua, P.F. Lim, D.G. Walker, G. Palconet, A.G. Nackley, M. Styner, J.B. Ludlow, H. Zhu, and C. Phillips, Quantification of condylar resorption in temporomandibular joint osteoarthritis. Oral Surg Oral Med Oral Pathol Oral Radiol Endod, 2010. 110(1): p. 110-7.
39
12. Buescher, J.J., Temporomandibular joint disorders. Am Fam Physician, 2007. 76(10): p. 1477-82.
13. Seligman, D.A., A.G. Pullinger, and W.K. Solberg, The Prevalence of Dental Attrition and Its Association with Factors of Age, Gender, Occlusion, and Tmj Symptomatology. Journal of Dental Research, 1988. 67(10): p. 1323-1333.
14. Rodrigues, J.H., D.A. Biasotto-Gonzalez, S.K. Bussadori, R.A. Mesquita-Ferrari, K.P. Fernandes, C.A. Tenis, and M.D. Martins, Signs and symptoms of
temporomandibular disorders and their impact on psychosocial status in non-patient university student's population. Physiother Res Int, 2010.
15. Helenius, L.M., D. Hallikainen, I. Helenius, J.H. Meurman, M. Kononen, M. Leirisalo-Repo, and C. Lindqvist, Clinical and radiographic findings of the temporomandibular joint in patients with various rheumatic diseases. A case-control study. Oral surgery, oral medicine, oral pathology, oral radiology, and endodontics, 2005. 99(4): p. 455-63.
16. Yura, S., K. Ooi, S. Kadowaki, Y. Totsuka, and N. Inoue, Magnetic resonance imaging of the temporomandibular joint in patients with skeletal open bite and subjects with no dentofacial abnormalities. The British journal of oral & maxillofacial surgery, 2010. 48(6): p. 459-61.
17. Wiese, M., A. Wenzel, H. Hintze, A. Petersson, K. Knutsson, M. Bakke, T. List, and P. Svensson, Osseous changes and condyle position in TMJ tomograms: impact of RDC/TMD clinical diagnoses on agreement between expected and actual findings. Oral surgery, oral medicine, oral pathology, oral radiology, and endodontics, 2008. 106(2): p. e52-63.
18. Von Korff, M.R., J.A. Howard, E.L. Truelove, E. Sommers, E.H. Wagner, and S. Dworkin, Temporomandibular disorders: variation in clinical practice. Medical care, 1988: p. 307-314.
19. Dworkin, S.F. and L. LeResche, Research diagnostic criteria for
temporomandibular disorders: review, criteria, examinations and specifications, critique. Journal of craniomandibular disorders : facial & oral pain, 1992. 6(4): p. 301-55.
20. Nilsson, I.M., T. List, and M. Drangsholt, Prevalence of temporomandibular pain and subsequent dental treatment in Swedish adolescents. J Orofac Pain, 2005. 19(2): p. 144-50.
40
22. Magnusson, T., I. Egermark, and G.E. Carlsson, A longitudinal epidemiologic study of signs and symptoms of temporomandibular disorders from 15 to 35 years of age. Journal of orofacial pain, 2000. 14(4): p. 310-9.
23. LeResche, L., L. Mancl, J.J. Sherman, B. Gandara, and S.F. Dworkin, Changes in temporomandibular pain and other symptoms across the menstrual cycle. Pain, 2003. 106(3): p. 253-61.
24. Locker, D. and G. Slade, Prevalence of symptoms associated with
temporomandibular disorders in a Canadian population. Community Dent Oral Epidemiol, 1988. 16(5): p. 310-3.
25. Bouvier, M. and W.L. Hylander, Effect of bone strain on cortical bone structure in macaques (Macaca mulatta). Journal of morphology, 1981. 167(1): p. 1-12.
26. Tuominen, M., T. Kantomaa, and P. Pirttiniemi, Effect of food consistency on the shape of the articular eminence and the mandible. An experimental study on the rabbit. Acta odontologica Scandinavica, 1993. 51(2): p. 65-72.
27. Yamada, K. and D.B. Kimmel, The effect of dietary consistency on bone mass and turnover in the growing rat mandible. Archives of Oral Biology, 1991. 36(2): p. 129-38.
28. Boyd, R.L., C.H. Gibbs, P.E. Mahan, A.F. Richmond, and J.L. Laskin,
Temporomandibular joint forces measured at the condyle of Macaca arctoides. American journal of orthodontics and dentofacial orthopedics : official
publication of the American Association of Orthodontists, its constituent societies, and the American Board of Orthodontics, 1990. 97(6): p. 472-9. 29. Pirttiniemi, P., T. Kantomaa, and T. Sorsa, Effect of decreased loading on the
metabolic activity of the mandibular condylar cartilage in the rat. European journal of orthodontics, 2004. 26(1): p. 1-5.
30. Bouvier, M., Effects of age on the ability of the rat temporomandibular joint to respond to changing functional demands. Journal of Dental Research, 1988. 67(9): p. 1206-12.
31. Chen, J., K.P. Sorensen, T. Gupta, T. Kilts, M. Young, and S. Wadhwa, Altered functional loading causes differential effects in the subchondral bone and condylar cartilage in the temporomandibular joint from young mice. Osteoarthritis and Cartilage, 2009. 17(3): p. 354-361.
41
33. Cobourne, M.T. and P.T. Sharpe, Tooth and jaw: molecular mechanisms of patterning in the first branchial arch. Archives of Oral Biology, 2003. 48(1): p. 1-14.
34. Purcell, P., B.W. Joo, J.K. Hu, P.V. Tran, M.L. Calicchio, D.J. O'Connell, R.L. Maas, and C.J. Tabin, Temporomandibular joint formation requires two distinct hedgehog-dependent steps. Proc Natl Acad Sci U S A, 2009. 106(43): p. 18297-302.
35. Purcell, P., A. Jheon, M.P. Vivero, H. Rahimi, A. Joo, and O.D. Klein, Spry1 and spry2 are essential for development of the temporomandibular joint. Journal of Dental Research, 2012. 91(4): p. 387-93.
36. Scafoglieri, A., P. Van Roy, and J.P. Clarijs, [Left-right asymmetries and other common anatomical variants of temporomandibular articular surfaces]. Nederlands tijdschrift voor tandheelkunde, 2008. 115(1): p. 14-21. 37. Silver, L.M., Mouse Genetics - in Oxford University Press1995. 38. Hedrich, H., The Laboratory Mouse ed. S. edition2012.
39. Morse, H.C., Origins of Inbred mice1978, Maine.
40. Gama Sosa, M.A., R. De Gasperi, and G.A. Elder, Animal transgenesis: an overview. Brain Struct Funct, 2010. 214(2-3): p. 91-109.
41. JacksonLaboratory, T., Handbook on Genetically Standardized JAX Mice. Four Edition ed1991.
42. Guénet, J.L. and F.J. Benavides, Mouse strains and genetic nomenclature. 2011. 43. Beck, J.A., S. Lloyd, M. Hafezparast, M. Lennon-Pierce, J.T. Eppig, M.F.W.
Festing, and E.M.C. Fisher, Genealogies of mouse inbred strains. Nature Genetics, 2000. 24(1): p. 23-+.
44. Voide, R., G.H. van Lenthe, and R. Müller, Differential Effects of Bone Structural and Material Properties on Bone Competence in C57BL/6 and C3H/He Inbred Strains of Mice. Calcified Tissue International, 2008. 83(1): p. 61-69.
45. Everett, E.T., Fluoride's Effects on the Formation of Teeth and Bones, and the Influence of Genetics. J Dent Res, 2011. 90(5): p. 552-60.
42
47. Everett, E., Craniofacial morphology of 14 inbred strains of mice.
MPD:Everett1., in Mouse Phenome Database web site May, 2011., The Jackson Laboratory, Bar Harbor, Maine USA.
48. Lander, E.S. and N.J. Schork, Genetic dissection of complex traits. Science, 1994. 265(5181): p. 2037-48.
49. Klingenberg, C.P., L.J. Leamy, E.J. Routman, and J.M. Cheverud, Genetic architecture of mandible shape in mice: effects of quantitative trait loci analyzed by geometric morphometrics. Genetics, 2001. 157(2): p. 785-802.
50. Atchley, W.R. and B.K. Hall, A model for development and evolution of complex morphological structures. Biological reviews of the Cambridge Philosophical Society, 1991. 66(2): p. 101-57.
51. Cheverud, J.M., S.E. Hartman, J.T. Richtsmeier, and W.R. Atchley, A
quantitative genetic analysis of localized morphology in mandibles of inbred mice using finite element scaling analysis. J Craniofac Genet Dev Biol, 1991. 11(3): p. 122-37.
52. Klingenberg, C.P., Morphological integration and developmental modularity. Annual review of ecology, evolution, and systematics, 2008. 39: p. 115-132. 53. Moss, M., Finite element method comparison of murine mandibular form
differences. J Craniofac Genet Dev Biol, 1988. 8: p. 3-20.
54. Atchley, W.R., A.A. Plummer, and B. Riska, Genetic analysis of size-scaling patterns in the mouse mandible. Genetics, 1985. 111(3): p. 579-595.
55. Duarte, L.C., L.R. Monteiro, F.J. Von Zuben, and S.F. Dos Reis, Variation in mandible shape in Thrichomys apereoides (Mammalia: Rodentia): geometric analysis of a complex morphological structure. Syst Biol, 2000. 49(3): p. 563-78.
56. Smith, R.J. and J. Frommer, Condylar growth gradients: possible mechanism for spiral or arcial growth of the mandible. Angle Orthod, 1980. 50(4): p. 274-8.
57. Lee, S.K., Y.S. Kim, H.S. Oh, K.H. Yang, E.C. Kim, and J.G. Chi, Prenatal development of the human mandible. The Anatomical record, 2001. 263(3): p. 314-25.
58. Atchley, W.R., A.A. Plummer, and B. Riska, Genetics of mandible form in the mouse. Genetics, 1985. 111(3): p. 555-77.
43
60. Anderson, G.C., Y.M. Gonzalez, R. Ohrbach, E.L. Truelove, E. Sommers, J.O. Look, and E.L. Schiffman, The Research Diagnostic Criteria for
Temporomandibular Disorders. VI: future directions. Journal of orofacial pain, 2010. 24(1): p. 79-88.
61. Ahmad, M., L. Hollender, Q. Anderson, K. Kartha, R. Ohrbach, E.L. Truelove, M.T. John, and E.L. Schiffman, Research diagnostic criteria for
temporomandibular disorders (RDC/TMD): development of image analysis criteria and examiner reliability for image analysis. Oral surgery, oral medicine, oral pathology, oral radiology, and endodontics, 2009. 107(6): p. 844-60.
62. Borah, B., G.J. Gross, T.E. Dufresne, T.S. Smith, M.D. Cockman, P.A. Chmielewski, M.W. Lundy, J.R. Hartke, and E.W. Sod, Three-dimensional microimaging (MRmicroI and microCT), finite element modeling, and rapid prototyping provide unique insights into bone architecture in osteoporosis. Anat Rec, 2001. 265(2): p. 101-10.
63. Bouxsein, M.L., S.K. Boyd, B.A. Christiansen, R.E. Guldberg, K.J. Jepsen, and R. Müller, Guidelines for assessment of bone microstructure in rodents using micro-computed tomography. Journal of Bone and Mineral Research, 2010. 25(7): p. 1468-1486.
64. Bookstein, F.L., Morphometric Tools for Landmark Data Geometry and Biology. First Paperback Edition 1997 ed1991: Cambridge University Press.
65. Klingenberg, C. and L. Monteiro, Distances and Directions in Multidimensional Shape Spaces: Implications for Morphometric Applications. Systematic Biology, 2005. 54(4): p. 678-688.
66. Lestrel, P.E., Morphometrics for the life sciences. Vol. 7. 2000: World Scientific Publishing Company Incorporated.
67. Styner, M., I. Oguz, S. Xu, C. Brechbuhler, D. Pantazis, J.J. Levitt, M.E. Shenton, and G. Gerig, Framework for the Statistical Shape Analysis of Brain Structures using SPHARM-PDM. The insight journal, 2006(1071): p. 242-250.
68. Saccucci, M., A. Polimeni, F. Festa, and S. Tecco, Do skeletal cephalometric characteristics correlate with condylar volume, surface and shape? A 3D analysis. Head & face medicine, 2012. 8(1): p. 15.
69. Franchi, L., T. Baccetti, and J.A. McNamara, Jr., Thin-plate spline analysis of mandibular growth. The Angle orthodontist, 2001. 71(2): p. 83-9.
44
71. Richtsmeier, J.T. and J.M. Cheverud, Finite element scaling analysis of human craniofacial growth. Journal of craniofacial genetics and developmental biology, 1986. 6(3): p. 289-323.
72. Bookstein, F.L., Morphometric tools for landmark data: geometry and biology1997: Cambridge University Press.
73. Bookstein, F.L., Linear machinery for morphological distortion. Computers and biomedical research, an international journal, 1978. 11(5): p. 435-58.
74. Gerig, G., M. Styner, D. Jones, D. Weinberger, and J. Lieberman. Shape analysis of brain ventricles using spharm. in Mathematical Methods in Biomedical Image Analysis, 2001. MMBIA 2001. IEEE Workshop on. 2001. IEEE.
75. Paniagua, B., L. Cevidanes, H. Zhu, and M. Styner, Outcome quantification using SPHARM-PDM toolbox in orthognathic surgery. International Journal of
Computer Assisted Radiology and Surgery, 2010.
76. Mildenberger, P., M. Eichelberg, and E. Martin, Introduction to the DICOM standard. European radiology, 2002. 12(4): p. 920-7.
77. Yushkevich, P.A., J. Piven, H.C. Hazlett, R.G. Smith, S. Ho, J.C. Gee, and G. Gerig, User-guided 3D active contour segmentation of anatomical structures: significantly improved efficiency and reliability. Neuroimage, 2006. 31(3): p. 1116-28.
78. Paniagua, B., L. Cevidanes, D. Walker, H. Zhu, R. Guo, and M. Styner, Clinical application of SPHARM-PDM to quantify temporomandibular joint osteoarthritis. Computerized Medical Imaging and Graphics, 2010.
79. AlHadidi, A., L.H. Cevidanes, B. Paniagua, R. Cook, F. Festy, and D. Tyndall, 3D quantification of mandibular asymmetry using the SPHARM-PDM tool box. International Journal of Computer Assisted Radiology and Surgery, 2012. 7(2): p. 265-271.
80. Feldkamp, L.A., S.A. Goldstein, A.M. Parfitt, G. Jesion, and M. Kleerekoper, The direct examination of three-dimensional bone architecture in vitro by computed tomography. J Bone Miner Res, 1989. 4(1): p. 3-11.
81. Muller, R., H. Van Campenhout, B. Van Damme, G. Van Der Perre, J. Dequeker, T. Hildebrand, and P. Ruegsegger, Morphometric analysis of human bone
biopsies: a quantitative structural comparison of histological sections and micro-computed tomography. Bone, 1998. 23(1): p. 59-66.
45
osteoarthritis by microscopic computed axial tomography. Arthritis and rheumatism, 1988. 31(11): p. 1400-5.
83. Enomoto, A., J. Watahiki, T. Yamaguchi, T. Irie, T. Tachikawa, and K. Maki, Effects of mastication on mandibular growth evaluated by microcomputed tomography. The European Journal of Orthodontics, 2009. 32(1): p. 66-70.
46
II. MANUSCRIPT
INTRODUCTION
Mouse models are increasingly recognized as powerful tools for medical research due to their genetic similarity to humans, which makes them very effective for the study of human diseases. Mice are among the smallest mammals known, with a short gestation time and females that prolifically breed in a laboratory environment [1].
The size and shape of the mouse mandible are highly heritable quantitative traits that are sufficiently variable to allow identification of differences between inbred mouse strains [2, 3]. Moreover, many studies have revealed that mouse strain identification can be reliably accomplished by means of discriminant analysis using mandible
measurements [4]. A comprehensive analysis of the mandibular condyle using different strains of mice would provide the necessary information for understanding possible anomalies in the mandible. The contribution of the temporomandibular joint (TMJ) and its condyle to the development of the mandible is significantly related to the development of TMJ disorders (TMDs) [5]. In addition, previous studies have recognized that
environmental factors, such as transverse abnormality and forced bites (bruxism), as well as increasing age, correlate with an increased risk of developing TMDs [6]. In order to detect these sizes and shape disorders, it is important to become familiar with the normal appearance of the condyle in cross-sectional diagnostic images. This detailed
47
precise cause of these disorders, while taking into consideration the fact that mandibular condyles experience changes in size and shape during early growth and development [7-9]. Hence, the development and progression of TMD in humans is multifactorial and complex; using the mouse model to characterize mandibular morphology may provide clues to understand TMD pathology.
TMDs are reported to occur in up to 75% of adults who show at least one sign of joint dysfunction upon examination, which may include clicking, facial pain,
development of a progressive anterior open bite and limitation or deviation of jaw movements [5, 7, 8, 10, 14]. However, only approximately 5% of adults with TMJ symptoms require treatment and develop chronic or debilitating symptoms [10]. The complex etiology associated with TMDs are cited to be due to a history of trauma [11], systemic diseases like juvenile idiopathic arthritis, developmental abnormalities during growth, and psychological stress [9, 12, 13]. This complex and multifactorial disorder can be best investigated through studies of the mandibular condyle. Accordingly, the mouse model provides an ideal system to investigate condylar morphological variation and therefore development.
Since the mouse mandibular condyle is a small anatomical structure,
48
architecture, which links altered bone cell function, mechanical properties, and load-bearing functions of the skeleton [18].
The goals of this pilot study were as follows: I) To compare morphological differences in mandibular condyles in different inbred strains of mice (AJ and C3H/HeJ) with the same genetic background, and in varying age groups (3-5 weeks, 6-8 weeks, and 9-11 weeks) by quantifying the articulating surface of the mandibular condyle bilaterally (right and left); II) To compare morphological differences in the mandibular condyle between the two inbred strains of mice, by comparing the articulating surfaces of the condyle of the mandible between two different inbred strains of mice (AJ and C3H/HeJ) at ages 3-5 weeks, 6-8 weeks and 9-11 weeks; III) To qualitatively determine which part of the condylar articular surface is more stable and less susceptible to morphologic variability within each mouse strain and age group.