DATA-DRIVEN STUDIES OF CALLER BEHAVIOR
UNDER CALL CENTER INNOVATIONS
Brett Hathaway
A dissertation submitted to the faculty of the University of North Carolina at Chapel Hill in partial fulfillment of the requirements for the degree of Doctor of Philosophy in
the Department of Operations at the Kenan-Flagler Business School.
Chapel Hill 2019
Approved by:
ABSTRACT
Brett Hathaway: Data-Driven Studies of Caller Behavior Under Call Center Innovations.
(Under the direction of Vinayak Deshpande and Seyed Emadi.)
ACKNOWLEDGMENTS
I would like to thank the many people who were pivotal in making this dissertation possible. I begin with my co-adviser, Dr. Vinayak Deshpande. The day I met Dr. Deshpande I immedi-ately sensed his passion for impactful research. Under his tutelage that passion has not waned, and I have often left our meetings inspired about what our research can become. Over the past five years Dr. Deshpande has spent much time and effort teaching me how to properly frame research and has steered me towards problems that are academically rigorous and relevant. He has a true gift for illuminating the power of an idea. I consider Dr. Deshpande a mentor and friend as he has believed in me and invested in my success. I am thankful for Dr. Deshpande’s direction throughout this program and look forward to his future guidance.
I would next like to thank my co-adviser, Dr. Seyed Emadi. I feel so fortunate to have received guidance from someone whose research interests are so compatible with mine. It has made our work enjoyable as we drive towards our common goals. Dr. Emadi has pushed me to think more critically and strategically, and trained me to use a set of tools that will be instrumental in conducting future research. I am grateful for his investment of time and effort in me. Dr. Emadi has become a colleague and true friend whom I deeply respect and look forward to interacting with throughout our careers.
his research and teaching. He is a true scientist whose inquisitive nature inspires me to look at research as a fun puzzle to be solved.
I also express my gratitude for the current and former members of the department and staff. Dr. Ann Marucheck was a fantastic teacher and was always willing to lend me an ear during the turbulent first year of the program. The late Dr. Harvey Wagner was a true giant in our field and was always able to cut to the core of the research question. Dr. Adam Merserau always has a positive disposition and outlook on life and has provided me valuable and insightful feedback on my work. Dr. Bin Hu inspires me with his intellectual curiosity and reminds me that we are truly fortunate to be researchers. Dr. Lauren Lu gave me the opportunity to be her teaching assistant, and I appreciate her kindness and advice that I received while serving in that role. Dr. Nur Sunar is never stingy with her much-needed smiles and upbeat attitude. Dr. Ali Parlakturk has taught me the importance of detail orientation. Dr. Jay Swaminathan has such a fantastic gift of distilling the complex into the understandable. I feel that he wants to help every research idea reach its full potential. Dr. Chloe Kim-Glaeser, Dr. Sandeep Rath, and Dr. Sajad Modaresi have brought new enthusiasm to the department and have been very helpful in my job market preparation. I would also like to thank Dr. Brad Staats, whose research inspired me to apply to UNC and who has always been so generous with his time and advice. His positive attitude under intense workload has always astounded me. Finally, I would like to thank Erin Leach, Holly Guthrie, and Kim Yates, who have not only been fantastic at their jobs, but have also been so personally supportive.
has been a great friend who has helped me step back and consider how lucky I really am. I would next like to thank my colleagues in the program. Huck (Hyun-Seok) Lee demon-strates a workman-like, even-keeled approach to the daily grind of research that showed me the importance of temperance. I am also inspired by his commitment to his family and his convictions. I have enjoyed Maggie (Ying) Zhang’s humor and company throughout the pro-gram and admire her talents. Nagarajan Sethuraman has a true passion for research that I seek to emulate and showed me great kindness during a time of great need. Pradeep Pandem has tenaciously pushed through so many challenges and was also a great tennis partner. Oguz Cetin was my lifeline during the challenging coursework. We spent countless hours racking our brains to find solutions to our stochastics, econometrics, and game theory assignments. Also, his wit and humor have been a ray of sun during the storms of the program. He is a genuine person who deserves great things for his honest heart. Herbie (Baiyang) Huang has been an emotional support and an empathetic listener. I admire Anand Bhatia’s intense desire to perform im-pactful research and have enjoyed his company throughout the program. RJ Niewoehner is a genuine person whose commitment to his convictions I admire. Finally, Dayton Steele has brought new energy and passion to this program that has been much appreciated.
There are also several colleagues in other Doctoral programs that I would like to acknowl-edge. Soudipta Chakraborty from the Duke Operations Management Doctoral program helped me considerably with the coursework, and I have enjoyed his humor and infectious laugh. Zhen-huan Lei from the Duke Operations Management Doctoral program was also a tremendous help with the coursework and always attacks problems with vigor. I enjoyed working with Shawn Bhimani from the Duke Operations Management Doctoral program. He is a kind person and has a great heart. Travis Dyer from the UNC Accounting Doctoral program has been a great colleague to talk to and always has an optimistic attitude. Finally, Justin Kent from the UNC Strategy and Entrepreneurship Doctoral program has been wonderfully supportive during our numerous conversations at his cubicle. He and his wife, Jami, have also generously opened up their home to our family several times throughout the program.
diversions. Jonathan Meyers has been a fantastic listener and supporter, and has offered me aid in many ways. He deserves good things for his honest heart. Cody Eilerts and Shay Wolcott have helped me step back and take myself a little less seriously. They are lifelong friends who have been positive influences on me. Finally, Cory and Lindsey Ramage have been huge cheerleaders for me and my family and have always wanted what is best for us. I tremendously value their friendship.
I would next like to thank several members my wife’s family. For my father-in-law, Ron Gregory, this program has helped me better understand and appreciate the hard work and sacrifice you put in for your family. You are a good man who has done much for me. For my mother-in-law, Susan, I am grateful for your fantastic support and listening throughout the program. You have taken the time to understand in great detail what I am undertaking. Your desire to immerse yourself in my path is very meaningful to me. I did not foresee when I joined this family is that I would be gaining such a wonderful and supportive mother. Thank you, Ron and Susan, for all the generosity and kindness you freely give. Also, I would like to thank the rest of the Gregory family (Mina and Larry Lancaster, Todd and Keely Gregory, and Jesse and Ling Gregory) for their support throughout the program.
me. I am also grateful for your wife, Kristine Hathaway, who has shown great love towards you and support for me.
I am also blessed to have four wonderful children who have provided light to my life during the program. For my son, Matthew, I am proud of the growth and maturity you have shown over the last five years. You have helped me see life from different perspectives and become more a empathetic father. I am also grateful that you have been willing to share your talent to help me on the ascetics of certain research presentations. Also, know that the time we spent together watching our favorite show was meaningful to me. For my son, Damon, you are a wonderful man with great desires and I have always admired the determination that is within you. Thank you for sharing your humor and for the memories we have made together hiking. For my daughter, Victoria, you are growing up to be a valiant young woman. Your optimism in the future has been an example for me, and your desire to help and serve others is something to emulate. Finally, for my daughter, Autumn, you are a light bulb whose excitement and energy bring life and joy to our home. Your constant smiles and laughs are infectious and have been a much-needed boon throughout the program.
TABLE OF CONTENTS
LIST OF TABLES . . . xiv
LIST OF FIGURES . . . xvi
1 INTRODUCTION . . . 1
1.1 Don’t Call Us, We’ll Call You: An Empirical Study of Caller Behavior Under a Callback Option . . . 5
1.2 Data-Driven Priority Policies to Enhance Customer Service and Revenue Opportunities Using Past Customer Interaction Information . . . 6
1.3 A Classification Approach for Predicting Caller Abandonment and Redialing Behavior . . . 7
2 DON’T CALL US, WE’LL CALL YOU: AN EMPIRICAL STUDY OF CALLER BEHAVIOR UNDER A CALLBACK OPTION . . 9
2.1 Introduction . . . 9
2.2 Literature Review . . . 15
2.2.1 Customer Behavior in Queueing Settings . . . 15
2.2.2 Callback Research . . . 17
2.3 Data Exploration . . . 19
2.3.1 Description of Callback Policy and Dataset . . . 19
2.3.2 Exploration of Caller Behavior under Callback Policy . . . 22
2.3.3 Motivation for Stuctural Model of Caller Behavior . . . 25
2.4 Model and Estimation Strategy . . . 27
2.4.1 Model Description . . . 27
2.4.2 Estimation Strategy . . . 33
2.5 Estimation Results and Model Validation . . . 37
2.5.2 Model Validation . . . 39
2.6 Counterfactual Analysis . . . 41
2.6.1 Counterfactual Details . . . 42
2.6.2 Steady-State Counterfactual Anlaysis . . . 46
2.6.3 Transient Counterfactual Anlaysis . . . 51
2.7 Discussion and Summary . . . 54
3 DATA-DRIVEN PRIORITY POLICIES TO ENHANCE CUS-TOMER SERVICE AND REVENUE OPPORTUNITIES USING PAST CUSTOMER INTERACTION INFORMATION . . . 57
3.1 Introduction . . . 57
3.2 Literature Review . . . 62
3.3 Data Exploration . . . 64
3.3.1 Data Description . . . 64
3.3.2 Abandonment Trends . . . 66
3.3.3 Redial Trends . . . 69
3.4 Model . . . 71
3.4.1 Model Motivation . . . 71
3.4.2 Model Description . . . 73
3.5 Estimation Procedure and Results . . . 76
3.5.1 Estimation Strategy . . . 76
3.5.2 Estimation Results . . . 77
3.5.3 Model Validation: Out of Sample Testing . . . 82
3.6 History-Based Priority Policy Class . . . 83
3.6.1 CARP Policy Description . . . 84
3.6.2 Flexibilty of CARP Policy Class . . . 86
3.7 Call Center Performance under History-Based Priority Policies . . . 87
3.7.2 Simulation Results . . . 89
3.8 Discussion and Summary . . . 92
4 A CLASSIFICATION APPROACH FOR PREDICTING CALLER ABANDONMENT AND REDIALING BEHAVIOR . . . 96
4.1 Introduction . . . 96
4.2 Literature Review . . . 101
4.3 Data Description . . . 103
4.4 Classification Framework and Classifiers . . . 111
4.4.1 Framing as Classification Problem . . . 111
4.4.2 Candidate Classifiers . . . 112
4.4.3 Features . . . 118
4.5 Classifier Selection and Validation . . . 121
4.5.1 Classifier Training and Selection . . . 122
4.5.2 Classifier Validation . . . 124
4.6 Summary and Future Work . . . 127
5 CONCLUSION AND FUTURE RESEARCH . . . 130
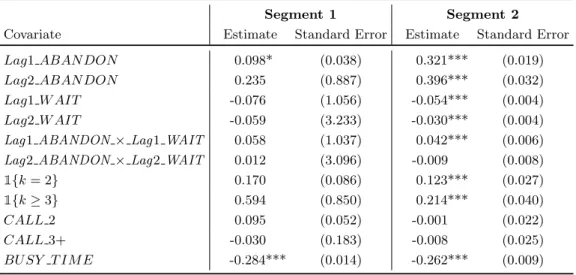
APPENDICES . . . 135
A DON’T CALL US, WE’LL CALL YOU: AN EMPIRICAL STUDY OF CALLER BEHAVIOR UNDER A CALLBACK OPTION . . 135
A.1 Reduced-Form Support of Trends in Callback Behavior . . . 135
A.2 Justification for Time-of-Day Interval Selections . . . 137
A.3 Model Selection . . . 140
A.4 Model Identification . . . 153
A.5 Monte Carlo Procedure for Out-of-Sample Testing . . . 155
B DATA-DRIVEN PRIORITY POLICIES TO ENHANCE CUS-TOMER SERVICE AND REVENUE OPPORTUNITIES
USING PAST CUSTOMER INTERACTION INFORMATION . . . 159
B.1 Mathematical Formulation ofαas(t) . . . 159
B.2 Seasonality Controls . . . 159
B.3 Maximum Likelihood Estimation . . . 162
B.4 Estimates ofαas(t) . . . 165
B.5 Out of Sample Testing . . . 165
B.6 Calculating Horizon Probabilities . . . 167
B.7 Additional Simulation Details . . . 169
C A CLASSIFICATION APPROACH FOR PREDICTING CALLER ABANDONMENT AND REDIALING BEHAVIOR . . . 171
C.1 Defining Caller History . . . 171
C.2 Explanation of Receiver Operator Characteristic (ROC) Curve and the Area Under the Curve (AUC) . . . 174
C.3 Explanation of Lift Charts . . . 177
C.4 Procedure for Predicting Call Center Performance Measures . . . 179
LIST OF TABLES
2.1 Probability of Belonging to each Segment (πs) and Arrival Rate
by Segment (λs) . . . 38
2.2 Estimates of Caller Parameters (Waiting Costs Measured per Minute) . . . 38
2.3 Out of Sample Performance . . . 41
2.4 Steady-State System Performance under Various Callback Poli-cies and Loads . . . 48
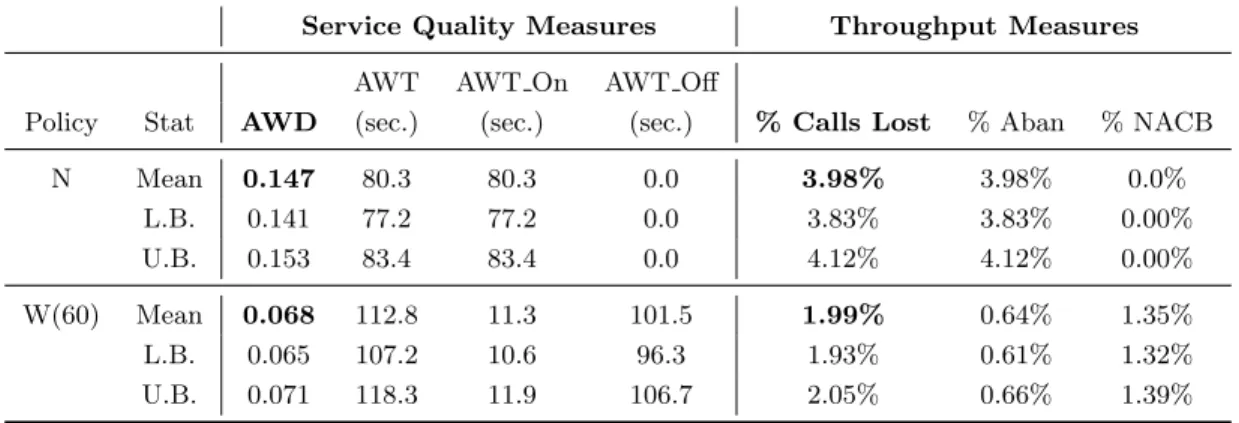
2.5 Transient Scenario System Performance from 10:00 a.m. to 11:00 a.m. under Policies N and W(60) . . . 52
3.1 Summary Statistics for the Cards Service Group . . . 65
3.2 Prior Probability of Belonging to each Segment (πs) and Call String Arrival Rate by Segment (λs) . . . 78
3.3 Estimated Effects of Covariates on Abandonment Probabilities by Segment (βa s) . . . 78
3.4 Estimates of Parameters that Determine Caller Redialing Prob-ability by Segment (αrs and βsr) . . . 81
3.5 Various Performance Measures Under Selected CARP Policies and FCFS Policy . . . 92
4.1 Summary Statistics . . . 106
4.2 Average AUC of Abandonment Classifiers over 5 Folds . . . 123
4.3 Average AUC of Redial Classifiers over 5 Folds . . . 124
4.4 Predicted and Actual Call Center Performance Measures Dur-ing the Test Set . . . 127
A.1 Results of Multinomial Logit Model of Callers’ Initial Decision upon Receiving a Callback Offer . . . 136
A.2 Binary Logit Model of Callback Offer Acceptance by Hour of Day and Day of Week (Controlling for Delay Announcement) . . . 138
A.3 Proportional Hazards Model of Abandonment by Hour of Day and Day of Week (Controlling for Delay Announcement) . . . 139
A.5 Out of Sample Performance of Models (V,O P), (V,O MC),
(E,O P), and (E,O MC) . . . 152 A.6 Steady-State System Performance under Various Callback
Poli-cies and Loads (Small Call Center) . . . 157 B.1 Proportional Hazards Models of Abandonment using only the
Busy Time Control and using More Granular Seasonality Controls . . . 161 B.2 Logistic Regression Model of Redialing using only theBusy Time
Control and using More Granular Seasonality Controls . . . 162 B.3 Estimates ofαas(t) at Endpoints of the Piecewise Linear Function . . . 165 B.4 Out of Sample Testing Results . . . 167 B.5 Actual Summary Statistics and Simulated Summary Statistics
under FCFS Policy . . . 170 C.1 Proportional Hazards Model of Abandonment over Intercontact
LIST OF FIGURES
2.1 Diagram of the Callback Offer Policy . . . 21
2.2 Mean Waiting Time to Receive Service in Online Queue and Mean Waiting Time for Arrival of Callback by Delay Announce-ment (in minutes) . . . 22
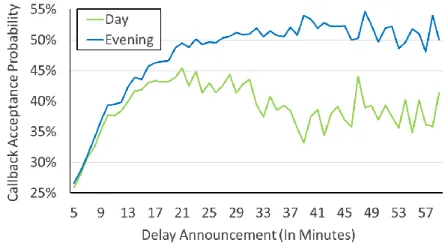
2.3 Percentage of Callers who Accepted the Callback Offer by Delay Announcement 23 2.4 Percentage of Callers who Accepted the Callback Offer by Delay Announcement during Day (6:00 - 17:59) and Evening (18:00 - 0:00) . . . 24
2.5 Percentage of Callers Answering Arriving Callback by Delay Announcement . . . 25
2.6 Callers’ Choice Set at Different Periods, Depending on Whether a Callback is Offered . . . 28
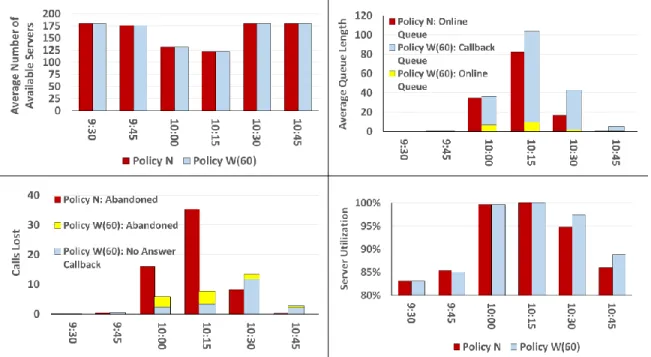
2.7 Various Average Performance Measure during Transient Sce-nario by 15-Minute Interval from 9:30 to 11:00 under Policies N and W(60) . . . 54
3.1 Abandonment Probability by Period . . . 66
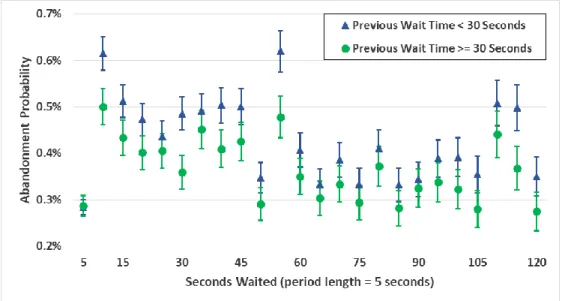
3.2 Abandonment Probability by Period by Waiting Time in Pre-vious Call . . . 67
3.3 Abandonment Probability by Abandonment Outcome in Previ-ous Call . . . 69
3.4 Examples of Possible Call Strings . . . 70
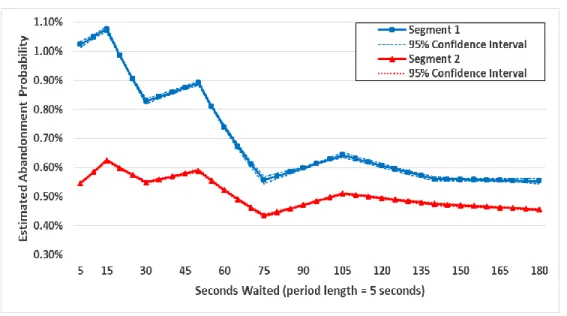
3.5 Estimated Abandonment Probabilities over the First 180 Sec-onds (36 Periods) by Segment . . . 80
3.6 Comparison of Behavior between Segments . . . 82
3.7 Average Waiting Times (AWT) and Percentage of Unique Callers Served (%UCS) Under Various CARP Policies and FCFS Policy . . . 90
4.1 Average Call Volume by Day of Week . . . 104
4.2 Average Call Volume by Hour of Day (Monday through Friday) . . . 105
4.3 Histogram of Intercontact Times (in Days) . . . 107
4.5 Estimated Callers’ Survival Function, Depending on Waiting
Time in Most Recent Call (Includes 95% Confidence Interval) . . . 109
4.6 Estimated Survival Function of Callers Depending on Time Since Most Recent Call (Includes 95% Confidence Interval) . . . 109
4.7 Example of Decision Tree for Caller Redialing Decision . . . 114
4.8 Example of Neural Network for Caller Abandonment Decision . . . 117
4.9 Available Features (Explanatory Variables) by Call Number . . . 121
4.10 ROC Curve and Lift Chart for Abandonment Classifiers using Test Set . . . 125
4.11 ROC Curve and Lift Chart for Redial Classifiers using Test Set . . . 126
B.1 Average Arrival Pattern by Hour of Day and by Day of Week . . . 160
C.1 Example of Receiver Operating Characteristic (ROC) Curve . . . 177
CHAPTER 1
INTRODUCTION
With over 265 billion customer service requests every year, providing customer service costs companies $1.3 trillion annually (IBM, 2017). Furthermore, perceptions of service quality are pivotal in customer retention, which significantly impacts company profitability (Reichfeld and Schefter, 2000). For example, recent surveys have revealed that 66% of customers who have switched brands did so because of poor service (Huffington Post, 2017), and that 68% of cus-tomers did more business with companies due to good customer service (Aspect, 2017). Finally, customer service interactions provide companies with opportunities to sell additional products and services, which can further increase profitability (Farris et al. 2015, ICMI 2011).
Given the high cost of customer service and its significant impact on profitability, compa-nies are increasingly turning to new innovations to improve service quality, reduce operating costs, and increase sales effectiveness. One of the recent innovations in customer service is the introduction of new technologies that enable customers to receive service in a variety of ways. Examples of these new technologies include service channels such as online and video chat, email, social media, mobile apps, and online self-service. Offering a variety of service channels is becoming increasingly important as a recent survey shows that 48% of customers feel that the ability to interact with the company in the manner of their choice is the most important aspect of customer service (Aspect, 2017). Furthermore, companies are using new technology to improve their existing service channels. For example, UPS recently implemented a “visual IVR” which allows customers to use the web or their mobile device to see and navigate through the call center phone menus without dialing the number.
variety of new customer data sources, such as demographics and previous interactions with the company, to predict their preferences and future behavior. Furthermore, new methods for predicting customer behavior (referred to as predictive analytics) are rapidly improving and becoming easier to implement. For example, IBM provides a CRM (Customer Relationship Management) tool that uses customer data and predictive analytics to provide service repre-sentatives their customers’ projected lifetime value, and a recommended product or service that will most likely satisfy them (IBM, 2010). Fedex uses predictive analytics to predict which cus-tomers will defect to a competitor within 60-90% accuracy, and Sprint can identify cuscus-tomers who are 10 times more likely to cancel service than other customers (Morgan, 2019).
Call centers have been on the forefront of implementing customer service innovations using new technology, new data sources, and new predictive analytics techniques. With 2.8 million employees in the U.S. (Statista, 2018) and 3.7 million employees in Europe (Call Center Helper, 2014), call centers are the prevalent customer-facing organizations of many companies. Recent technological innovations in call centers include the use of natural language processing to au-tomate conversations through “voicebots”, streamlined customer authentication through voice recognition (Buesing et al., 2019), and routing customers to agents based on their predicted communication style compatibility (Mattersight, 2018). Call centers have also begun using new data sources and new predictive analytics techniques to improve their operations. For example, McKinsey reports that customer service call centers have used speech and text analytics to reduce average service times by up to 40%, and used predictive analytics, along with caller demographics and purchase history, to increase sales conversion rates by up to 46% (Benjamin et al., 2019).
The second set of questions pertains to the effects of the innovations on call center performance measures. Specifically, managers may be interested in determining how the innovation affects customer perceptions of service quality, operational measures such as average waiting times and system throughput, and opportunities for agents to sell additional products. Considering that investing in new technology, obtaining new data sources, and implementing predictive analytics can be costly and often requires changes in organization and operating procedures, managers should be interested in quantifying the benefits of new innovations. The third set of questions pertains to the call center’s policies under the new innovation. For example, if the call center creates a new service channel, under what circumstances should they offer the channel to customers? Also, if the call center uses new data or new predictive analytics methods to personalize its policies, how should they perform the personalization? In other words, managers may want normative guidance on how to implement call center innovations.
In this dissertation we contribute to the understanding of how to answer such questions by performing three data-driven studies of caller behavior under various call center innovations. Specifically, we study (1) how callers behave under callback technology and how managers can use callback technology to improve operational performance, (2) how managers can use caller history data to predict their abandonment and redialing behavior and prioritize them based on their predicted behavior to improve operational performance, and (3) how managers can use various new predictive analytics techniques (such as machine learning methods) and a variety of customer data sources to better predict caller abandonment and redialing behavior. In each study we rely on unique datasets from the call centers of US-based banks to model caller behavior using a variety of methods, including econometric structural estimation, reduced-form econometrics, and machine learning classification methods. Our models enable us to predict customer behavior under these new innovations and hence quantify their benefits to operational performance. Moreover, because our models can be used to predict caller behavior under a variety of policies, we are able to provide managers with policy guidance for implementing these innovations.
this call center offers callbacks to callers when the system reaches certain congestion levels. To understand how callers decide whether to accept a callback offer and to predict how they would behave under various callback policies that are not observed in the data, we formulate a structural model of their decision-making process under callback technology and use the data to impute the preferences that drive their decisions. These include their preferences for the traditional phone channel and the new callback channel, how much discomfort they experience while waiting for service on the phone, and how much discomfort they experience while waiting for a callback to arrive. Using their imputed preferences, we are able to predict how callers would behave under various callback policies and thus quantify the impact of each policy on performance measures such as service quality and system throughput. Moreover, because we can predict the performance measures of this call center under various callback policies, we are able to make recommendations for how this call center should offer callbacks.
In our second chapter we demonstrate how managers can improve operational performance measures by predicting caller abandonment and redialing behavior based on their history of interactions with the call center, and prioritizing them based on their predicted behavior (pri-oritization policies which we refer to as history-based priority policies). While an increasing number of companies have benefited by using customer history to personalize their product or service offerings, to the best of our knowledge, the benefits of exploiting customer history in service systems to enhance customer service or revenue opportunities has not been demon-strated empirically. To perform our study we rely on a dataset that contains a 30-month panel of callers’ contact times, waiting times, and abandonment decisions, which we use to construct caller histories. To capture the impact of caller history on their current behavior and to predict how they would behave under various history-based priority policies, we formulate and estimate the parameters of mixed-logit models of caller abandonment and redialing behavior. We use our model estimates to predict how callers would behave under a variety of history-based prior-itization policies, and find that under certain policies this call center could substantially reduce average waiting times while increasing opportunities for agents to sell additional products.
better predict caller abandonment and redialing behavior. Better predictions of caller abandon-ment and redialing behavior could help managers deliver more accurate delay announceabandon-ments, improve call volume forecasting, and better prioritize callers. In this preliminary study we train various machine learning methods to predict caller abandonment and redialing behavior using a 16-month panel of data that includes a rich set of caller history explanatory variables. The methods that we use include k-nearest neighbor voting, decision trees, logistic regression, and various neural network configurations. We find that the neural network configurations provide the best prediction accuracy, but that other classifiers provide nearly comparable prediction accuracy. Furthermore, we find that caller history substantially improves the prediction accu-racy under each method, indicating that the more caller history data call centers can collect, the more accurate their predictions will be. We provide a more in-depth description of each chapter below:
1.1 Don’t Call Us, We’ll Call You: An Empirical Study of Caller Behavior Under a Callback Option
One of the recent innovations that call centers have adopted is callback technology, where callers are offered a callback to waitoffline for service rather than waitingonline for service on the phone. While the theoretical literature has been positive regarding the effects of offering callbacks (Armony and Maglaras 2004a, Armony and Maglaras 2004b, Ata and Peng 2018, Legros et al. 2016), to the best of our knowledge, no empirical study has been performed to understand how callers choose whether to accept a callback offer and to quantify the real-world benefits of offering callbacks. In this first chapter we fill these gaps by performing an empirical study of caller behavior under a callback option using data from a call center that recently implemented callback technology.
in this call center value the callback option. First, the callers’ callback channel preference is negative, indicating that, after controlling for the time they expect to wait for service in each channel, they generally prefer the traditional phone channel over the callback channel. However, we also find that their per unit online waiting cost is 3 to 6 times higher than their per unit offline waiting cost, which means that callers experience more discomfort per unit of time while waiting on the phone than while waiting for a callback.
Because the imputed caller preferences are independent of the call center’s current callback policy, we are able to use them to predict how callers would behave under various callback policies and thus capture the impact of each policy on call center performance measures. For example, we find that offering to hold the callers’ spot in line or to call back within a short (5-minute) window increases service quality (as measured by the average waiting cost callers incur while waiting for service) by reducing the average time that callers in the system wait in the traditional phone channel. We also find that offering to call back within a long (60-minute) window as a demand postponement strategy during temporary periods of congestion significantly increases service quality and system throughput. Hence, under the appropriate callback policies, managers may be able to improve caller perceptions of service quality and reduce lost calls.
1.2 Data-Driven Priority Policies to Enhance Customer Service and Rev-enue Opportunities Using Past Customer Interaction Information
We simplify the design of history-based priority policies by proposing a class of policies which we refer to as theCombination of Abandonment and Redialing Probabilities Policy Class
(CARP). Under CARP policies, callers who are waiting for service are prioritized based on a linear combination of their probability of abandoning within a given timeframe and their probability of redialing if they abandon within the timeframe. Special cases of this flexible class include prioritizing the most-patient (least-patient) caller and prioritizing the caller who is most-likely (least-likely) to redial.
We use the estimates of our model to predict how callers would behave and collect several performance measures of this call center under various CARP policies. We find that several CARP policies substantially reduce the callers’ average waiting relative to the call center’s current first-come, first-served policy. Specifically, average waiting time is lowest under the CARP policies that prioritize callers who are more patient. We next find that several CARP policies substantially increase opportunities for agents to sell additional products by increasing the percentage of callers entering the system who received service at least once. Specifically, sales opportunities are highest under CARP policies that prioritize callers who are less likely to redial after abandonment. Finally, we find that certain CARP policies decrease average waiting times and increase sales opportunities relative to the first-come, first-served policy. Hence, managers can exploit caller history to simultaneously improve service (by reducing average waiting times) and increase potential revenue (by increasing sales opportunities).
1.3 A Classification Approach for Predicting Caller Abandonment and Re-dialing Behavior
applications (delay announcements, volume forecasting, and prioritization). The purpose of this study is to provide managers with a framework for how to answer these questions and to apply this framework using call center data. In this chapter we perform a preliminary study where we assess the prediction accuracy of several machine learning methods that predict caller abandonment and redialing behavior based on caller history.
We frame the problem of predicting caller abandonment and redialing behavior as a binary probabilistic classification problem, where the task of each prediction method (referred to as a
classifier) is to generate the probability of each caller abandoning in a given period (or redialing after abandonment). Given our framework, we train several classifiers to generate abandonment and redialing predictions using a 16-month panel of data that includes a rich set of caller history explanatory variables. We assess the prediction accuracy of each classifier and find that various neural networks are the most accurate classifiers, but that logistic regression and decision trees are nearly as accurate, indicating that managers could use a variety of classifiers to accurately predict caller abandonment and redialing behavior. Furthermore, we find that the more history callers have with the call center, the better each classifier will predict. Hence, call centers who are interested in predicting caller abandonment and redialing behavior should collect as much caller history data as possible.
CHAPTER 2
DON’T CALL US, WE’LL CALL YOU: AN EMPIRICAL STUDY OF CALLER BEHAVIOR UNDER A CALLBACK OPTION
2.1 Introduction
Customer queueing is an inseparable part of service encounters, which may be detrimental to firms in two ways. First, customer perceptions of service quality may drop as they generally find waiting in queue unpleasant (Bitran et al. 2008, Suck and Holling 1997, Leclerc et al. 1995). Second, customers may lose patience and abandon the queue, which could reduce system throughput. A reduction in system throughput may lead to underutilization of resources and may result in lost revenue and/or churn. Thus, it is not surprising that firms use a variety of remedies to mitigate the negative effects of waiting.
A key to quantifying the effectiveness of these remedies is to have a clear definition of service quality. Historically, queuing literature has defined service quality as a function of how long customers wait, e.g., their average waiting time (Aksin et al., 2007). However, this definition concentrates only on how long customers wait, while ignoring how unpleasant it is to wait per unit of time. An alternative definition of service quality can be formed from the economic framework used in recent literature that treats waiting customers as utility-maximizing agents (Mandelbaum and Shimkin 2000, Hassin and Haviv 2003, Aksin et al. 2013). In this framework, customers incur a per period cost of waiting and accumulate “waiting disutility” until they receive service or abandon the system. We therefore define “service quality” as the average waiting disutility that customers accumulate while waiting for service, which is determined by the average waiting time of customers in the system and their cost of waiting per unit of time. Thus, firms may increase service quality by reducing customer waiting times or by making the waiting experience more pleasant per unit of time (reducing waiting cost).
service quality and/or system throughput. One of these innovations is providing delay an-nouncements where callers receive information regarding their future waiting time such as their position in line or a delay estimate. The idea behind providing delay announcements is that less patient callers will abandon earlier depending on the announcement message and thus not accumulate disutility by waiting in queue. However, a major shortcoming of providing delay announcements is that the call center has no control over when the callers will reenter the system. Consequently, some callers may reenter the system when the call center has insufficient service capacity, which may lead to longer waiting times and, hence, lower service quality.
The recent innovation of callback technology seeks to address the shortcoming of providing delay announcements, while retaining its benefits. This innovation has already been adopted by many call centers in industry as a recent survey of call center managers found that 22% of them have implemented callback technology (ContactBabel (2016)). Under callback technology callers are offered a callback, where they may wait “offline” until they are contacted by a call center agent, or remain in the “online” queue to wait for service. Callback technology frees callers from being tethered to a phone while waiting for service, which should decrease the discomfort that they incur while waiting. In addition, the call center determines the policy of when to initiate callbacks, which gives them control over when callers reenter the system. This allows the call center to initiate callbacks in periods where they have capacity to serve additional callers, with little or no impact on the waiting times of callers in the online queue. Finally, callback technology could reduce lost calls by providing callbacks to callers who otherwise would have abandoned without returning to the system. Moreover, callback technology could increase system throughput in call centers that offer callbacks when they have insufficient service capacity to later initiate callbacks when they have excess service capacity. This form of demand postponement has been shown to be advantageous in a variety of practical situations (Iyer et al. 2003, Biyalogorsky et al. 1999, Odlyzko 1999).
callbacks may substantially decrease the combined cost of caller waiting and abandonment, while Ata and Peng (2018) show that offering callbacks reduces online waiting times in a system where the arrival rate is a time-varying stochastic process. While the literature has been favorable towards callbacks, it has been exclusively analytical in nature. This leaves two gaps which, to the best of our knowledge, have yet to be addressed empirically. The first gap is in understanding how callers choose whether to accept a callback offer. Specifically, what preferences do callers consider when making their decisions, and how do these preferences affect the likelihood that they will accept the callback offer when it is presented to them? The previous literature recognizes this gap, and highlights the importance of understanding caller preferences regarding callbacks using real data. For example, Armony and Maglaras (2004a, pg. 276) write, “An interesting problem that will not be broached here is the estimation of customer preferences using observed data.” The second gap is in finding the impact of offering callbacks in a real world setting supported by data. While the analytical literature demonstrates the theoretical benefits of offering callbacks, the magnitude of these benefits in a real world setting is not clear. For example, managers may be interested in understanding to what extent their callback policy and its parameters (such as when to offer and when to initiate callbacks) affects service quality and system throughput. Quantifying these effects requires a model that can be used in conjunction with data to find the impact of different policies on caller behavior, which in turn would impact system performance.
accept a callback offer enter the “offline queue” and are later contacted by a call center agent, while callers who decline the offer may enter the “online queue” and wait for service. In our data we are able to observe whether callers received a callback offer, whether they accepted the callback offer, and whether they answered the callback when it arrived. In addition, we are able to observe the abandonment decisions of callers who entered the online queue.
Using our data, we first show several trends in caller behavior under the current callback policy. For example, we find that callers are more likely to accept callback offers under longer delay announcements and are more likely to accept callback offers during the evening. We also perform a reduced-form analysis to provide statistical support for these trends. While our reduced-form results inform us of how callers behave under the current policy, they cannot be used to capture the impact of a policy feature that does not exist in the data. For example, our reduced-form analysis cannot predict how callers would react if the call center did not offer callbacks or if the call center provided different types of delay announcements and/or callback offers such as offering to call callers back within a guaranteed timeframe. Hence, in order to predict how callers would behave under policies that differ from the call center’s current policy, we characterize the caller decision-making process and capture their preferences by formulating and estimating the parameters of a structural model of the caller decision-making process under a callback policy.
Web or physical storefronts (Ansari et al. 2008, Valentini et al. 2011, Kushwaha and Shankar 2013). Second, to capture the discomfort that callers experience while waiting for a callback to arrive, we impute their per unit cost of waiting offline.
Our estimates of the caller preferences reveal two interesting findings. First, the callers’ offline channel preference is negative, which means that after controlling for the waiting times they expect to experience in the online and offline queues, callers generally prefer the online channel. In other words, even if callers expect to experience the same level of discomfort by waiting in both queues, they still prefer the online queue. Second, we find that the callers’ per unit online waiting cost is 3 to 6 times higher than their per unit offline waiting cost, meaning that callers accumulate more waiting disutility per unit of time while waiting online. Hence, managers who are concerned with maximizing service quality by reducing callers’ waiting disutility should be willing to trade one unit of online waiting time for every 3 to 6 units of offline waiting time. Our estimates also demonstrate that the callers’ decision of whether to accept a callback offer is affected by a tradeoff between their channel preference and the disutility they expect to incur while waiting for service. Specifically, since callers generally prefer using the online channel, their probability of accepting a callback offer is low when their expected waiting times in both queues are low. However, as expected waiting times increase, callers become increasingly more likely to accept a callback offer because they anticipate experiencing far more discomfort by waiting in the online queue than by waiting for a callback.
the call center great flexibility in initiating callbacks whenever the online queue is uncongested. However, we also find that under high loads, offering the 60-minute window decreases service quality by inducing excessive offline waiting time as most callers must wait the full 60 minutes to receive their callback. Thus, managers who are interested in implementing callback technology to increase service quality should carefully consider which callback policy to implement. We also find that offering callbacks does not significantly impact throughput in a call center that operates at the scale of the call center that we study. However, we also simulate the operations of a call center at a smaller scale and find that, in this case, offering callbacks increases system throughput while also improving service quality. This result implies that offering callbacks in call centers that operate at a smaller scale may be advantageous.
While our initial set of counterfactual analyses demonstrate the effects of various callback policies in steady state, in actuality, call centers routinely experience extraordinary spikes in call volume due to unforeseen demand and reductions in service capacity due to scheduled activities such as agent training and team meetings. To determine how offering callbacks in this call center would affect performance under the realistic conditions that often occur in call centers, we conduct an additional transient counterfactual analysis in which we temporarily reduce staffing levels, thereby inducing a temporary increase in system congestion. In this case, we find that offering to call callers back within 60 minutes substantially increases service quality and system throughput by acting as a demand postponement strategy. Specifically, in our scenario, we find that the callers’ average waiting cost decreases by 57% and the percentage of calls lost due to abandonment and not answering arriving callbacks decreases by 50%. Hence, in call centers that encounter temporary spikes in system congestion, managers can implement callback technology to improve caller perceptions of service quality and increase throughput.
example, our negative estimate of the callers’ offline channel preference indicates that after controlling for expected waiting times in each queue, callers generally prefer the online channel. However, our estimates of the callers’ per unit waiting costs reveal that they experience 3 to 6 times more discomfort waiting for service online than they do offline. Third, our framework can be used as a tool for managers to compare the impact of different callback policies on call center performance before actually implementing them. This helps with identifying the magnitude of the benefits of offering callbacks and comparing it with the cost of implementing callback technology. We show that offering callbacks can improve service quality under a variety of loads, and also demonstrate through our transient counterfactual analysis that this call center could substantially improve its service quality and system throughput by implementing policies that offer callbacks during periods of insufficient service capacity to later initiate callbacks during periods of excess capacity.
2.2 Literature Review
Our work relates to two streams of literature. The first stream consists of studies of customer behavior in queueing settings. The second stream is research regarding callbacks. In this section we review both of these streams and articulate our contribution to each.
2.2.1 Customer Behavior in Queueing Settings
Since callers in our setting may receive a delay estimate upon arriving to the system, we also review the theoretical models of customer behavior in systems that provide delay announce-ments. Guo and Zipkin (2007) capture the impact on system performance of providing arriving callers various levels of information regarding the state of the system. Allon et al. (2011a) consider a firm that strategically chooses its delay announcement. They show that providing delay announcements improves firm profits and expected customer utility. Furthermore, Allon and Bassamboo (2011) show that rather than immediately providing delay announcements as customers arrive, waiting a short period to provide the announcement can lead to even greater firm profits and customer utility. Finally, Yu et al. (2018) study how delay announcements can be used to determine the extent to which different types of customers value the service. We also mention that recently several other customer behaviors in queues have been modeled, including returning after balking (Cui et al., 2018b), selecting queues based on service quality (Yang et al., 2018), and trading spots (cutting) in line (Allon and Hanany 2012, Yang et al. 2016).
The first structural estimation study of caller behavior is that of Aksin et al. (2013), who model callers waiting in queue as solving an optimal-stopping problem to determine when to abandon. Given their reward for service and their per unit waiting cost, callers decide when to stop waiting by abandoning the system. Aksin, et al. estimate the reward and cost parameters for four different service groups and find that the estimates of the caller parameters differ by group. Emadi and Swaminathan (2018) relax the rational expectations equilibirirum assumption and instead model callers in a Bayesian learning framework, where callers update their beliefs about the distribution of waiting times in the call center each time they call. They find that callers who have no experience with the call center are overly optimistic about their probability of receiving service in a given period. Ak¸sin et al. (2016) and Yu et al. (2016) extend the approach of Aksin et al. (2013) to call centers that provide delay announcements. In both studies callers use the information in their delay announcement as a signal of the current waiting times in the call center and change their abandonment behavior accordingly. Our contribution to this stream of research is the formulation of a structural model of caller behavior in the presence of a callback option.
2.2.2 Callback Research
Only a handful of studies have been conducted regarding call centers that offer callbacks. The two studies that are most pertinent to our work are those of Armony and Maglaras (2004a,b). In Armony and Maglaras (2004a) the authors model a call center as an M/M/N
arrival, which is based on the current state of the system. The authors show that providing real-time delay estimates magnifies the performance improvements from their first analysis.
Our structural model of caller behavior under a callback option differs from the models of Armony and Maglaras in two ways. First, callers in our model may abandon after joining the online queue, whereas callers in the models of Armony and Maglaras always remain in the online queue until receiving service. Second, not all callers in our model answer the callback when it arrives, whereas callers in the models of Armony and Maglaras always answer a callback when it arrives. Because we capture these additional ways in which callers may exit the system without receiving service, we find in our counterfactual analysis that under certain conditions offering callbacks has only minimal impact on system throughput. This differs from the results of Armony and Maglaras who find that system throughput increases under a wide variety of conditions.
to perform counterfactual analyses of callback policies that could potentially be implemented in the future, but for which no historical data is available.
To summarize, our contribution to the stream of callback research is two-fold. First, to the best of our knowledge we perform the only empirical study of caller behavior in a call center that offers callbacks. We use caller decisions to impute their callback preferences and use these preferences to quantify the magnitude of the impact of various callback policies. Second, we provide a framework for conducting counterfactual analyses of callback policies and explore how various callback policies would affect the service quality and system throughput of this call center.
2.3 Data Exploration
In this section we first describe the call center’s callback policy and the data collected under the policy. We then explore the data for trends regarding caller behavior under the callback policy. Lastly, we use these trends to motivate the formulation and estimation of a model of the caller decision-making process in the presence of a callback option.
2.3.1 Description of Callback Policy and Dataset
We obtained our data from the call center of a US-based commercial bank that had recently implemented callback technology. The call center offers customer service from 6:00 a.m. to 12:00 a.m., seven days a week. These services include deposit account inquiries, credit and debit card services, and online banking technical support. Our data includes a record of the 1,215,776 calls that were routed to queues staffed by agents between April 13, 2016 and July 31, 2016. There are approximately 500 agents in this call center who handle approximately 13,000 calls on the weekdays. Due to lower demand, the call center receives only 7,500 calls on Saturdays, and 4,500 calls on Sundays.
the nearest minute) based on current queue lengths and staffing levels.1 If the delay estimate is between 5 and 59 minutes, callers receive the following message: “Your estimated wait time is x minutes. You may continue to hold for the next available agent, or we will save your place in line and call you back. To continue to hold, press 1. To save your place and receive a callback, press 2.” If a caller accepts the callback offer, the routing software schedules an alarm for one minute before the caller’s delay estimate has elapsed. When the alarm triggers, the next available agent initiates the callback.2 If a caller’s delay estimate is less than 5 minutes or greater than 59 minutes, the caller receives no delay announcement and no callback offer.3 For callers who receive a callback offer, the delay announcement and callback offer are provided only once at the beginning of the call. Therefore, callers must immediately decide whether to accept the callback offer or wait for service in the online queue. If a caller who chooses to receive a callback does not answer their phone when the callback arrives, the agent who initiated the callback leaves the caller a voicemail.4
For every call in our dataset, we observe the caller’s estimated delay, whether the caller re-ceived a callback offer, whether the caller accepted a callback offer, whether the caller answered an arriving callback, and how long the caller waited until the callback arrived. For callers who joined the online queue, we observe each caller’s waiting time, and whether the caller aban-doned the queue before receiving service. To decrease the computational burden of estimating our model, we only analyze calls where the waiting time was 75 minutes or less; this restriction eliminates only .03% of the calls from the analysis.
Summary statistics of the data reveal that callers received a callback offer in 50.1% of all
1
The delay is estimated using the following formula: mean service time of a call · calls waiting for service (both in the online and offline queues) / number of available servers. In literature this is called the simple queue-length-based delay estimator; see Ibrahim and Whitt (2009) for details.
2Note that while the call center promises to hold the spot of callers who accept a callback offer, in actuality
under the alarm system the call center schedules the callback to occur around the time predicted by the delay announcements. This differs from callers who join the online queue where the actual waiting may differ significantly from the predicted delay announcement, depending on its accuracy. Thus, callers who accept a callback offer may be answered much earlier or later than they would have if they had joined the online queue.
3The call center chose not to offer callbacks if the delay estimate is less than 5 minutes because they did not
want to send a signal of congestion unless the system was highly congested. They chose not to offer a callback if the delay estimate was greater than 59 minutes to allow the system to decongest through caller abandonment.
4
Figure 2.1: Diagram of the Callback Offer Policy Generate Delay Estimate Whe n to redia l? Caller Arrives
5 – 59 Minutes
?
No
Route to Online Queue Give Delay Estimate, and Offer Callback Offer Accepted ? No Yes Yes Set Alarm for Delay Estimate Alarm Triggers Next Agent Initiates Callback Caller Answers ? No Agent Leaves Voicemail Caller Receives Service Caller Abandons ? Yes No Yes Abandon-ment
calls, that 37.5% of callers who received an offer accepted the offer, and that 93% of callers who accepted a callback offer answered it when it arrived. The average waiting time of callers who received and answered a callback was 15 minutes and 59 seconds, while the average waiting time of callers who were routed to the online queue (either because they rejected a callback offer or were not offered a callback) was 4 minutes and 48 seconds. Also, the abandonment rate of callers who were routed to the online queue was 22.1%. Finally, we examine the distribution of the number of times a caller contacted the call center within the data (contact frequency) and find that the mean contact frequency is 1.81 with a standard deviation of 1.90.
Lastly, we examine the accuracy of the call center’s delay announcements.5 In Figure 2.2
we show by delay announcement the average amount of time callers had to wait to receive service in the online and offline queues. Specifically, the red line plots the length of the delay announcement (on the horizontal axis) against how long on average the callers who rejected a callback offer and entered the online queue had to wait to receive service (on the vertical axis). The blue line plots the length of the delay announcement against the average amount of time before the call center initiated the callback. For reference, we have also included a dotted gray line with a slope of one to represent a scenario where the delay announcement is perfectly accurate. Because the call center schedules callbacks to occur around the time predicted by
5
the delay announcement, naturally the average difference between the delay announcement and when the callback arrives is short (does not exceed 2 minutes). For callers who enter the online queue, the difference is small if the delay announcement is between 5 and 15 minutes. However, for longer delay announcements, the actual average length of time callers must wait to receive service is substantially shorter than predicted, i.e., the delay announcement overestimates the actual waiting time. This means that for longer delay announcements, callers who accept a callback offer wait much longer to receive service than callers who reject the callback offer and join the online queue.
Figure 2.2: Mean Waiting Time to Receive Service in Online Queue and Mean Waiting Time for Arrival of Callback by Delay Announcement (in minutes)
2.3.2 Exploration of Caller Behavior under Callback Policy
We next explore our data for trends in caller behavior under the callback policy. We begin by showing two sources of variation in the callers’ probability of accepting a callback offer. We then explore whether any factors substantially affect the callers’ probability of answering a callback when it arrives.
Trend 1 - The callback option is not popular for short delay announcements but
Figure 2.2 above), most callers prefer to wait online. For example, when the delay announce-ment is 5 minutes, only 22% of callers accept the callback offer, demonstrating that shorter callbacks are not popular. However, the callback becomes increasingly popular under longer delay announcements, with the probability of callers accepting an offer approaching 50% under delay estimates longer than 30 minutes.
Figure 2.3: Percentage of Callers who Accepted the Callback Offer by Delay Announcement
Trend 2 - Callers are more likely to accept callback offers during the evening
than during the day. In Figure 2.4 we plot the callers’ probability of accepting a callback offer during the daytime hours (6:00 to 17:59) and the evening hours (18:00 to 0:00) under each delay announcement. We find that under every delay announcement callers are more likely to accept a callback offer during the evening than during the day.6 One potential reason for this trend is that callers who are working during the day hours are more reluctant to accept a callback offer if they think the arrival of the callback may disrupt a work-related activity.
6
Figure 2.4: Percentage of Callers who Accepted the Callback Offer by Delay Announcement during Day (6:00 - 17:59) and Evening (18:00 - 0:00)
While the figures above imply that the delay announcement and time of day affect the callers’ likelihood of accepting a callback offer, they do not provide statistical evidence. Hence, in A.1 we provide reduced-form statistical support for the above trends by estimating the parameters of a multinomial logit model of the callers’ initial decision upon receiving a callback offer.
Trend 3 - Most callers (93%) answer the callback when it arrives, and this
probability is consistent over several factors. We find that 93% of callers who accept a callback offer answer it when it arrives. Furthermore, we examine whether the factors we identified above, which affect callers’ probability of accepting a callback offer, also affect their probability of answering the callback. First, in Figure 2.5 we display the percentage of callers who answered an arriving callback by delay announcement. We find that the probability of answering the callback ranges only between 90.6% (delay announcement of 59 minutes) and 94.6% (delay announcement of 49 minutes).7 We also find that 92.8% (93.1%) of callers who accept a callback offer during the day (evening) answer it when it arrives. Hence, while delay announcements, and seasonality appear to have a large impact on the callers’ probability of
7To test whether the length of the delay announcement has a statistically significant effect on the callers’
accepting a callback offer, their impact on the callers’ probability of answering an arriving callback is not substantial.
Figure 2.5: Percentage of Callers Answering Arriving Callback by Delay Announcement
2.3.3 Motivation for Stuctural Model of Caller Behavior
Recall from the introduction of this paper that the primary reasons call centers adopt callback technology are to increase service quality and/or increase system throughput. With these objectives in mind, managers of this call center may have several questions pertaining to their callback policy. First, how well does their policy of offering callbacks when the delay estimate is between 5 and 59 minutes achieve these objectives? Does this current policy, indeed, achieve the goals of increasing service quality and system throughput in comparison to not offering callbacks? Furthermore, could this call center achieve better performance in these objectives under callback policies that differ from the current policy? For example, rather than only offering callbacks when the estimated delay is between 5 and 59 minutes, what if the call center always offered callbacks when the online channel is congested? What if the call center actually held the callers’ spot in line rather than scheduling an alarm to trigger the next available agent to initiate a callback? Finally, what if the call center offered different types of callback offers? For example, how would offering to call the callers back within a guaranteed window, rather than holding their spot in line, affect service quality and system throughput?
set of delay announcements and callback offers of the current policy. For example, we can use logistic regression to capture how various delay announcements and seasonality affect their probability of accepting a callback offer under the current policy, and we can use proportional hazards models to capture how these factors affect caller abandonment behavior under the current policy. However, all coefficients that are estimated in a reduced-form approach are endogenous to the policy under which the data was generated. Moreover, we cannot use these reduced-form models to capture the impact of a feature (or covariate) that does not exist in the data such as a new announcement policy. Consequently, answering the managers’ above questions requires us to predict how callers in this call center would behave under callback policies that differ from the current policy. To do this, we must characterize the caller decision-making process and capture their underlying preferences that determine their behavior under any given callback (delay announcement) policy. For example, when callers in this call center are determining whether to accept a callback offer, they may be considering how much they value the service they’ll receive, to what extent they prefer each service channel (online and offline), and the discomfort they expect to experience while waiting for service in each channel based on the expected waiting times in each channel under a given delay announcement. Now suppose that this call center changed its callback policy, thereby inducing a new set of delay announcements and callback offers with their corresponding expected waiting times. Then if we have captured the caller preferences, which are independent of the current policy, we can use these preferences to predict how callers would behave under the new policy and thus determine how that policy would affect service quality and system throughput.
2.4 Model and Estimation Strategy
2.4.1 Model Description
Preliminaries: Denote byN the population of customers of this bank who may contact the call center. Given that this bank has approximately 10 million callers, we setN to 10,000,000. We index callers who contacted the call center at least once within the span of the data byi∈ {1,· · ·, N1}and callers whom we did not observe in the dataset byi∈ {N1+ 1, N1+ 2,· · · , N2},
whereN1+N2 =N. Furthermore, we index the calls of callers who contacted the call center by
j∈ {1,· · · , Ji}, where Ji is the number of times the caller contacted the call center within the dataset. Finally, to account for differences in caller behavior and operating conditions based on the time of day, we divide a day intoM intervals and let qij ∈ {1,· · ·, M} be the index of the time-of-day interval of calleri’sjth contact. Given that we found that the callers’ probability of accepting a callback offer and their patience in the online queue differ during across the evening and daytime hours, we divide the day into two intervals (M = 2) for estimation: Day (6:00 a.m. -5:59 p.m.) and Evening (6:00 p.m. - 12:00 a.m.). For a justification of our choice of time-of-day intervals, A.2. Also note that in the remainder of this paper, we use the superscript nfor the online queue andf for the offline (callback) queue to index the primitives and parameters pertaining to each queue.
Caller Actions: We model caller behavior under a callback policy as a series of actions, denoted by d, made at discrete periods indexed by t, where t is the number of periods since arrival. The following are the three actions that callers may take:
• Abandon(d= 0): Callers may abandon the system.
• Wait Online(d= 1): Callers may decide to wait in the online queue.
• Accept Callback Offer(d= 2): Callers may accept a callback offer and wait offline for the callback to arrive.
receives no delay announcement and no callback offer. LetMbijt be the set of available actions
(the caller’s choice set) that callerimay take in periodtof callj, depending on whether calleri
received a callback offer. In Figure 2.6 we provide an illustration of howMbijtevolves as calleri
moves through the system. If upon entering the system the caller does not immediately receive service, the caller may receive a callback offer, depending on the call center’s policy. If caller
i does not receive a callback offer (bij = 0), then caller i is routed to the online queue, and chooses between abandoning and continuing to wait for t ≥0. Caller i will continue through this waiting process until receiving service or abandoning. If caller i receives a callback offer (bij = 1), calleriimmediately chooses among three actions in period 0. The caller may abandon the system (d= 0), join the online queue (d= 1), or accept the callback offer (d= 2). If caller
i joins the online queue and does not receive service in period 0, the caller chooses between abandoning and continuing to wait for t ≥1, and continues waiting until receiving service or abandoning.
Figure 2.6: Callers’ Choice Set at Different Periods, Depending on Whether a Callback is Offered
Call Center Messages: Upon entering the system for callj, callerimay receive a message, which we denote by Aij. For callers who receive a message, the first component contains information regarding the state of the online queue such as a delay announcement, and the second component contains information about the treatment of the caller in the offline queue. Examples of offline treatments include holding the caller’s spot in line or calling the caller back within a window. We let Aij belong to the set of messages L = {L1,L2}, where L1
corresponds to the possible ways the call center may present information regarding the online queue andL2corresponds to the possible ways the caller may be treated in the offline queue. In
the caller receives when the call center’s delay estimate iskminutes (between 5 and 59 minutes) and ∅is the “no-announcement” scenario, which the caller receives whenbij = 0.Furthermore, we let L2 ={{∅}, c(1)}, where c(1) corresponds to the call center’s current script of “we will
save your place in line and call you back”, and ∅ is the “no callback offer” scenario, which occurs whenbij = 0.
Caller Decision-Making Process: Similar to Aksin et al. (2013), Ak¸sin et al. (2016), Yu et al. (2016), and Emadi and Swaminathan (2018), we assume that callers act as utility-maximizing agents whose decisions depend on a vector of structural parameters, denoted by Θ. To account for heterogeneity among callers in their parameters, we assume that callers belong to one of s ∈ S latent segments, where callers are homogeneous within each segment but heterogeneous across segments with respect to their parameter values. Denote by πs the probability that a caller from the population of potential callers belongs to segments. Note that latent class models have been widely used in Marketing and empirical Operations Management to capture customer heterogeneity (Bartholomew 1987, Kamakura and Russell 1989, Emadi and Swaminathan 2018, Hathaway et al. 2019a).
The utility that callerifrom segmentsreceives in call jby choosing action din period tis given by
u(t, qij, Aij, d, ijt(d);s,Θ) =v(t, qij, Aij, d;s,Θ) +ijt(d),
whereijt(d) is the idiosyncratic shock of choosing actiondin periodtof callj. The idiosyncratic shocks may be attributed to the effects of random external events on the utilities of callers’ actions. We assume that the idiosyncratic shocks are type-1 extreme value distributed and are identically and independently distributed (iid) across different callers, calls, periods, and actions. The termv(t, qij, Aij, d;s,Θ) is the nominal utility of callerifrom segmentschoosing actiondin periodtof call j, which is independent of the idiosyncratic shocks.
We first explain the utilities for d = 0 and d = 1, which correspond to the actions that callers may take while waiting in the online queue. Then we explain the utility ford= 2, which is the utility of deciding to accept a callback offer upon arriving to the system.
compare the utilities of abandoning and continuing to wait. If the utility of abandoning is greater than the utility of waiting, callers “stop” by immediately abandoning the queue. Callers who choose to wait at the beginning of a period and do not receive service by the end of the period repeat the decision-making process at the beginning of the next period. This process continues until callers receive service or abandon. Consistent with the rational expectation equilibrium assumption in the extant literature (Aksin et al. 2013, Ak¸sin et al. 2016, Yu et al. 2016), we assume that callers who join the online queue know the probability of receiving service in period
t. We also assume that callers know they will receive service by no later than a terminal period, denoted byT. Furthermore, given their knowledge of the terminal period and the probabilities of receiving service in each period, callers also know their expected waiting time to receive service in the online queue at the beginning of each period.
We treat abandonment as an outside option and normalize the nominal utility to zero. Hence, if caller ichooses to abandon from the online queue the nominal utility is given by
v(t, qij, Aij, d= 0;s,Θ) = 0. (2.1)
If calleri chooses to wait in the online queue, the nominal utility is given by
v(t, qij, Aij, d= 1;s,Θ) =rqsij−csn,qij·E[Wn|Aij, qij, t], (2.2)
whererqij
s is the reward that callers in segmentsreceive during the time-of-day interval (qij) of callj,cn,qij