T
HER
OLE OFC
ONSUMERE
XPERIENCE IN THEM
ARKET FORC
OLLEGET
EXTBOOKSForrest Spence
A dissertation submitted to the faculty of the University of North Carolina at Chapel Hill in par-tial fulfillment of the requirements for the degree of Doctor of Philosophy in the Department of
Economics.
Chapel Hill 2015
Approved by:
Brian McManus
Gary Biglaiser
Donna Gilleskie
James Roberts
ABSTRACT
FORREST SPENCE: The Role of Consumer Experience in the Market for College Textbooks. (Under the direction of Brian McManus)
ACKNOWLEDGMENTS
TABLE OF CONTENTS
LIST OF TABLES . . . ix
LIST OF FIGURES . . . xi
1 Introduction . . . 1
2 Experience and the Value of Search . . . 3
2.1 Introduction . . . 3
2.2 Literature Review . . . 8
2.2.1 Constrained Choice Sets . . . 8
2.2.2 Learning . . . 11
2.3 Empirical Model . . . 12
2.3.1 Full Choice Set . . . 12
2.3.2 Limited Choice Set . . . 13
2.3.3 Search Decision . . . 14
2.3.4 Alternative-Specific Utility . . . 17
2.3.5 Reservation Utility Rule . . . 20
2.3.6 Likelihood Function . . . 22
2.4 Data . . . 24
2.4.1 Online Questionnaire Data . . . 24
2.5 Results . . . 28
2.5.2 Elasticities . . . 29
2.5.3 Counterfactuals and Model Fit . . . 30
2.6 Conclusion . . . 31
3 Price Beliefs and Experience . . . 37
3.1 Introduction . . . 37
3.2 Theoretical Motivation . . . 39
3.3 Data . . . 41
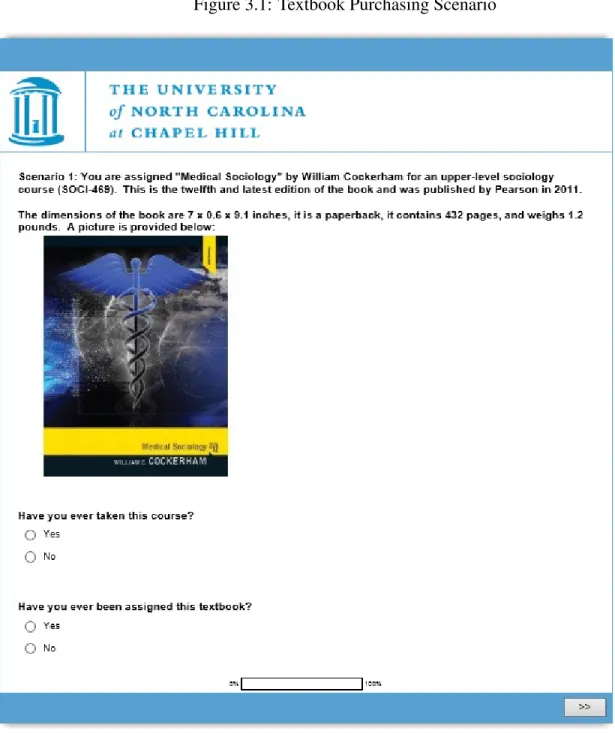
3.3.1 Textbook Purchasing Scenarios . . . 41
3.3.2 Online Questionnaire Data . . . 43
3.3.3 Online Retailer Data . . . 44
3.4 Results . . . 46
3.4.1 Expectations Results . . . 47
3.4.2 Distribution Results . . . 50
3.4.3 Price Beliefs by Major . . . 54
3.5 Learning vs. Selection . . . 55
3.6 Conclusion . . . 56
A Appendix to Chapter 2: Experience and the Value of Search . . . 67
A.1 Estimation . . . 67
A.1.1 Structural Search Model Estimation . . . 67
A.1.2 Consideration Set Approach Estimation . . . 74
A.2 Data . . . 84
A.2.1 Price Issues . . . 84
A.2.2 Online Questionnaire . . . 85
A Appendix to Chapter 3: Price Beliefs and Experience . . . 99
A.1.1 Online Questionnaire Data . . . 99
A.1.2 Textbook Purchasing Scenarios . . . 104
A.1.3 Survey Attrition and Estimation Sample . . . 106
A.2 Robustness Checks . . . 106
A.2.1 Omission Criteria . . . 107
A.2.2 Price Distribution . . . 110
LIST OF TABLES
2.1 Semesters Enrolled . . . 33
2.2 Student Demographics . . . 33
2.3 Students’ Beginning of Semester Textbook Decisions . . . 33
2.4 Students’ Retailer Choices . . . 33
2.5 Students’ Online Retailer Choices - Purchased or Rented . . . 34
2.6 Students’ Purchasing Behavior . . . 34
2.7 Students’ Stated Preferences . . . 34
2.8 Correlation in Students’ Stated Preferences . . . 34
2.9 Distribution of Payments for Textbooks . . . 35
2.10 Search Cost Estimates . . . 35
2.11 Utility Parameter Estimates . . . 35
2.12 Elasticity Estimates . . . 36
2.13 Eighth Semester Search Costs Counterfactual . . . 36
3.1 Respondent Characteristics . . . 59
3.2 Ratio of Amazon Prices to Bookstore Prices by Survey Period . . . 59
3.3 Mean Ratio Comparisons by Online Purchasing Experience, Used Books . . . 60
3.4 Mean Difference Comparisons by Online Purchasing Experience, Used Books . . . 60
3.5 Mean Ratio Comparisons by Online Purchasing Experience, New Books . . . 61
3.6 (Online Expectation / Bookstore Price) Regressed on Prev. Purchases . . . 62
3.7 (Online Expectation / Bookstore Price) Regressed on Experience . . . 63
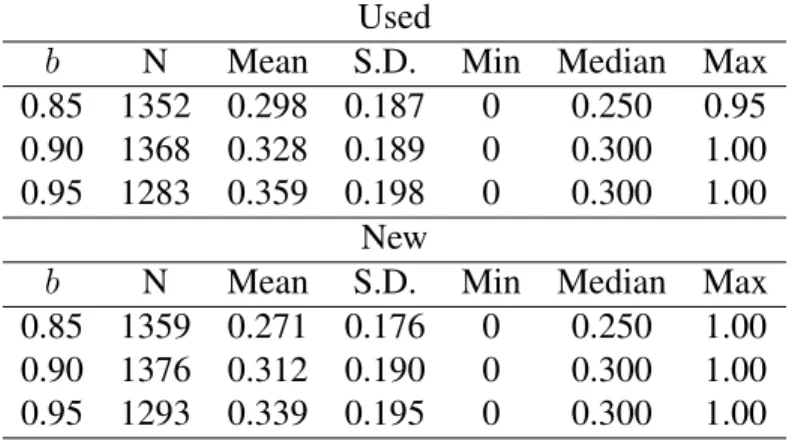
3.8 Reported Probability that Lowest Price< b⇤Expected Lowest Price . . . 63
3.10 Mean Comparison by Major . . . 65
3.11 Variance Comparison by Major (Log-Normal Assumption) . . . 66
3.12 Parameter Values by Change in Experience . . . 66
A.1 : Textbook Scenarios . . . 105
A.2 : Survey Attrition . . . 106
A.3 : Results Using Alternative Samples . . . 107
LIST OF FIGURES
3.1 Textbook Purchasing Scenario . . . 58
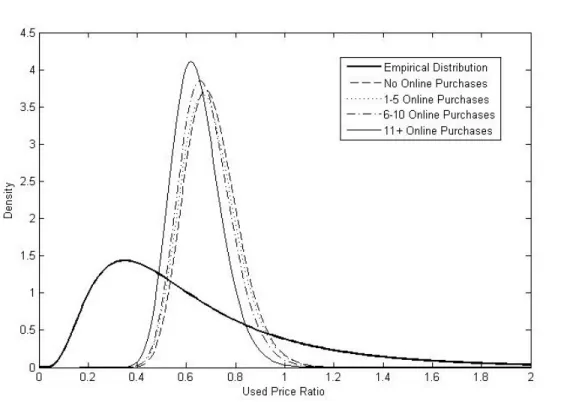
3.2 Used price pdf versus empirical dist. by level of experience . . . 61
3.3 New price pdf versus empirical dist. by level of experience Newalt is the minimum price for a new textbook from Amazon or Amazon Marketplace. . . 65
A.1 Histograms of Prices . . . 111
A.2 Kernel Density Estimate . . . 111
A.3 Kernel Density Estimate . . . 112
A.4 Daily Used Prices . . . 112
CHAPTER 1
INTRODUCTION
My dissertation work investigates the relationship between consumer experience in a market and decision-making. The research is unique because of the focus on learning about characteristics of a market as opposed to characteristics of a product itself. A significant amount of research has been done in the economics and marketing literatures to understand how individuals learn about their specific match with products and the implications this has for consumer decision-making (e.g., brand loyalty, strategic experimentation). However, little research has been done to under-stand how consumers learn about characteristics of a market that are common to all individuals. I use a novel dataset collected on consumers in the UNC textbook market to engage in three projects that comprise my dissertation research. The first paper relies on a structural approach to identify-ing changes in consumers’ value of online search and the resultidentify-ing welfare effects of experience. The second paper relies on more reduced form methods to identify the impact of experience on consumer behavior.
assignment) due to differences in their expected value of search in the online market. This result implies that there could be significant gains to providing information about market characteristics to consumers, particularly in markets where a large portion of the consumers are inexperienced (e.g., durable goods markets).
CHAPTER 2
EXPERIENCE AND THE VALUE OF SEARCH
2.1 Introduction
First-time consumers in a market face several challenges. Information on the existence of re-tailers, the products they offer, and the prices and characteristics of these products are all costly to obtain. As consumers repeatedly participate in a market and interact with other market partici-pants, they may acquire information about characteristics of the market that are common across all consumers. This paper investigates how consumers’ decisions to search across retailers change as they learn about these market-level characteristics.
A considerable amount of research in the economics and marketing literatures focuses on how individuals learn about match-specific characteristics (e.g., Erdem and Keane, 1996; Ackerberg, 2003), but little work has been done to understand how individuals learn about characteristics of a market as a whole. For instance, Crawford and Shum (2005) examine the importance of indi-viduals’ uncertainty about the efficacy of anti-ulcer medications (a match-specific characteristic). However, consumers may also face uncertainty about the availability of alternative medications, which retailers offer these medications, and the distribution of retailers’ prices (market-level char-acteristics).
understand if there are systematic differences in behavior across consumers that result from learn-ing about market-level characteristics. If these differences exist, policies that provide consumers with information about market-level characteristics can increase the rate of learning for inexperi-enced consumers in a market and improve consumer outcomes. This may be particularly effective in markets where a large proportion of the consumers have made relatively few purchases (e.g., durable goods or health care markets).
Experience appears to play a large role in consumer decision-making in the college textbook market. First-year students (generally first-time participants) tend to purchase their textbooks at university bookstores much more frequently than upper-year students (experienced participants). All participants in the market are generally provided with information about the campus bookstore, but may significantly differ in the amount of information they have about alternatives available outside of the campus bookstore. In particular, experienced consumers may have learned charac-teristics of the online market through repeated participation that changes their purchasing behavior. As consumers gain information about the online market, this affects their decision to engage in search across retailers. The incentives to engage in search are broadly defined as consumers’ value of search: consumers’ beliefs about the benefits of search minus the cost of engaging in search. This paper contributes to the literatures on consumer search and learning by evaluating the level of heterogeneity in consumers’ value of search, the degree to which this value varies by experience gained through repeated participation in a market, and the benefits consumers receive from increased information about characteristics of the online textbook market.
bookstores use software designed by Verba, Inc. to provide students with prices from the campus bookstore and numerous online retailers.
Differences in search behavior across experience levels may be the result of consumers learning about characteristics of the market. However, in order to identify the difference in search behavior that is attributable to differences in consumers’ expected value of search, it is necessary to rule out competing hypotheses for the observed difference in search and purchasing behavior. In the college textbook market, this difference could be due to a number of factors that are correlated with experience: who typically pays for the textbook, tastes for quality or retailers, previous online purchasing behavior, the types of courses taken, and beliefs about the value of textbooks among other things. I account for these factors by collecting detailed individual-level data on 6,000 con-sumers in the University of North Carolina – Chapel Hill (UNC) textbook market using online questionnaires.1 These data span four semesters and more than 700 independent course-sections.
Each observation contains the following information: whether and how the student obtained the assigned textbook, who paid or offered to pay for it, the student’s online search behavior and past purchasing behavior, the student’s price expectations, and his or her stated preferences regarding bookstore shopping and textbook conditions. In order to evaluate the benefits of search in the on-line market, I also scrape daily price data from 13 onon-line textbook retailers across two academic calendar years. These data allow me to approximate the empirical distribution of prices across on-line retailers during the time period considered. I supplement these data with information provided by the university registrar and university bookstore.
In the data I find that inexperienced consumers are significantly less likely to search online retailers than their more experienced counterparts, despite the potential for substantial savings. The price of a new and used textbook from Amazon.com was approximately 30% lower on average than the price of the same textbook from the campus bookstore. This difference in prices was nearly identical for textbooks assigned to first-year students and upper-year students, but first-year
1Each questionnaire was tailored to a specific course and textbook assignment. Instructors electronically distributed
students were 18% less likely to search online retailers. Reduced-form results suggest that search behavior is significantly different across experience levels even after controlling for differences in budgets, past experience purchasing online, reported tastes for online and bookstore shopping, and course characteristics.
In order to calculate the value of search across experience levels, I estimate a model of demand with limited information and costly search similar to Hortac¸su and Syverson (2004) and Hong and Shum (2006). In the model, consumers face a decision for one assigned textbook. They have full information about the price and characteristics of the campus bookstore alternatives (new, used, and rental), but face limited information about characteristics of textbooks sold in the online market. In particular, they face uncertainty over prices and their unobservable preference shocks for alternatives in the online market prior to making the search decision (although they know their joint distribution with certainty). Prices and preference shocks are revealed if the consumer pays a known search cost. This search cost is drawn from a distribution that depends on a number of observable factors including previous online shopping experience, experience in the textbook market, and reported confidence in the reliability of the online textbook market.
The majority of the learning literature identifies changes in information by assuming con-sumers’ beliefs follow a Bayesian updating process. In contrast, I identify learning in a reduced-form manner similar to Ackerberg (2001). I follow the the majority of other structural models of consumer search in assuming that consumers have rational expectations for prices (i.e., consumers beliefs match the empirical distribution of online prices prior to making the search decision). Con-sumer learning is captured by reduced form parameters that shift the distribution of search costs. One advantage of this technique is that it avoids the endogeneity of consumers’ decisions to acquire signals. The measure of experience used in this paper, semesters enrolled, is arguably exogenous to the decision to search an online retailer for an assigned textbook.2 This is contrasted by a measure
such as previous online purchases or searches, which are endogenously acquired based on beliefs
2More specifically, as long as consumers are not making decisions about being enrolled in college based on their
about the value of search.3
The search cost and utility parameters are estimated using a modification of a routine proposed by Koulayev (2012). This estimation procedure takes advantage of a reservation utility rule to form choice probabilities used in simulated maximum likelihood estimation. Estimation is facilitated by the observation of both the search and the purchase decision, including the decision to search online retailers and still purchase from the bookstore.4
Estimates suggest that experience has a significant effect on the decision to search online re-tailers, and thus a significant effect on consumers’ choice of retailer, even after controlling for consumer, textbook, and course differences. Median estimated search costs are $13 for inexpe-rienced consumers relative to $1 for their more expeinexpe-rienced counterparts. Counterfactual results suggest that eliminating the gap in search costs across experience levels leads to an average welfare gain of 5% of the price of a new textbook from the campus bookstore ($8 for a typical textbook assignment).
Overall, these results imply that policies aimed at improving information in the textbook market could significantly benefit consumer welfare by encouraging more search across retailers. Search not only reduces the expected price a consumer will pay, but also induces market participation for marginal consumers who were not willing to pay the pre-search price. In markets where a policy goal is to expand participation, such as alternative energy markets, informational policies that alleviate uncertainty about market-level characteristics are a fiscally responsible way of increasing market participation and total welfare.
These results also have broad implications for firm behavior. Firms may be able to segment
3The decision to acquire signals about the online market could be driven by selection (e.g. individuals who search
more are also individuals with lower priors about the distribution of online prices), leading to biased estimates of beliefs and the rate of learning.
4A common problem in the search literature is dealing with the issue of endogenous choice set formation. I do
markets by experience and take advantage of informational differences to engage in price dis-crimination. For example, pricing and revision behavior may vary substantially for introductory textbooks which are primarily aimed at inexperienced consumers, than advanced undergraduate textbooks, which are aimed at more experienced consumers). Finally, these results have important implications for antitrust policy in markets with infrequent purchases. When evaluating whether a proposed merger is anticompetitive, antitrust authorities typically consider entry by new firms to be a mitigating factor. My analysis suggests that inexperienced consumers are less likely to search across unfamiliar retailers, representing a barrier to entry for new firms. These informa-tion fricinforma-tions may therefore warrant stricter merger policy in markets where consumers tend to be inexperienced.
The following section provides an overview of research on demand estimation with limited information. Section 3 presents the empirical model. Section 4 presents the data and Section 5 provides parameter estimates and counterfactual results. Section 6 concludes.
2.2 Literature Review
This paper draws from two well-developed literatures in economics: demand estimation incor-porating constrained choice sets and learning. The following section describes the relationship between this paper and these literatures and elaborates on how this paper extends these literatures. 2.2.1 Constrained Choice Sets
consumer search models.5 Both of these approaches relax the assumption that consumers have
full information of all product alternatives and their characteristics, but differ substantially in their methodology. This paper develops and estimates a model that more closely resembles a structural model of consumer search, but the methodology for estimating a more reduced form consideration set model are discussed in the Appendix Section A.1.2.
Incorporating consideration sets into demand estimation began in marketing with Howard and Sheth (1969) and Newell and Simon (1972).6 The fundamental premise of the consideration set
literature is that when confronted with a purchasing decision, consumers follow a two-step proce-dure. First, they narrow a full set of alternatives into a smaller, consideration set, and second, they make an optimal choice from this narrower set of alternatives.
In economics, Sovinsky Goeree (2008) uses this methodology to estimate the extent to which the assumption of full information in demand estimation biases estimates of product markups and elasticities in the U.S. personal computer industry. Goeree also examines to what extent advertising affects consumers’ choice sets. This paper is similar to Goeree’s in that it explores a potential de-terminant of consumers’ information over product options: experience acquired through repeated participation in a market.
A common limitation of the consideration set approach is that it treats individuals’ choice sets as being exogenously determined; for example, in Goeree’s framework, unobservable preferences for a Dell Inspiron are independent of any unobservables affecting the inclusion of a Dell Inspiron in an individual’s choice set. This paper relaxes this limitation by allowing the unobservables in the consideration phase to be correlated with the unobservables in the product choice phase.
5This is somewhat of a simplification. A few papers in marketing and economics more closely resemble the
work done on estimating structural consumer search models than the majority of empirical work done incorporating consideration sets, but still reference the determination of choice sets as consideration set formation (e.g. Mehta et al. 2003; Pires 2013). In addition to these two approaches, there has been related work by Bruno and Vilcassim (2008) and Conlon and Mortimer (2012) focusing on how to incorporate limited product availability into demand estimation. Although these studies deal with constrained choice sets, they assume consumers have full information over allavailablealternatives.
Another way of relaxing the assumption of exogenous choice sets is to estimate a more struc-tural model that specifies a decision rule for how consumers choice sets are formed and estimates the parameters that underly the decision rule. This is the approach taken by the literature on the estimation of structural search models.
Despite the wealth of theoretical work done to explain how search costs or frictions affect equilibrium outcomes, no work had been done to structurally estimate consumers’ search costs until the early 2000’s.7 The lack of empirical work on the structural side was primarily due to
the difficulty of tracking and quantifying consumers’ search behavior. However, the increasing prevalence of internet shopping over the past decade has allowed for detailed data to be collected on consumers’ search behavior; with data on search behavior from various internet retailers and “shopbots”,8 a number of recent papers have been written examining consumer search and price
dispersion in online marketplaces (e.g., Hong and Shum, 2006).
The first work to empirically estimate a distribution of consumer search costs was Sorensen (2001). Sorensen uses store level pharmacy data on prices and quantities to estimate parameters of a search model, but because of the limitations of the data, he must make a number of relatively strong assumptions. Other studies have built upon this work to test different models of search (De los Santos et al. 2012b), extend the BLP framework to incorporate endogenous choice sets (Moraga-Gonz´alez et al. 2009), and estimate consumer search costs from observed price dispersion (Hortac¸su and Syverson 2004; Hong and Shum 2006).
These models have two primary advantages over incorporating constrained choice sets through the more reduced form consideration set approach: they explicitly account for the endogeneity of what individuals’ choose (or choose not) to gather information about and are able to incorporate uncertainty. For example, Koulayev (2012) uses data on online searching behavior for hotels to
7Early empirical work focused on documenting price dispersion in markets with homogeneous goods such as cars
and coal (Stigler 1961), gasoline (Marvel 1978), and a variety of other consumer goods (Pratt et al. 1979). Later empirical work focused on using reduced form methods to test results derived from theoretical search models (e.g. Carlson, 1980).
8Shopbots are websites devoted to tracking the lowest prices of specific goods from a number of online retailers
show how the assumption of full information leads to biased results in demand estimation for two reasons: i) because consumers have limited choice sets and ii) because these choice sets are endogenous. In other words, Koulayev shows that, even with knowledge of consumers’ choice sets, if the endogenous nature of those choice sets is not accounted for, demand estimation estimates are still biased because consumers choose to gather information (and expand their choice sets) in a non-random manner.
2.2.2 Learning
Previous work on consumer learning has focused on how individuals learn about the specific characteristics of a product (e.g., Erdem and Keane, 1996; Crawford and Shum, 2005). For exam-ple, Crawford and Shum (2005), estimate a dynamic model of demand for prescription anti-ulcer medication that incorporates individuals’ and doctors’ uncertainty about the efficacy of various drugs. They show that initially there is considerable uncertainty over the curative and symptomatic effects of these drugs, but that as individuals repeatedly consume medication, learning takes place relatively quickly.
The majority of studies in the consumer learning literature assume that individuals’ beliefs follow some form of Bayesian updating. A notable exception is Ackerberg (2001). Ackerberg examines the differential effects of advertising on first-time and repeat consumers by incorporating learning into a reduced form demand estimation framework. In his model, consumers learn about their preferences for yogurt indirectly through advertisement (informative effects) and directly through consumption; advertisement also may affect repeat consumers through prestige or image effects. This paper is similar to Ackerberg’s in the reduced form manner in which learning is accounted for, but I allow for experience to affect individuals’ choice sets in addition to the utility they receive from a product.
over the price distribution of funds. This paper differs with these in that it investigates differences in search behavior across purchasing decisions rather than differences in search behavior within purchasing decisions.
2.3 Empirical Model
As students acquire experience in the college textbook market, their observed online search and purchasing behavior both change. Specifically, higher levels of experience are associated with a higher likelihood of searching online retailers, making an online purchase, and also choosing the outside option. To explore the effect of acquired experience on student textbook purchasing behavior, I develop a discrete choice model in which students make an optimal search and pur-chasing decision, conditional on an instructor’s textbook assignment. Experience enters the model by affecting both the decision to search and the decision of which product alternative to choose, conditional on the search decision. This section first outlines individuals’ choice sets and how lim-ited information enters the model. Following this, I characterize an individual’s optimal search and purchasing decision. I then describe the form of the alternative-specific utility function. The sec-tion concludes with a discussion of the simulated maximum likelihood technique used to estimate the parameters of the utility function and search cost distribution.
2.3.1 Full Choice Set
For each course in which an individual is enrolled, individualiis modeled as facing a discrete choice fromat most7 alternatives that comprise the full choice set⌦F.9
9In practice, a used (or new) book may not be available from the bookstore at the time of purchase. Some assigned
⌦F = 8 > > > > > > > > > > > > > > > > > > > > > > < > > > > > > > > > > > > > > > > > > > > > > :
0 Do not purchase a textbook (outside option)
1 Purchase a new textbook from a bookstore
2 Purchase a used textbook from a bookstore
3 Rent a textbook from a bookstore
4 Purchase a new textbook from an online retailer
5 Purchase a used textbook from an online retailer
6 Rent a textbook from an online retailer
Alternatives are partitioned by type (new, used or rental10) and by retailer location (physical
bookstore or online retailer). The choice to not purchase a textbook (the outside option) also includes the choice to use a reserve copy at the library, borrow a copy from another student, or purchase or rent a previous edition of the assigned textbook.
2.3.2 Limited Choice Set
A key feature of the college textbook market is that consumers are initially steered towards a common set of purchasing options: those offered at the university bookstore. Because of this, I model consumers as having full information about the bookstore options prior to the purchasing decision.11 With this information in hand, consumers then make a decision to obtain information
about alternatives available from online retailers,⌦O. If individualidecides not to search online
retailers for information about the assigned textbook, her choice set is constrained to⌦L, otherwise
10Students are able to rent books for the duration of a semester at a lower price than the price to purchase a used
book. If the book is not returned, the student is generally forced to pay the difference between the new and rental price. Also, the decision to rent is not separated into the decision to rent a new or used option primarily because the majority of online retailers do not make the quality of the rental option explicit.
11It is assumed that each student’s choice set contains the bookstore options for a number of reasons: students are
she chooses the alternative with the maximal utility in the full choice set,⌦F:12 ⌦F 8 > > > > > > > > > > > > > > > > > > > > > > < > > > > > > > > > > > > > > > > > > > > > > : ⌦L 8 > > > > > > > > > > < > > > > > > > > > > :
0 Do not purchase a textbook (outside option)
1 Purchase a new textbook from a bookstore
2 Purchase a used textbook from a bookstore
3 Rent a textbook from a bookstore
⌦O 8 > > > > > > < > > > > > > :
4 Purchase a new textbook from an online retailer
5 Purchase a used textbook from an online retailer
6 Rent a textbook from an online retailer
2.3.3 Search Decision
Consumers choose to search online retailers if the expected benefit of search outweighs an in-dividual specific search cost. Let uij denote the alternative-specific utility individual i receives
from choice j. Further, let UiL⇤ = max{uij : j 2 ⌦L}, UiO⇤ = max{uij : j 2 ⌦O}, and
UiF⇤ = max{uij : j 2 ⌦F} denote individual i’s utility from the alternative yielding the high-est utility in the limited, online, and full choice sets respectively. If individuals are allowed to freely revisit the alternatives in the limited choice set (i.e. search with recall), the ex-post benefit of search to individualiis then,
UiF⇤ UiL⇤ (2.1)
12The assumption that some individuals do not have the online options in their choice set does not necessarily
or equivalently,
UiO⇤ UiL⇤ if UiO⇤ > UiL⇤ (2.2)
0 if UiO⇤ < UiL⇤ (2.3)
Equation (2.1) states that the ex-post benefit of search is simply the maximal utility from all alternatives less the maximal utility from only the bookstore alternatives and the outside option (i.e. the limited choice set). Before considering the ex-ante benefit of search, it is helpful to rewrite Equation (2.1) into the two cases given by Equations (2.2) and (2.3). If the maximal utility from the online alternatives is greater than the maximal utility from the bookstore alternatives and the outside option, then the ex-post benefit of search is simply the difference between the two. In the other case where the maximal utility from the online alternatives is less than the alternatives in the limited choice set, then the ex-post benefit of search is zero.
The maximal utility of the limited choice set, UiL⇤, is assumed to be known to the individual
before search, but the individual faces uncertainty about characteristics of the online alternatives that search reveals. In particular, individuals face uncertainty about the prices and additional un-observable preference shocks of the online alternatives that is realized only after search.
The expected benefit of search is,
Z 1
UiL⇤
(UiO⇤ (po,✏o) UiL⇤ )dG(UiO⇤ ) (2.4)
G is the cumulative distribution function of individuali’s beliefs about the maximal utility from the online alternatives.UiO⇤ is explicitly written as a function ofpoand✏o– vectors of the prices of
the online alternatives and unobservable (to the individual and econometrician) preference shocks – the only random components in the above equation. The lower bound on the expected benefit from search isU⇤
choice set.13
Consumers’ search costs are assumed to be known at the time of search, which yields the following search decision rule, where an individual searches if the expected benefit outweighs an individual specific search cost,ci:
Z 1
U⇤ iL
(UiO⇤ UiL⇤ )dG(UiO⇤ )> ci (2.6)
Following the search decision, an individual chooses the alternative yielding the highest utility, conditional on that individual’s choice set.
In order to estimate the model, assumptions need to be made on an individual’s search costs,ci
and beliefs about the distribution ofU⇤
iO. Search costs,ci, are parametrized as being drawn from a
population lognormal distribution:
ci ⇠lnN( 0Wi,✓2) (2.7)
Explicitly,Wi contains,
· Semesters and semesters squared terms.
· An indicator equal to one if individualihas an older sibling who attended college previously.
· An indicator equal to one if individualihas madeanyonline purchase before.
· Stated preferences for confidence in online shopping.
Each covariate in Wi except for the semester indicators are assumed to be exogenous search
cost shifters and are excluded from the specification ofuij. For example, an individual who has
previously made an online purchase may be more familiar with online shopping or may have a Paypal.com or Amazon.com account, reducing the search costs necessary to purchasing a textbook
13Equation (2.4) can be rewritten as Z
po Z
✏o
(UiO⇤ (po,✏o) UiL⇤)1[UiO⇤ > UiL⇤ ]dH(✏o)dF(po) (2.5)
online. However, this is assumed to not affect how much an individual values a textbook from the internet versus a bookstore conditional on the search decision or the valuation of a textbook at the extensive margin. In other words, having previously made an online purchase is assumed to only affect the process of an individual searching.
Recall that individuals face uncertainty over the prices of the online alternatives (new, used, and rental) and also other unobservable factors realized after search. Unobservable demand shocks are assumed to be distributed Type 1 Extreme Value14 and observed empirical price distributions
are used to reflect consumers’ beliefs about the price distribution of the online alternatives (i.e. rational expectations).15
2.3.4 Alternative-Specific Utility Studentireceives utility from choicej,
uij = j0Xij +↵ipij +✏ij (2.8)
The utility from choice 0 (not purchasing a textbook) is normalized toui0 = ✏i0. For certain
covariates inXij, the value of only varies by the outside option.16
In order to control for differences across the characteristics specific to each alternative, Xij
contains the following:
· Indicators for new, used, or rental alternatives.
14Further analysis could relax this assumption by using a Nested Logit or Generalized Extreme Value Distribution
similar to that in Bresnahan et al. (1997)
15If consumers have upward biased beliefs about the distribution of prices from online textbook retailers, this will
bias estimated search costs upward and price sensitivities towards zero (upwards biased price beliefs, high search costs, and low price sensitivities could all lead to lower levels of search). Matsumoto and Spence (2013) have found evidence that inexperienced consumers’ price expectations are significantly higher than their more experienced counterparts us-ing a novel dataset on consumers’ subjective beliefs about the distribution of prices of textbooks from online retailers. Thus, a limitation of this paper is that any differences in beliefs across experience levels will cause search costs to be biased upwards for inexperienced consumers. Although this is a limitation, it does not diminish the counterfactuals of this paper. Instead, it simply does not allow differences in search costs across experience level to be differentiated from differences in price beliefs.
16In other words, for certain covariates inX
ij, j = k 8j, k2{1,2, ...6}. These restrictions are discussed in the
· Indicators for bookstore and online alternatives.
· A vector of stated preferences for quality,Z1i, interacted with the new indicator.17
· A vector of stated preferences for bookstore shopping, Z2i, interacted with the bookstore
indicator.
Xij also contains the following individual, textbook, and course characteristics:
Individual Characteristics:
· Semesters and semesters squared terms.18
· Indicators for on-campus students, in-state students, and if the course is in the student’s major field.
Textbook Characteristics:
· Indicators for guaranteed buyback textbooks,19required books (as opposed to recommended),
books with bundled materials, hardcover books, and UNC-custom editions or coursepacks.
Course Characteristics:
· Total enrollment in the course.
· Indicators for upper level courses, courses in the spring, and if the instructor informed the
individual of purchasing options before the semester began.
The covariates above are included to account for individual, course, and textbook characteris-tics that could affect purchasing and search behavior and may be correlated with market experience. For example, upper-level students may be observed to search online retailers more because the in-formal secondary market (e.g., student to student) is different for a typical upper-level course than a typical introductory course. This necessitates the inclusion of controls for upper-level and large enrollment courses.
17A detailed description of how these stated preferences were collected and measured can be found in Section 2.4.1. 18In future versions of this paper, I plan to experiment with various functional forms of semesters enrolled. 19The campus bookstore offers consumers a guarantee that they will buy their textbook at a specified price for a
Experience enters the utility function through the semesters and semesters squared term in
Xij.20 These terms reflect changes in how students value textbooks as they accrue experience.21
For example, a first-semester student may have different beliefs before the semester begins about how much a textbook will be used during a semester. As the student progresses through college, she may refine that expectation, leading her to change her valuation of an assigned textbook. This change could also reflect differences in the value of the outside option as a student progresses through school. Consumers may acquire information about reserve copies at the library or the ability to purchase previous editions as they gain experience. If these options are preferable to purchasing/renting a current edition of the assigned textbook, this will be reflected in a change in the value of a textbook at the extensive margin.22
An additional covariate in Xij measures the utility individuals receive from the continuation
value of the textbook at the end of the semester.23 This continuation value is given by the term
max{rij,¯rij}. The expected resale value of choice j to student i at the end of the semester is given byrij (where the expectation is taken at the beginning of the semester), andrij¯ is student
i’s expected reservation resale price (the lowest price a student expects she would be willing to
sell her textbook for at the end of the semester).24 Ifr
ij >r¯ij the expected resale price is greater
than the expected reservation price and the individual intends to sell the book at the end of the
20The parameters associated with semesters enrolled in the utility function are separately identified from the
semesters enrolled terms in the search cost distribution according to the following logic. Unconditional differences in the decision to search online across semesters enrolled identify the terms in the search cost distribution. The terms in the utility function are identified through variation in the decision to purchase a textbook at the extensive margin across semestersconditionalon an individual searching. For this reason, the observation of both the purchasing decision and the search decision is critical for identification.
21Semesters are measured as the number of semesters a student has attended collegebeforethe semester in which
the choice is made (i.e. the minimum value ofsemi= 0).
22It should be noted that this reduced form measure of learning is not the focus of the paper. Experience enters the
utility function due to the observed trend that upper-level students search online retailers moreandchoose the outside option more frequently than first-year students. This can only be rationalized if the outside option is becoming more attractive with experience.
23This covariate is excluded from the rental alternative as well as the outside option. 24Bothr
ij andr¯ij are elicited through questions in the online questionnaire (i.e., both are data rather than latent
semester. If r¯ij > rij, the student expects that the value of the textbook to be greater than the
resale price and plans to keep the textbook. Although themaxoperator does not fully characterize a individual’s optimization problem with respect to the continuation value of the textbook at the end of the semester – it only depends on the first moments of these random variables – it provides a intuitively reasonable and tractable approximation.
Other terms in the utility function include the log price of choice j, given by pij. The price
sensitivity parameter varies by four deterministic cases and are given by↵i. Explicitly,
↵i =↵0+↵1S1i+↵2S2i+↵3S3i (2.9)
The model allows for four deterministic price sensitivities: i) the student purchases the textbook with his or her own money, ii) the student receives a fixed payment from another person in order to purchase the textbook, iii) the student receives a varying payment from another person, and iv) the student pays for the textbook with funds from a scholarship. An example of the second case is another person or scholarship providing an individual with $X for textbooks allowing the individual to keep any potentially remaining money. The third case corresponds to the case of another person completely covering the cost of textbooks regardless of the price. In the specification given by Equation (2.9),S1i is an indicator equal to 1 if the individual received a varying payment;S2iis an
indicator equal to 1 if the individual received a varying payment; S3i is an indicator equal to 1 if
the individual received scholarship money; the omitted category is paying out-of-pocket. 2.3.5 Reservation Utility Rule
In order to write out the likelihoods of the observed product and search decisions, it is first helpful to characterize the decision rule in Equation (2.6) in terms of reservation utility in a manner proposed by Koulayev (2012). An individual will choose to search if the alternatives in the limited choice set provide utility below a threshold value,u¯i, at which the individual is indifferent between
the decision to search and not to search. Explicitly, an individual will search if,
where the reservation utility,u¯i, is the utility level where the expected benefit from search is
equiv-alent to the cost of search:25
Z 1
¯
ui
(UiO⇤ ui¯)dG(UiO⇤ ) = ci (2.11)
The LHS of Equation (2.11) can be approximated using simulation methods for any value of
¯
ui. In practice this is done using the following algorithm,
1. Begin with a guess ofui¯.
2. TakeN S1 draws from a standard uniform distribution26:µ⇠U(0,1). Each individual draw
will be denoted with a superscripts(e.g.,µsis a scalar draw from standard uniform).
3. Take N S2 draws from the empirical distribution of prices for each online alternative (new,
used, rental). Each draw from the price distributions is denoted as the vectorps O.
4. Calculate the inverse CDF ofU⇤
iOfor eachµs.
G 1(µs) =
N S2 X
k=1 "
ln P ln(µs)
j2⌦Oexp(vij(p k ij))
!#
(2.12)
wherevij =uij ✏ij. For eachs, this is essentially taking a draw fromUiO⇤ . Note thatvij is
a function of the online prices,pO, for the online alternatives.
5. If the draw fromU⇤
iO is greater thanu¯i, then assignys as the expected benefit of search for
one simulation draw, equal to the draw forU⇤
iO minus the value ofui¯, otherwiseys = 0:
ys =
8 > > < > > :
G 1(µs) ui¯ ifµs> G( ¯ui)
0 ifµsG( ¯ui⇤)
25The functionGis used for notational simplicity. In practice, integrating over individuals’ beliefs about the benefit
of search is a six dimensional integral over the three online epsilon shocks and three different online prices (new, used, and rental). The type-1 extreme value assumption allows for the three dimensional integral over the epsilons to be reduced to a one dimensional integral.
26Draws from standard uniform distributions used for simulation are taken from Halton sequences. Each sequence
6. The simulated value ofR⇤
¯
ui 1(U⇤
iO u¯i)dG(UiO⇤ )is given by,
1
N S1
N S1 X
s=1
ys (2.13)
Using this technique ui¯ can be solved for by finding the root ofRu1¯
i (U ⇤
iO ui¯)dG(UiO⇤ ) ci
for any value ofci. Choice probabilities are formed based on these individual specific reservation
utilities.
2.3.6 Likelihood Function
The individual likelihoods can be separated into the three following cases:
• The likelihood of an individual not searching and choosing the outside option or a bookstore
option,j 2{0,1,2,3}, is
P rijN S =P r(uij > uik,8k 6=j 2⌦L)·P r(UiL⇤ >ui¯) (2.14)
• The likelihood of an individual searching and choosing the outside option or a bookstore option,j 2{0,1,2,3}is
P rijS =P r(uij > uik,8k =6 j 2⌦L)·P r(UiL⇤ <ui¯)·P r(UiO⇤ < UiL⇤ |UiL⇤ <ui¯) (2.15)
• The likelihood of an individual searching and choosing an online or rental option, j 2
{4,5,6}is
P rS
ij =P r(uij > uik,8k =6 j 2⌦O)·P r(UiL⇤ <u¯i)·P r(UiO⇤ > UiL⇤|UiL⇤ <u¯i) (2.16)
where⌦Ois the choice set composed of only the online and rental options.
the limited choice set times the probability that the maximal utility from the limited choice set is greater than the individual’s reservation utility.
Equations (2.15) and (2.16) include an additional term because the product choice conditional on choosing to search provides information about bothU⇤
iLandUiO⇤ . The second term in equation
(2.15) indicates that individual searched because the maximal element in U⇤
iL was less than ui¯.
Because the individual chose an element from⌦L, it must be the case that UiL⇤ > UiO⇤ (the third
term in Equation (2.15)). The first term is simply the probability the individual chose alternativej
in the limited choice set.
The first terms of Equations (2.14) - (2.16) have a closed form expression. The second terms of these equations have a closed form representation conditional on a value ofui¯. The third term
of Equations (2.15) and (2.16) must be approximated using simulation methods.
Using these choice probabilities, the parameters of the alternative specific utility function and search cost distribution, collectively ⇥, can be estimated using simulated maximum likelihood
estimation. The unconditional individual likelihood function is given by,27
Li(⇥) =
Z
c
Z
po
Y
j
(PijS)dSij(PN S
ij )dN Sij dH(c)dK(po) (2.17)
for j 2 {0, ...,6}. The distribution of search costs is given by the functionH. The multivariate
distribution of online prices is given by the functionK. Individuals are assumed to know the
empir-ical distribution of online prices (i.e., rational expectations). The indicator function,dSij(dN Sij),
is equal to one if the individual chooses to search (not search) and chooses alternativej. This
in-dividual likelihood can be approximated using simulation techniques. Each observation is treated as independent; the full likelihood function used in estimation is given by,
L(⇥) =Y
i
Li(⇥) (2.18)
27The probability of not searching and choosing an online alternative,PN S
The Appendix Section A.1.1 provides more detailed information on the form of the above choice probabilities, how the probabilities without closed forms are approximated, and the form of the likelihood function.
2.4 Data
2.4.1 Online Questionnaire Data
Micro-data were collected through online questionnaires sent from instructors to their students.28
At the beginning of the fall and spring semesters for the 2011-2012 and 2012-2013 academic cal-endar years, instructors were sent an email containing survey directions and a link to an online survey. This email was then forwarded by the instructor to the students in his or her class. Each survey was individualized to the specific course; students were asked if and how they obtained the assigned textbook for the course, price information, which retailers they considered, details of their online search behavior, their price expectations of retailers not considered, past purchasing behav-ior, characteristics of the textbook they (may have) purchased, and questions gauging preferences for bookstore shopping and quality among other items.29
For the 2011-2012 and 2012-2013 academic calendar year, instructors of more than 700 course-sections forwarded an email containing an online survey link to their students.30 This resulted in
8,279 students responding. Of the students who began the survey, 7,191 completed the survey: an 87% completion rate.31
The summary statistics that follow exclude non-undergraduate students (248 excluded), re-spondents whose textbooks were available for free through the UNC student stores because of scholarships offered through the university (315 excluded), or did not have information for other
28UNC IRB study #11-1177. The online surveys are conducted through the Odum Institute. 29The Appendix Section A.2.2 contains a detailed description of the online questionnaire.
30These surveys were distributed to instructors following the last day students were able to return textbooks to the
campus bookstore for a full refund; this is roughly two weeks after the start of the semester. In an effort to bolster student response rates, respondents were entered in a drawing to win cash prizes.
311,892 students responded in the fall of 2011, 2,493 students responded in the spring of 2012, 2,189 students
key variables (595 excluded).32 These individuals are also excluded in estimation, leaving a sample
of 6,033 students.
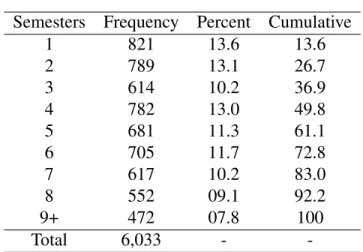
Table 2.1 summarizes the distribution of respondents’ number of semesters enrolled. The num-ber given in Table 2.1 includes the current semester of the respondent, as well as summer sessions and semesters enrolled at any other university.
Table 2.2 summarizes the demographics of the respondents. This includes the percentage of students who were classified by the university as in-state students, live on campus, male, and were the first child in their immediate family to attend college. This table also includes the age of respondents and the percentage of students who reported that the course in which they were surveyed was in their major field. The total number of responses varies because response to these questions was optional.
Table 2.3 summarizes respondents’ textbook purchasing decisions; students are separated into two categories: freshmen (defined as enrolled in two or fewer semesters) and upperclassmen. For freshmen, 84% of students decided to purchase the assigned textbook, 5.4% chose to rent the assigned textbook, 5.8% borrowed the textbook from another student, and a small percentage chose to use a copy from the library or to not use the textbook entirely. Upperclassmen tended to purchase the book less frequently, rent more frequently, and chose the other options at roughly the same rate. Table 2.4 summarizes students’ choice of retailers if they purchased the assigned textbook. Ob-servations for courses that assigned textbooks which were not available at online retailers (UNC Coursepacks or Custom Editions) are excluded from this table. Conditional on being able to pur-chase the assigned textbook through an online retailer, the data show that upperclassmen were more likely to choose to purchase the assigned textbook through an online retailer than freshmen. Perhaps surprisingly, freshmen were more likely to purchase the assigned textbook from another student than upperclassmen. These purchases occurred almost exclusively in the spring semester and appear to be a result of the type of course the freshmen were taking (the supply of textbooks
32This last number is higher than it will be in the final version of the paper. Individuals who choose an “other” option
for introductory courses through other students is larger than for more specialized, core courses). Table 2.5 summarizes students choice of online retailer, conditional on purchasing or renting online. The majority of students purchased their textbook through Amazon.com, accounting for more than seven times the purchases of the next leading online retailer, Half.com. Roughly half of all rentals were done through Chegg.com (although this still represents a small proportion of the total number of online purchases and rentals). HTML source codes were collected for eight additional online retailers and two publishing websites, which comprised an additional 8.6% of sales and rentals. Price data were not gathered for 6.8% of the observed sales and rentals (e.g. alibris.com, bookbyte.com).
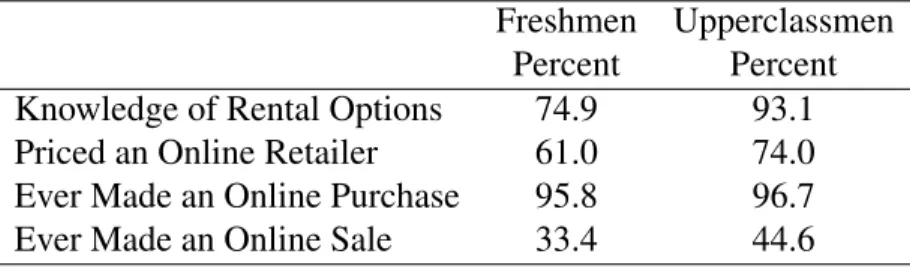
Table 2.6 contains information on whether students knew about the possibility of renting text-books at the beginning of the semester and whether they priced the textbook at another physical bookstore, or an online retailer. Evidence that students learn about the availability of product op-tions is seen in students’ knowledge of rental opop-tions at the beginning of the semester; the vast majority of upperclassmen surveyed were knowledgeable of rental options when making their textbook decision, while a sizable fraction of freshmen were not.33
This table also includes the proportion of students who had ever purchasedanythingonline or ever made an online sale. Nearly all students, freshmen and upperclassmen, had made an online purchase before, but less than half had ever made an online sale before.
Table 2.7 summarizes students’ stated preferences for aspects important to the decision to buy a new or used textbook and to deciding whether to buy from a physical bookstore or an online retailer.34
These stated preferences include responses to the following questions important to the book-store/online retailer decision:
33In the model, all individuals have full information about the availability of the rental options.
34Respondents used a sliding scale to report their preferences, with response values ranging from 0 to 10. For
• How important is seeing the condition of a textbook before purchasing it?
• How important is receiving a textbook on the day you purchase it?
• How confident are you that you will be satisfied with an online purchase?
Questions gauging the importance of buying a new rather than a used textbook include the following:
• How important is purchasing a new rather than a used textbook?
• How important is purchasing a textbook without highlighting, dog-ears, or notes already in
it?
Students reported placing low importance on purchasing a new rather than a used textbook. Slightly more importance was placed on purchasing a textbook without notes or highlighting in it, seeing the textbook before purchasing it, and receiving the textbook on the day of purchase. The majority of students reported being confident in being satisfied with an online purchase.
Table 2.8 reports the correlation between stated preferences.35 Correlations between stated
preferences are of the expected signs. Preferences for purchasing a new rather than a used text-book are positively correlated with preferences for purchasing a texttext-book with no notes or high-lighting. These preferences are also correlated with seeing the book before purchasing it, but to a lesser degree. Preferences important for the bookstore/online retailer decision, the importance of receiving the textbook on the same day and seeing the textbook before purchasing it are also highly correlated.
As expected, confidence in online shopping is negatively correlated with preferences for seeing the textbook and receiving the textbook on the same day. Interestingly, freshmen seem to have stronger preferences for aspects of textbook purchasing that would lead to more new rather than used purchases and more bookstore than online purchases; this lends support to the need to include these measures when examining the effects of experience on purchasing behavior.
Table 2.9 summarizes who paid for the assigned textbook. Less than half of all students paid for the assigned textbook out of pocket, with slightly more upperclassmen paying for the textbook than freshmen. Of the students who received money from another person to pay for the textbook, the majority received a payment that varied with the cost of the textbook (i.e. parents paid for the entire cost of textbooks, regardless of cost). A much smaller proportion received a fixed payment from another person to cover the cost of the textbook.
2.5 Results
This section first presents parameter estimates for the alternative specific utility function and search cost distribution. This is followed by a discussion of estimated elasticities. I conclude this section with a discussion of model fit and counterfactual results.
2.5.1 Parameter Estimates
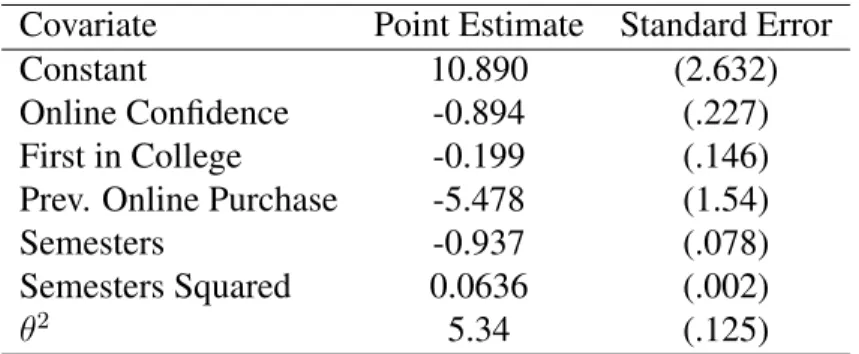
Recall that search costs are distributed log-normal according to the following,
ci ⇠lnN( 0Wi,✓2) (2.19)
Table 2.10 presents estimates for the parameters that determine the mean and variance of the search cost distribution. Consumers with more tenure in the market have significantly lower search costs, although the marginal reduction in search costs from an additional semester is decreasing. The parameters given below imply that the median search cost for a first year student is $13.33 and $1.34 for an upper-level student.
Consumers who have made a previous online purchase or have higher levels of stated confi-dence in online shopping also have significantly lower search costs. Consumers who have not had older siblings in college before them have search costs that are not statistically different than those with with siblings in college. This suggests that there are not significant spillover effects from having a close relationship with a more experienced market participant, which is also suggestive that personal experience is driving the differences in search costs rather than peer effects.36
Table 2.11 presents the parameter estimates for the alternative-specific utility function. Con-sumers value textbooks less as they progress through school, for courses in their major field, and courses in the spring. This result is surprising for students’ purchasing textbooks within their major fields. One possible explanation is that the negative coefficient reflects multicollinearity between students taking courses within their major field and semesters enrolled (upper year students are more likely to be taking courses in their major field). Stated preferences associated with valuing quality and newness are associated with greater valuation of new textbooks.
Consumers paying for their textbook out of pocket are more price sensitive than consumers receiving fixed or varying payments. Consumers that report paying for their textbook with money from a scholarship are the most price sensitive group. This potentially reflects differences in these students budget constraints. Unfortunately, I do not know whether the scholarship funds are for merit- or needs-based reasons.
2.5.2 Elasticities
Table 2.12 presents simulated price elasticities. Demand for the bookstore alternatives is inelas-tic. This implies that bookstore profits would unambiguously increase from an increase in prices. This counterintuitive result is likely due to features of the textbook market. The first feature is that the campus bookstore is not necessarily profit maximizing. The campus bookstore is designated as a non-profit organization and a portion of its revenues are used to support non-athletic scholarship and fellowship programs of the university.37
Demand is also inelastic for the online alternatives. This implies that if all online retailers and marketplace sellers raised their prices, overall profits would be increased. However, the price elasticity of demand for an individual seller on an online marketplace is likely much more elastic (relative to the entire market).
search costs are relatively large. Additional analysis would include checking the sensitivity of the log-normal distri-bution by using other distridistri-butions with positive support (e.g., Gamma).
37In addition to this, there is already public sentiment against the rising costs of textbooks at the campus bookstore.
Cross price elasticities are sensible. Consumers that purchased from the campus bookstore are more likely to substitute to another bookstore purchase if the price of their original choice increases. Similarly, cross price elasticities within the online alternatives is larger than the cross price elasticities between the online alternatives and bookstore alternatives.
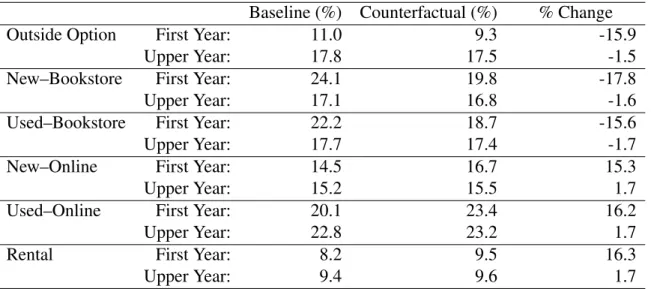
2.5.3 Counterfactuals and Model Fit
The first column of Table 2.13 reports the simulated choice probabilities for the baseline model. The second column reports the simulated choice probabilities for a counterfactual where all con-sumers’ search costs are drawn from the same distribution as eighth semester consumers (while holding their other observable characteristics constant). In other words, all consumers now have the same beliefs about the value of searching in the online market, conditional on other observables being the same. In this counterfactual, inexperienced consumers decrease the frequency with which they choose the outside option by sixteen percent, reduce bookstore purchases by approximately sixteen to eighteen percent, and increase online purchases/rentals by fifteen to sixteen percent.
2.6 Conclusion
This paper finds significant differences in consumers’ search and purchasing behavior across levels of market experience. After controlling for consumer, course, and textbook characteristics that are correlated with experience, consumers’ decision making is still markedly different across experience levels due to changes in consumers’ expected value of search. These results imply that policies that provide information to consumers about characteristics of the online textbook market would yield significant benefits to inexperienced consumers. Moreover, these results carry addi-tional weight in markets where public policy is concerned with increasing access (participation) in the market. I find that information leads to more search which induces market participation for marginal consumers who were not willing to pay the pre-search price. In markets with a signif-icant fraction of inexperienced consumers, informational policies that alleviate uncertainty about market-level characteristics may be a fiscally responsible way of increasing market participation.
This paper takes advantage of an exogenous measure of experience in the college textbook market (semesters enrolled), but there are tradeoffs associated with using this measure. I am able to capture average changes across consumers as gain experience in the market, but am not able to identify the precise signals that consumers are receiving. There are a number of potential signals that consumers receive in this market: past searches or interactions with other market participants (peer effects) are two possible sources. This paper is further limited in its identification of the characteristics of the market that consumers are learning about. In a separate paper with Brett Matsumoto, we find that inexperienced consumers have biased expectations about the price of textbooks in the online market, but that these expectations tend to converge to the empirical mean with experience (Matsumoto and Spence 2013).
Table 2.1: Semesters Enrolled
Semesters Frequency Percent Cumulative
1 821 13.6 13.6
2 789 13.1 26.7
3 614 10.2 36.9
4 782 13.0 49.8
5 681 11.3 61.1
6 705 11.7 72.8
7 617 10.2 83.0
8 552 09.1 92.2
9+ 472 07.8 100
Total 6,033 -
-Table 2.2: Student Demographics
N Mean Std. Dev. Min Max
In-State 6028 0.79 - 0 1
On-Campus 6026 0.60 - 0 1
Male 6022 0.38 - 0 1
First in College 6033 0.54 - 0 1
Course in Major Field 6033 0.59 - 0 1
Age 5978 19.9 2.1 16 61
Table 2.3: Students’ Beginning of Semester Textbook Decisions
Freshmen Upperclassmen
Option Frequency Percent Frequency Percent
Purchased the Textbook 1,353 84.0 3,330 75.3
Rented the Textbook 87 05.4 450 10.2
Borrowed the Textbook 94 05.8 262 05.9
Used a Copy from the Library 8 00.5 101 02.3
Did not use the Textbook 68 04.2 280 06.3
Table 2.4: Students’ Retailer Choices
Freshmen Upperclassmen
Retailer Frequency Percent Frequency Percent
UNC Student Stores 485 53.1 1,172 39.0
Another College Bookstore 4 00.4 61 02.0
Online Retailer 359 39.3 1,641 54.7
Table 2.5: Students’ Online Retailer Choices - Purchased or Rented
Choice of Online Retailer Frequency Percent
Amazon 1,613 66.9
Half (Ebay) 226 09.4
Chegg 203 08.4
Other (Data Collected) 208 08.6
Other (Data Not Collected) 163 06.8
Table 2.6: Students’ Purchasing Behavior
Freshmen Upperclassmen
Percent Percent
Knowledge of Rental Options 74.9 93.1
Priced an Online Retailer 61.0 74.0
Ever Made an Online Purchase 95.8 96.7
Ever Made an Online Sale 33.4 44.6
Table 2.7: Students’ Stated Preferences
Stated Preferences N Mean Std. Dev. Min Max
New Rather than a Used Textbook 6033 1.77 2.25 0 10
Textbook without Notes, etc. 6033 4.00 3.09 0 10
Seeing the Textbook Before Purchasing 6033 3.61 2.81 0 10
Receiving the Textbook on the Day of Purchase 6033 3.20 2.55 0 10
Confidence in Online Shopping 6033 7.36 1.81 0 10
Table 2.8: Correlation in Students’ Stated Preferences
New vs. No Seeing Same Online Fresh.
Used Notes the Book Day Confidence Dummy
New vs Used 1.00 - - - -
-No -Notes 0.51 1.00 - - -
-(0.00)
Seeing the Book 0.41 0.44 1.00 - -
-(0.00) (0.00)
Same Day 0.23 0.20 0.41 1.00 -
-(0.00) (0.00) (0.00)
Online Conf. -0.06 -0.05 -0.20 -0.20 1.00
-(0.00) (0.00) (0.00) (0.00)
Fresh. Dum. 0.05 0.07 0.11 0.04 -0.09 1.00
Table 2.9: Distribution of Payments for Textbooks
Freshmen Upperclassmen
Frequency Percent Frequency Percent
Self 446 31.4 1,677 44.9
Another person - Varying Payment 853 60.0 1,785 47.7
Another person - Fixed Payment 48 03.4 86 02.3
Scholarship 74 05.2 191 05.1
Table 2.10: Search Cost Estimates
Covariate Point Estimate Standard Error
Constant 10.890 (2.632)
Online Confidence -0.894 (.227)
First in College -0.199 (.146)
Prev. Online Purchase -5.478 (1.54)
Semesters -0.937 (.078)
Semesters Squared 0.0636 (.002)
✓2 5.34 (.125)
Notes: N = 6033, Simulation Draws = 50
Bootstrapped Standard Errors in Parentheses: 250 Replications
Table 2.11: Utility Parameter Estimates
Covariate Point Estimate Standard Error
Semesters -0.286 (.002)
Semesters Squared 0.016 (.000)
Course in Major -0.106 (.019)
Spring Indicator -0.740 (.017)
Preference for New 0.087 (.005)
Preference for Quality 0.158 (.005)
↵- Out of Pocket -0.560 (.010)
↵- Fixed Payment -0.204 (.031)
↵- Varying Payment -0.309 (.007)
↵- Scholarship -0.964 (.008)
Continuation Value 0.234 (.040)
Notes: N = 6033, Simulation Draws = 50
Table 2.12: Elasticity Estimates
Outside New - Used - New - Used - Rental
Option Bkstore Bkstore Online Online
Outside Option . 0.09 0.08 0.06 0.09 0.04
New - Bookstore . -0.30 0.08 0.05 0.06 0.03
Used - Bookstore . 0.08 -0.29 0.04 0.06 0.03
New - Online . 0.06 0.05 -0.33 0.11 0.05
Used - Online . 0.05 0.05 0.08 -0.32 0.05
Rental . 0.06 0.07 0.07 0.15 -0.41
Notes: N = 4234. Excludes textbook obs. not offered online and new/bkstr. price<$40. Unbracketed results denote percentages for first-year and upper-level students.
Brackets denote first-year students. Parentheses denote upper-level students. Elasticities are calculated by increasing the price of the column alternative by 10%.
Table 2.13: Eighth Semester Search Costs Counterfactual
Baseline (%) Counterfactual (%) % Change
Outside Option First Year: 11.0 9.3 -15.9
Upper Year: 17.8 17.5 -1.5
New–Bookstore First Year: 24.1 19.8 -17.8
Upper Year: 17.1 16.8 -1.6
Used–Bookstore First Year: 22.2 18.7 -15.6
Upper Year: 17.7 17.4 -1.7
New–Online First Year: 14.5 16.7 15.3
Upper Year: 15.2 15.5 1.7
Used–Online First Year: 20.1 23.4 16.2
Upper Year: 22.8 23.2 1.7
Rental First Year: 8.2 9.5 16.3
Upper Year: 9.4 9.6 1.7