Sociodemographic Disparities in Proximity of
Schools to Tobacco Outlets and Fast-Food
Restaurants
Heather D’Angelo, PhD, Alice Ammerman, DrPH, RD, Penny Gordon-Larsen, PhD, Laura Linnan, ScD, Leslie Lytle, PhD, and Kurt M. Ribisl, PhD
Objectives.To examine the association of school sociodemographic characteristics with tobacco outlet and fast-food restaurant availability near schools in a national study. Methods.Business lists and data from the National Center for Education Statistics were used to calculate the numbers of tobacco outlets and fast-food restaurants within 800 meters of public schools in 97 US counties.
Results.More than 50% of schools with a majority of Hispanic students had both a fast-food restaurant and tobacco outlet nearby, compared with 21% of schools with a majority of White students. In adjusted models, each 10% increase in the number of low-income and Hispanic students enrolled in a school led to a 3% to 5% increase in the odds of the school having both a fast-food restaurant and a tobacco outlet nearby.
Conclusions.Low-income and Hispanic students are disproportionately exposed to both tobacco outlets and fast-food restaurants near their schools. Easy access to tobacco products and fast food may influence youth smoking initiation and contribute to poor dietary intake. (Am J Public Health. 2016;106:1556–1562. doi:10.2105/AJPH.2016. 303259)
O
besity and tobacco use are risk factors for cardiovascular disease and many forms of cancer, and disparities in both of these risk factors exist by socioeconomic status and race/ethnicity1(for example, obesity rates are higher among non-Hispanic Black and Hispanic youths than among non-Hispanic White youths2). Fast-food consumption has been associated with increased total energy, fat, sodium, and sugar-sweetened beverage intake among both children and adolescents,3 which may contribute to future obesity and overweight.4In the case of all racial/ethnic groups, smoking initiation rates are highest among lower income youths,5and tobacco use rates have been shown to be higher among Hispanic than White middle schoolers.6 Nearly 90% of adult smokers initiate smoking before the age of 18 years,7and thus early interventions targeting vulnerable populations are critical. Furthermore, smoking and poor dietary intake appear to covary,8consolidate early,9and track together over time.8–10
Young people are exposed to retail outlets in school neighborhoods when they walk, drive to and from school, or leave campus during lunch. Evidence suggests that the availability of fast-food restaurants (FFRs) near schools is associated with higher body mass index11and that the availability of nearby retail tobacco outlets (TOs) is asso-ciated with experimental smoking among young people.12Students permitted to leave school during lunch are more likely than students on closed campuses to consume fast food,13and exposure to point-of-sale tobacco marketing has been associated with youth smoking initiation, prevalence, and susceptibility as well as pro-smoking attitudes.14
Increased availability of FFRs and TOs near schools is a problem for youths not only because of easier access to unhealthy products but also because of increased exposure to point-of-sale marketing of those products. Both fast-food and tobacco companies target low-income, minority, and youth populations with promotions and advertising.15,16FFRs in lower income neighborhoods are more likely than those in higher income neighborhoods to offer free prizes with purchases and kids’meals.17 Similarly, stores selling tobacco products in lower income and racial/ethnic minority neighborhoods have more tobacco market-ing,18lower cigarette prices,19and higher availability of products with youth appeal (e.g., menthol cigarettes, cigarillos).18
To our knowledge, no research to date has concomitantly examined both the availability of FFRs and TOs near schools and the extent to which their availability differs according to race/ethnicity and student socioeconomic status. To address this gap, we examined the availability of FFRs and TOs near public schools in a national sample of US counties in association with student race, ethnicity, and socioeconomic status. We hypothesized that schools with higher pro-portions of Black students, Hispanic students, and students receiving free or reduced-price lunches would have more FFRs nearby, would have more TOs nearby, and would be more likely to have both an FFR and a TO nearby than would schools that were less diverse and had fewer students eligible for free
ABOUT THE AUTHORS
At the time of the study, Heather D’Angelo was with the Department of Health Behavior, Gillings School of Global Public Health, University of North Carolina, Chapel Hill. Laura Linnan, Leslie Lytle, and Kurt M. Ribisl are with the Department of Health Behavior, Gillings School of Global Public Health. Alice Ammerman and Penny Gordon-Larsen are with the De-partment of Nutrition, Gillings School of Global Public Health.
Correspondence should be sent to Heather D’Angelo, PhD, Westat, 1700 Research Boulevard, Rockville, MD 20850 (e-mail: [email protected]). Reprints can be ordered at http://www.ajph.org by clicking the“Reprints”link.
or reduced-price lunches. Because older students may have greater autonomy and purchasing power, we also hypothesized that high schools and middle schools would have more FFRs and TOs nearby than would primary schools and would be more likely to have both nearby.
METHODS
As part of a larger study, Advancing Science and Policy in the Retail Environ-ment, we selected a random sample of counties within the contiguous United States in 2011 via a probability proportionate to size method with minimal replacement. Because we selected counties in this manner, larger, more populous counties were more likely to be chosen, resulting in an overall study area with higher proportions of His-panic and Black residents than the national average. The resulting 97 counties within 40 states comprised 25.7% of the US population. We used secondary data sources to obtain the locations of all public schools, tobacco outlets, and fast-food restaurants within each county. Table 1 lists each data source and corresponding measures.
We identified 18 457 public primary, middle, and high schools within the study counties. We excluded 71 duplicate schools (i.e., identical with respect to school name, address, and student enrollment) and 7 schools that were online-only schools, hospitals, residential treatment centers, or juvenile detention facilities, leaving 18 379 schools for our analyses. Private schools were not included in the sample; however, charter schools were included if they were classified as public schools by the National Center for Education Statistics.
Fast-Food Restaurants and
Tobacco Outlets
We purchased FFR data from Dun & Bradstreet using codes consistent with similar studies (Table 1).20Food outlet validation studies have shown that com-mercial sources of such data have at least moderate sensitivity.21A national retail tobacco outlet licensing system does not exist; therefore, we used a list of probable tobacco outlets generated for Advancing
Science and Policy in the Retail Environment from Dun & Bradstreet and ReferenceUSA and selected types of establishments likely to sell tobacco products (Table 1).22Chains known to not sell tobacco were excluded (e.g., Target), and among pharmacies we retained the top 50 chains to improve the specificity of our list.
We created shapefiles (a vector format for storing the locations, shapes, and attributes of geographic features) using QGIS 2.2.0 and calculated the geographic coordinates of schools, FFRs, and TOs by using NAD 83 Conus Albers projections. Geographic points were joined with census tracts from the 2010 US census and tract-level data on population size and land area for the study counties. We created Euclidean radial buffers 800 meters from each school cen-troid, a commonly used distance to account for a 10-minute walk.23The“count points in polygon”tool in QGIS was used to calculate the total number of FFRs and TOs within each school buffer area. Because our study area included noncontiguous counties, some schools had buffers extending beyond the study area (n = 323). A sensitivity analysis excluding these schools resulted in similarfindings, and thus we present the results including all 18 379 schools.
Measures
Dependent variables.Three dependent variables were created within 800-meter radial school buffers: number of FFRs, number of TOs, and a binary outcome indicating whether a school had both an FFR and a TO nearby (vs only 1 or neither an FFR nor a TO).
Independent variables.We used the proportion of students receiving free or reduced-price lunches (low-income students) and the proportion of Black and Hispanic students to assess school sociodemographic characteristics. School level (primary, mid-dle, high) and total student enrollment were employed as covariates. To control for urbanicity, we used population per square mile at the census tract level (similar to another national study24) and school urban centric locale (city, suburb, town, rural) as measures of a school’s location relative to populous areas.
Data Analysis
We calculated descriptive statistics for schools and the overall study area. The unadjusted average number of FFRs and TOs in each 800-meter buffer was assessed according to quartiles of student demographic characteristics (e.g., income, race/ethnicity). We conducted analyses of variance with Bonferroni pairwise comparisons to compare means across quartiles. We used generalized linear mixed models to estimate associations between FFR and TO counts near schools and student characteristics; we included a random effect at the county level to account for clustering of schools within counties resulting from the sampling design. We included county population size in our adjusted models to account for the sampling design in lieu of sampling weights.
Goodness offit (c2) tests showed that a negative binomial model was a betterfit for the data than was a Poisson model because of overdispersion of the count data. We calculated incidence rate ratios (IRRs) and 95% confidence intervals (CIs) based on these models. A generalized linear mixed model with a binary distribution was used to predict the odds of schools having both types of outlets (vs 1 or none) in association with school characteristics. Odds ratios and 95% confidence intervals were based on this model. We used the Markov chain Monte Carlo method of multiple imputation in SAS version 9.3 (SAS Institute Inc, Cary, NC) to impute missing data on the percentage of students receiving free or reduced-price lunches (n = 4955), the percentage of Black students (n = 3), and the percentage of Hispanic students (n = 3). Twenty imputed data sets were generated via PROC MI and modeled via PROC GLIMMIX and PROC MIANALYZE. We also ran models including complete cases (n = 13 421) and the results were similar; therefore, we present the results with the imputed data.
RESULTS
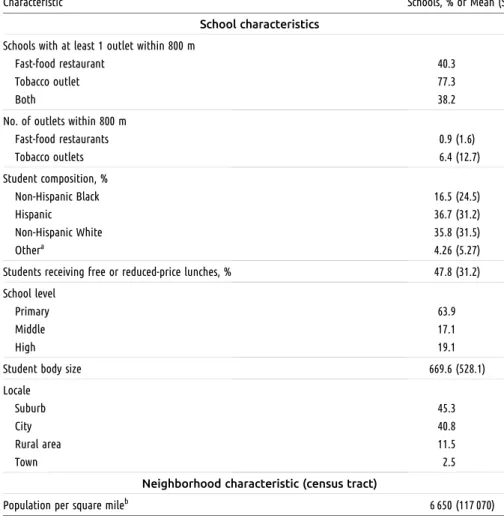
meters. Schools had an average of 0.9 FFRs (range = 0–29) and 6.4 TOs (range = 0–269) within 800 meters. Schools were com-posed of, on average, 16.3% Black students, 34.6% Hispanic students, and 35.8% non-Hispanic White students (Table 2). Nearly half of students received free or reduced-price lunches (47.8%). Most schools were primary schools (63.9%), and more than 45% were located in sub-urban areas; 40% were located in cities, and the remainder were located in towns or rural areas (Table 2).
Bivariate Analyses
Average numbers of FFRs and TOs near schools increased with each increasing quar-tile of Hispanic students, Black students, and students receiving free or reduced-price lunches. The inverse was true for quartiles of White students (Figure 1). For example, schools comprising the highest quartile of White students had an average of 0.4 FFRs within 800 meters, compared with averages
of 1.3, 1.0, and 1.1 FFRs near schools comprising the highest quartiles of Hispanic students, Black students, and students ceiving free or reduced-price lunches, re-spectively. Similar patterns were observed for TOs, with an average of 2.8 outlets near schools comprising the highest quartile of White students, compared with 9.2, 9.6, and 10.9 near schools comprising the highest quartiles of Hispanic students, Black students, and students receiving free or reduced-price lunches, respectively.
The difference in the average number of FFRs and TOs between the lowest and highest quartiles within each student de-mographic category was statistically signifi -cant (P<.05). The percentage of schools that had both an FFR and a TO within 800 meters increased with each increasing quartile of Hispanic students, Black students, and stu-dents receiving free or reduced-price lunches but decreased with each increasing quartile of White students. Nearly 53% of schools comprising the highest quartile of Hispanic students, 41% of schools comprising the
highest quartile of Black students, and 46% of schools comprising the highest quartile of students receiving free or reduced-price lunches had both an FFR and a TO within 800 meters, compared with 38% of schools overall and only 21% of schools within the highest White student population quartile (Figure 1).
Multilevel Models
Table 3 presents models focusing on FFR and TO availability after adjustment for school enrollment, school level, school urban locale, and county population size. The number of FFRs within 800 meters of a school increased by 6% for each 10-percentage-point increase in the proportion of Hispanic students in the school and by 3% for each 10-percentage-point increase in the proportion of low-income students (Table 3). The proportion of Black students in a school was not significantly associated with the number of FFRs nearby but was positively associated with number of TOs (IRR = 1.04; 95% CI = 1.03, 1.05). Similarly, the number of TOs within 800 meters of a school increased by 8% and 4% for each 10-percentage-point increase in the proportions of Hispanic and low-income students enrolled in the school, respectively.
The odds of a school having both an FFR and a TO within 800 meters increased by 5% for each 10-percentage-point increase in the proportion of Hispanic students enrolled in the school and by 3% for each 10-percentage-point increase in the school’s proportion of low-income students. There was a slight positive but nonsignificant association between the percentage of Black students enrolled in a school and the school’s odds of having both types of outlets nearby (Table 3).
We also found a strong association be-tween school level and the availability of FFRs and TOs. High schools had 40% more FFRs and 24% more TOs within 800 meters than did primary schools, and high schools had nearly 1.5 times greater odds of having both an FFR and a TO nearby. There was no significant difference between middle and primary schools in the number of FFRs, TOs, or the odds of having both an FFR and a TO nearby.
TABLE 1—Measures, Data Sources, and Inclusion Criteria
Measure Source and Inclusion Information
Schools
Geographic coordinates National Center for Education Statistics, Elementary/Secondary Information System (2010–2011)
Locale (city, suburb, town, rural area) Public schools School level (primary, middle, high)
No. of students enrolled Non-Hispanic Black students, % Hispanic students, %
Students receiving free or reduced-price lunches, %
Fast-food restaurants
Geographic coordinates Dun & Bradstreet Inc. (2011) Chain fast-food and pizza restaurants
Tobacco retail outlets
Geographic coordinates Dun & Bradstreet Inc. and ReferenceUSA (merged; 2011) Supermarkets and other grocery stores
Convenience stores Tobacco stores
DISCUSSION
We examined the availability of FFRs and TOs near schools in a national sample of US counties in association with student de-mographic characteristics. More than 40% of all schools had at least 1 FFR within a 10-minute walk (800 m), nearly 80% had at least 1 TO, and approximately 40% had both. Bivariate analyses showed that average numbers of FFRs and TOs and the percentage of schools with both types of outlets within 800 meters increased as concentrations of Hispanic, Black, and low-income students increased. For ex-ample, more than half of schools comprising the highest quartile of Hispanic students had both an FFR and a TO within 800 meters compared with only 21% of schools
comprising the highest quartile of White students.
The number of FFRs and TOs near schools was also associated with student race/ ethnicity and socioeconomic status in models controlling for school and neighborhood characteristics. Ourfirst hypothesis, which focused on whether student racial/ethnic and socioeconomic compositions were associated with the number of FFRs near schools, was supported for Hispanic and low-income students but not Black students. Our results are similar to those of a pair of US national studies that also controlled for school urban locale. One of these studies revealed a positive association between numbers of FFRs near schools and proportions of Hispanic and low-income students but no association for
non-Hispanic Black students.25The second study showed that there were more FFRs near schools in low-income than high-income neighborhoods but fewer FFRs near schools in predominantly Black compared with White neighborhoods.24
Our second hypothesis was fully sup-ported. We found a higher number of TOs near schools with greater proportions of Black, Hispanic, and low-income students. Similarly, a national study showed that TO density was higher in neighborhoods with more Black and Hispanic residents,26and our
findings are similar to those of studies that have explicitly assessed the availability of TOs near schools. For example, one investigation showed that California high schools in neighborhoods with at least 5 TOs within a half mile had higher proportions of Hispanic and low-income students.27Another study revealed that New York City schools located in neighborhoods with a higher proportion of low-income residents had greater TO density within both a quarter- and a half-mile radius.28Unlike our study, TO density near schools has been shown to be inversely associated with the proportion of Black residents in Chicago29and not associated with the proportion of Black students in California.27
Our third hypothesis was partially sup-ported. We found that schools with higher proportions of Hispanic and low-income students, but not Black students, were more likely to have both an FFR and a TO nearby. There are several possible explanations for our
finding of more TOs but not more FFRs near schools with higher numbers of Black students. The growth of the Hispanic pop-ulation in the United States has led food marketing and advertising companies to target younger, Hispanic audiences,30and the fast-food industry is able to reach its audience through television ads.15By contrast, the tobacco industry is banned from advertising on television and spends considerably more money than does the fast-food industry at the point of sale,31and it has historically targeted low-income Black neighborhoods and youths with point-of-sale marketing and promotions.16Chain FFRs represent cor-porate brands that may use more complex information to determine their locations, such as foot traffic, safety, and consumer de-mographics, which may lead to FFRs being
TABLE 2—Characteristics of Schools (n = 18 379) and the Overall Study Area: 97 US Counties, 2011
Characteristic Schools, % or Mean (SD)
School characteristics
Schools with at least 1 outlet within 800 m
Fast-food restaurant 40.3
Tobacco outlet 77.3
Both 38.2
No. of outlets within 800 m
Fast-food restaurants 0.9 (1.6)
Tobacco outlets 6.4 (12.7)
Student composition, %
Non-Hispanic Black 16.5 (24.5)
Hispanic 36.7 (31.2)
Non-Hispanic White 35.8 (31.5)
Othera 4.26 (5.27)
Students receiving free or reduced-price lunches, % 47.8 (31.2)
School level
Primary 63.9
Middle 17.1
High 19.1
Student body size 669.6 (528.1)
Locale
Suburb 45.3
City 40.8
Rural area 11.5
Town 2.5
Neighborhood characteristic (census tract)
Population per square mileb 6 650 (117 070)
a
Asian, American Indian/Alaska Native, or Hawaiian/Pacific Islander; categories do not sum to 100% because reporting did not capture categories comprising multiple races and ethnicities.
less available in the most deprived areas. By contrast, an independently owned conve-nience store is likely not subject to the same location constraints.
Differences in the types of outlets included and the commercial business lists used could contribute to inconsistencies between our study and others. We included only chain fast-food and pizza restaurants to capture the major restaurants found in nearly every state, many of which are heavily marketed toward youths. Previous studies in smaller geographic areas have included tobacco licensing lists or single sources of business lists, whereas we
used a systematic process to clean and merge 2 business lists; also, to improve list specificity, we excluded chains known not to sell tobacco products. Afield validation involving the same 2 business lists showed that this method correctly identified nearly 90% of all TOs in a 3-county study area.22The use of different school buffer areas (network vs Euclidean buffers, for example) and different neigh-borhood definitions (census tracts vs school buffer areas) could also contribute to vari-ability in studyfindings.
Finally, similar to another study,32we found more FFRs around both high schools
and middle schools than around primary schools. Although the fast-food industry overtly targets both children and adoles-cents,15older children are more autonomous than younger children, more likely to be permitted to walk to a restaurant during or after school, and more likely to have dis-posable income. We also found that high schools (although not middle schools) had more TOs nearby than did primary schools and were more likely to have both an FFR and a TO nearby. Stores that sell tobacco may target older adolescents who have more purchasing power and can buy a broader
1.0 1.5
0.5
Hispanic Non-Hispanic Black Low Income Non-Hispanic White
2 4 6 8 10 12
Hispanic Non-Hispanic Black Low Income Non-Hispanic White
0.2 0.4 0.6
0.1
Hispanic Non-Hispanic Black Low Income Non-Hispanic White
1.0 1.5
0.5
1.0 1.5
0.5
1.0 1.5
0.5
Number Number
Number
Number Number
2 4 6 8 10 12
Number
2 4 6 8 10 12
Number
2 4 6 8 10 12
Number
Pe
rc
entage
0.2 0.4 0.6
0.1
Pe
rc
entage
0.2 0.4 0.6
0.1
Pe
rc
entage
0.2 0.4 0.6
0.1
Pe
rc
entage
a
b
c
Hispanic, % Non-Hispanic Black, % Low Income, % Non-Hispanic White, % <8.8
8.8–27.2 >27.2–61.7
>61.7
0–1.9 > 1.9–6.0 > 6.0–18.3
> 18.3
0–19.0 >19.0–45.8 >45.8–76.9
>76.9
0–4.9 >4.9–29.3 >29.3–63.6
>63.6 Q1
Q2 Q3 Q4
Note. Cutoffs for quartiles are shown in the legend.
range of products, and some may be legally able to purchase tobacco. However, sales to minors are also more likely to occur among older than younger adolescents,33and thus thefinding of greater availability of tobacco outlets around high schools is troubling. The increased numbers of FFRs, TOs, and both types of outlets around high schools suggests that retailers may be well aware of and ready to take advantage of the autonomy and purchasing power of older youths.
Strengths and Limitations
This is thefirst study to our knowledge to examine both FFR and TO availability near public schools in association with student race, ethnicity, and socioeconomic status. Our counties were selected proportionate to population size, and therefore the schools in our sample were more suburban and urban than typical and may not be generalizable to all US schools. It is likely that our narrow inclusion criteria (i.e., we included only chain fast-food and pizza restaurants) and extensive list cleaning (to exclude chains known not to sell tobacco) improved the capacity of our lists to accurately capture FFR and TO availability
near schools. However, our list may have included stores that do not actually sell to-bacco products or may have involved un-dercounts or overcounts of the number of actual TOs or FFRs in the study area.
In addition, by not classifying convenience stores as a potential source of unhealthy foods, we underestimated the ways in which con-venience stores located near schools might affect the food choices of school-aged youths. Since 2011, changes may have occurred in the retail environment. For example, CVS pharmacy stopped selling tobacco products in 2014, which may have improved the tobacco retail environment near some schools. However, nationally CVS represented only about 2% of tobacco outlets22in 2011. Finally, although an 800-meter buffer is a commonly used measure for estimating reasonable walking distances for young people, it may not capture true school neighborhood access.
We used generalized linear mixed models to account for the sampling design and clustering of schools within counties. We did not use a spatial regression model to account for spatial autocorrelation in our dependent variables; however, our use of generalized
linear mixed models with random effects at the county level accounted for the correlation between schools with respect to the de-pendent variable. Furthermore, adding a spatial component to models involving count data has been found to only marginally improve modelfit beyond a standard Poisson or negative binomial regression model.34 We did not assess individual dietary intake or tobacco use among students. However, identifying differences in the food and to-bacco retail environments around schools can inform licensing and zoning policies intended to create sustainable, environmental changes that can have an impact at the population level.35
Conclusions
In our sample of US counties, low-income, Hispanic, and high school students were disproportionately exposed to both FFRs and TOs near schools. Licensing or zoning policies restricting the location of fast-food and tobacco retail outlets in school neighborhoods could reduce youth access to fast-food and tobacco products and adver-tising. However, although there is evidence
TABLE 3—Incidence Rate Ratios and Odds Ratios for Availability of Fast-Food Restaurants (FFRs), Tobacco Outlets (TOs), and Both Within 800 m of Public Schools: 97 US Counties, 2011
Variable FFRs, IRR (95% CI) TOs, IRR (95% CI)
At Least 1 FFR and 1 TO, OR (95% CI)
Student race/ethnicitya
White/other (Ref) 1 1 1
Hispanic 1.06 (1.04, 1.07) 1.08 (1.07, 1.09) 1.05 (1.03, 1.07)
Non-Hispanic Black 1.01 (0.99, 1.02) 1.04 (1.03, 1.05) 1.01 (0.99, 1.03)
Student receipt of free/reduced-price lunchesa
No (Ref) 1 1 1
Yes 1.03 (1.02, 1.04) 1.04 (1.03, 1.05) 1.03 (1.01, 1.05)
School level
Primary school (Ref) 1 1 1
Middle school 1.06 (0.99, 1.13) 1.03 (0.99, 1.07) 1.08 (0.98, 1.18)
High school 1.40 (1.32, 1.50) 1.24 (1.19, 1.30) 1.45 (1.32, 1.60)
Locale
City (Ref) 1 1 1
Suburb 0.80 (0.76, 0.85) 0.63 (0.60, 0.65) 0.83 (0.77, 0.90)
Town 0.63 (0.52, 0.76) 0.61 (0.54, 0.68) 0.69 (0.53, 0.88)
Rural area 0.15 (0.13, 0.18) 0.20 (0.19, 0.22) 0.16 (0.13, 0.19)
Note. CI = confidence interval; IRR = incidence rate ratio; OR = odds ratio. The sample size was n = 18 379 schools.
aScaled for a 10-percentage-point-increase interpretation; models were adjusted for total number of students enrolled and county population size. Adjustment
linking exposure to tobacco outlets and marketing to youth smoking,14more research is needed to disentangle the association of fast-food restaurant availability near schools with dietary intake and subsequent obesity among young people. Studies examining the effects of the built environment on youth health behaviors would benefit from multi-level designs that focus on the relative con-tributions of home and school neighborhoods and parental and peer factors. Implementing licensing or zoning policies could create sustained environmental change, influence social norms, and improve the health of future generations of children and families.
CONTRIBUTORS
H. D’Angelo originated and refined the concept for the article with extensive guidance and feedback from all coauthors. H. D’Angelo conducted the analyses and led the development and writing of the article. A. Ammerman, P. Gordon-Larsen, L. Linnan, L. Lytle, and K. M. Ribisl contributed to critical interpretation of results and revised the article for important intellectual content.
ACKNOWLEDGMENTS
Funding for this study was provided by grant U01 CA154281 from the National Cancer Institute’s State and Community Tobacco Control Initiative.
This study was part of Advancing Science and Policy in the Retail Environment (ASPiRE), a consortium of re-searchers from Stanford University, the University of North Carolina at Chapel Hill, and Washington University in St. Louis. Many thanks to the ASPiRE research team, especially Lisa Henriksen and Nina Schleicher for their help and support with the tobacco outlet data.
Note.The funders had no involvement in the study design, data collection and analysis, writing, or interpretation.
HUMAN PARTICIPANT PROTECTION No protocol approval was needed for this study because no human participants were involved.
REFERENCES
1. Spruijt-Metz D, Cook L, Wen CF, et al.Behavioral Differences Leading to Disparities in Energy Balance and Cancer: Impact of Energy Balance on Cancer Disparities. New York, NY: Springer; 2014.
2. Ogden CL, Carroll MD, Kit BK, Flegal KM. Preva-lence of childhood and adult obesity in the United States, 2011–2012.JAMA. 2014;311(8):806–814.
3. Powell LM, Nguyen BT. Fast-food and full-service restaurant consumption among children and adolescents: effect on energy, beverage, and nutrient intake.JAMA Pediatr. 2013;167(1):14–20.
4. Rosenheck R. Fast food consumption and increased caloric intake: a systematic review of a trajectory towards weight gain and obesity risk.Obes Rev. 2008;9(6):535–547.
5. Harrell JS, Bangdiwala SI, Deng S, Webb JP, Bradley C. Smoking initiation in youth: the roles of gender, race, socioeconomics, and developmental status.J Adolesc Health. 1998;23(5):271–279.
6. Centers for Disease Control and Prevention. Tobacco product use among middle and high school students—
United States, 2011 and 2012.MMWR Morb Mortal Wkly Rep. 2013;62(45):893–897.
7. US Department of Health and Human Services. Pre-venting Tobacco Use Among Youth and Young Adults: A Report of the Surgeon General. Atlanta, GA: Centers for Disease Control and Prevention; 2012.
8. Lytle LA, Kelder SH, Perry CL, Klepp K-I. Covariance of adolescent health behaviors: the Class of 1989 Study.
Health Educ Res. 1995;10(2):133–146.
9. Larson NI, Story M, Neumark-Sztainer D, Hannan PJ. Peer Reviewed: Are diet and physical activity patterns related to cigarette smoking in adolescents? Findings from Project EAT.Prev Chronic Dis. 2007;4(3):A51.
10. Kelder SH, Perry CL, Klepp K-I, Lytle LL. Longitudinal tracking of adolescent smoking, physical activity, and food choice behaviors.Am J Public Health. 1994;84(7):1121–1126.
11. Davis B, Carpenter C. Proximity of fast-food res-taurants to schools and adolescent obesity.Am J Public Health. 2009;99(3):505–510.
12. McCarthy WJ, Mistry R, Lu Y, Patel M, Zheng H, Dietsch B. Density of tobacco retailers near schools: effects on tobacco use among students.Am J Public Health. 2009;99(11):2006–2013.
13. Neumark-Sztainer D, French SA, Hannan PJ, Story M, Fulkerson JA. School lunch and snacking patterns among high school students: associations with school food envi-ronment and policies.Int J Behav Nutr Phys Act. 2005;2(1):14.
14. Robertson L, Cameron C, McGee R, Marsh L, Hoek J. Point-of-sale tobacco promotion and youth smoking: a meta-analysis.Tob Control. 2016;Epub ahead of print.
15. Powell LM, Harris JL, Fox T. Food marketing ex-penditures aimed at youth: putting the numbers in context.Am J Prev Med. 2013;45(4):453–461.
16. Yerger VB, Przewoznik J, Malone RE. Racialized geography, corporate activity, and health disparities: tobacco industry targeting of inner cities.J Health Care Poor Un-derserved. 2007;18(suppl 4):10–38.
17. Lee RE, Heinrich KM, Reese-Smith JY, Regan GR, Adamus-Leach HJ. Obesogenic and youth oriented restaurant marketing in public housing neighborhoods.
Am J Health Behav. 2014;38(2):218–224.
18. Lee JG, Henriksen L, Rose SW, Moreland-Russell S, Ribisl KM. A systematic review of neighborhood dis-parities in point-of-sale tobacco marketing.Am J Public Health. 2015;105(9):e8–e18.
19. Toomey TL, Chen V, Forster JL, Van Coevering P, Lenk KM. Do cigarette prices vary by brand, neigh-borhood, and store characteristics?Public Health Rep. 2009;124(4):535–540.
20. Richardson AS, Boone-Heinonen J, Popkin BM, Gordon-Larsen P. Neighborhood fast food restaurants and fast food consumption: a national study.BMC Public Health. 2011;11(1):543.
21. Fleischhacker SE, Evenson KR, Sharkey J, Pitts SB, Rodriguez DA. Validity of secondary retail food outlet data: a systematic review.Am J Prev Med. 2013;45(4):462–473.
22. D’Angelo H, Fleischhacker S, Rose SW, Ribisl KM. Field validation of secondary data sources for enumerating retail tobacco outlets in a state without tobacco outlet licensing.Health Place. 2014;28:38–44.
23. Brownson RC, Hoehner CM, Day K, Forsyth A, Sallis JF. Measuring the built environment for physical activity: state of the science.Am J Prev Med. 2009;36(4): S99–S123.
24. Zenk SN, Powell LM. US secondary schools and food outlets.Health Place. 2008;14(2):336–346.
25. Sturm R. Disparities in the food environment sur-rounding US middle and high schools.Public Health. 2008; 122(7):681–690.
26. Rodriguez D, Carlos HA, Adachi-Mejia AM, Berke EM, Sargent JD. Predictors of tobacco outlet density nationwide: a geographic analysis.Tob Control. 2013;22(5):349–355.
27. Henriksen L, Feighery EC, Schleicher NC, Cowling DW, Kline RS, Fortmann SP. Is adolescent smoking related to the density and proximity of tobacco outlets and retail cigarette advertising near schools?Prev Med. 2008;47(2):210–214.
28. Frick M, Castro M. Tobacco retail clustering around schools in New York City: examining“place”and “space.”Health Place. 2013;19:15–24.
29. Novak SP, Reardon SF, Raudenbush SW, Buka SL. Retail tobacco outlet density and youth cigarette smoking: a propensity-modeling approach.Am J Public Health. 2006;96(4):670–676.
30. Rizkallah EG, Truong A. Consumptive behavior, promotional preferences, and shopping patterns of His-panic Americans: an empirical perspective.J Bus Econ Res. 2010;8(4):111–122.
31.Federal Trade Commission Cigarette Report for 2009 and 2010. Washington, DC: US Federal Trade Commission; 2012.
32. Neckerman KM, Bader MD, Richards CA, et al. Disparities in the food environments of New York City public schools.Am J Prev Med. 2010;39(3):195–202.
33. Clark PI, Natanblut SL, Schmitt CL, Wolters C, Iachan R. Factors associated with tobacco sales to minors: lessons learned from the FDA compliance checks.JAMA. 2000;284(6):729–734.
34. Gschl¨oßl S, Czado C. Modelling count data with over-dispersion and spatial effects.Stat Papers. 2008;49(3):531–552.