THE CHARACTERIZATION OF NORMAL WEIGHT OBESITY IN COLLEGE STUDENTS
Kara Christen Anderson
A thesis submitted to the faculty of the University of North Carolina at Chapel Hill in partial fulfillment of the requirements for the degree of Master of Arts in the Department of Exercise
and Sport Science (Exercise Physiology).
Chapel Hill 2018
Approved by: Abbie E. Smith-Ryan
Kristin S. Ondrak,
ii © 2018
iii ABSTRACT
Kara Christen Anderson: The Characterization of Normal Weight Obesity in College Students (Under the direction of Abbie Smith-Ryan)
iv
ACKNOWLEDGEMENTS
First off, thank you to my committee for all of their time and guidance during the course of my thesis. Their thoughts and direction have been an invaluable piece of this process. Also, thank you to my lab team for all of their assistance and support; I would not have been able to complete this project without them, along with all of the students at UNC who volunteered their time to participate in this study. Lastly, I want to thank my advisor, Dr. Abbie Smith-Ryan, for pushing me to make this thesis the best it could be. She helped me cultivate this idea into fruition, and her guidance throughout this and all my other endeavors at UNC is much appreciated.
v
TABLE OF CONTENTS
LIST OF TABLES ... VII LIST OF FIGURES ... VIII
LIST OF ABBREVIATIONS………
……
IXCHAPTER I ... vii
Purpose ... 3
Research Questions ... 4
Research Hypotheses ... 4
Delimitations ... 4
Limitations ... 5
Assumptions ... 5
Theoretical ... 5
Statistical ... 6
Definition of Terms ... 6
Significance of Study ... 7
CHAPTER II: ... 8
REVIEW OF LITERATURE ... 8
Introduction ... 8
Obesity ... 9
Normal Weight Obesity ... 11
Weight Gain and Obesity in College ... 13
Lifestyle Patterns ... 14
Conclusion ... 17
CHAPTER III ... 19
vi
Experimental Design ... 20
Body Composition ... 20
Visceral Adipose Tissue ... 21
Cardiometabolic Biomarker Analysis ... 22
Questionnairres ... 23
Statistical Analysis ... 23
CHAPTER IV: MANUSCRIPT ... 24
Introduction ... 24
Methods ... 26
Participants ... 26
Experimental Design ... 27
Statistical Analysis ... 31
Results ... 31
Discussion ... 35
CHAPTER V: CONCLUSION ... 42
TABLES ... 43
FIGURES ... 47
REFERENCES ... 51
vii
LIST OF TABLES
Table 1: DEXA BF% Cut offs used to classify participants as NWO ... 43 Table 2: Participant descriptive characteristics for the NWO total sample, males, and females...44
Table 3: WHR of the female cohort………...………....………...45 Table 4: NWO Cardiometabolic Health Variables……….………..46
viii
LIST OF FIGURES
Figure 1: CONSORT (Consolidated Standards of Reporting Trials) diagram….………47
Figure 2: VATUS measurement……….………...…48
Figure 3: NWO sex specific occurrence………..………..49 Figure 4: A. Mean ± standard deviation for A. fat mass (FM) and
ix
LIST OF ABBREVIATIONS BMI Body Mass Index
BF% Body Fat Percentage
LM Lean Mass
NWO Normal Weight Obesity HDL High Density Lipoproteins NHDL Non-High Density Lipoproteins VAT Visceral Adipose Tissue
DEXA Dual Energy X-Ray Absorptiometry
US Ultrasound
DM Diabetes Mellitus CVD Cardiovascular Disease
MS Metabolic Syndrome
CT Computed Topography
BIA Bioelectrical Impedance Spectroscopy IPAQ International Physical Activity Questionnaire PSS Perceived Stress Scale
PSQI Pittsburgh Sleep Quality Index
CAPS-r revised College Alcohol Problems Scale NWL Normal Weight Lean
1
CHAPTER I: INTRODUCTION
In 2010, overweight and obesity was estimated to have caused 3.4 million deaths 1
. The World Health Organization (WHO) defines obesity as having abnormal or excessive fat accumulation that puts one’s health at risk 2
. Being obese puts an individual at risk for numerous diseases such as diabetes and cardiovascular disease 2
. Along with the health consequences and increased burden on health, obesity carries a staggering economic cost burden of around 190 billion dollars per year in the United States 3
. Due to the large health and economic impact, earlier identification and more comprehensive classification of obesity are imperative. Body Mass Index (BMI) has been commonly used to categorize obesity in adult men and women. BMI uses weight and height to calculate whether an individual is underweight (<18.5 kg/m2), normal
weight (18.5-24.9 kg/m2
), overweight (25-29.9 kg/m2
), or obese (>30 kg/m2
)2
. The same categories are used across all adults regardless of age or sex. Although BMI is useful for evaluating obesity on a population level, it is not necessarily the most accurate measure of obesity. This index fails to consider body composition variables such as body fat percentage (BF%) and lean mass (LM), and has been shown to have false-negatives and underestimate obesity prevalence 4
. Certain groups of people, such as older women 4
2
as NWO are at a higher risk for certain diseases than individuals with lower body fat and normal BMI values 5
. Therefore, classification of NWO is particularly important to an individual’s overall health.
The prevalence of NWO has not been universally characterized; it is estimated that about 30 million adults in the United States could be affected by NWO 6
. Adults classified with NWO have been shown to be at risk for certain diseases like cardiovascular disease and metabolic syndrome 5–7
, despite being at a normal weight. Additionally, this population is at an increased risk of developing conditions associated with chronic disease like hypertension and insulin resistance 7
. As a result of NWO being a newer concept, further characterization of this population is needed. The progression of obesity is preventable, however the NWO population may never be identified as being at risk until other more chronic conditions develop. Due to the lack of consideration of body fat and lean mass in current obesity classification, NWO individuals are not usually identified during routine health exams. Broadening the understanding and prevalence of NWO may help transform the discussion of obesity in healthcare.
Previous studies on NWO have contained samples with a wide variation in age7
, and has not yet been studied exclusively in the young adult population. Individuals in this age group are surrounded by new environments and are creating new habits 8
. Therefore it is an ideal time to make lifestyle changes that may transform into lasting healthy behaviors. The National College Health Assessment surveyed over 90,000 US college students in 2015 and found that 35% of respondents were overweight or obese based upon self-reported height and weight 9
3
being formed. Additionally, most NWO studies have solely evaluated women 7
. Examining both men and women will help to further identify if there are risk factors more frequently associated with either sex. Furthermore, studying both sexes can be beneficial in establishing sex-specific prevalence and help tailor future preventative approaches. Due to the lack of characterization in this population, assessing the environmental and physiological factors of NWO young adults may be important in promoting positive outcomes in the future.
Purpose
1. The primary purpose of this study was to characterize normal weight obesity in young
adult men and women by quantifying body composition.
a. Body fat percentage, lean mass, and android/gynoid fat ratio was assessed. 2. The secondary purpose of this study was to determine if a sex-specific prevalence exists
among NWO young adults.
3. The tertiary purpose of this study was to evaluate the potential relationship between
NWO and common lifestyle factors.
a. Exercise, sleeping habits, living arrangements and stress level was evaluated
among individuals with NWO characteristics.
4. The quaternary purpose of this study was to examine the relationship between NWO and
common metabolic health parameters.
a. Fasting blood glucose, total cholesterol, high-density lipoproteins (HDL) and
4 Research Questions
1. How many young adults demonstrated characteristics of NWO in this sample? 2. Did characteristics of NWO occur more frequently among men or women? 3. What lifestyle factors are more related to NWO in young adults?
4. Do individuals categorized as NWO result in greater metabolic health risks?
Research Hypotheses
1. Based on recent literature, 10% of our sample of young adults will be characterized as
NWO.
a. Individuals classified as NWO will have higher body fat percentage, less lean
mass, a higher android/gynoid fat ratio than normal weight lean (NWL) individuals.
2. Characteristics of NWO will occur more frequently in young adult women compared to
young adult men.
3. Young adults that have lower levels of physical activity, higher levels of stress, and poor
sleeping habits will be associated with NWO.
4. Individuals categorized as NWO will have more at risk biomarker blood values compared
to normal weight lean individuals.
Delimitations
1. The study consisted of a single visit
5
4. Visceral adipose tissue (VAT) was measured with dual energy x-ray absorptiometry
(DEXA) and ultrasound (US)
5. Subjects cannot have a preexisting cardiometabolic disorder 6. Body composition was measured with DEXA
7. Insulin, glucose, triglycerides, total cholesterol and lipoproteins were measured from a
blood draw
Limitations
1. Recruited subjects were full time students at a nearby university; therefore the sampling
was not truly random.
2. There is not a universal definition of NWO.
a. Studies have used varying cutoffs for body fat percentage8
3. Visceral adipose tissue was measured with B-Mode ultrasound and DEXA, however
computed topography scans are currently the gold standard.
4. The study design only categorized NWO at a single point in time, and the examination of
possible risk factors over time cannot be determined.
Assumptions
Theoretical
6 Statistical
1. The population from which the sample was drawn displayed a normal distribution 2. The variability in the study sample was approximately equal (homogeneity of variance
assumption).
Definition of Terms
Android Fat- adipose tissue found around the upper body and trunk
Body Fat Percentage (BF%)- the amount of total fat mass divided by total body mass Body Mass (BM)- body weight (kg)11
Body Mass Index (BMI)- a weight and height ratio used to categorize overweight and obesity Fasting Blood Glucose (GLUC)- a blood test that measures glucose after a period of fasting (mg/dL)
Fat Mass (FM)- all extractable lipids that can be extracted from adipose and other tissues 11.
Gynoid Fat- adipose tissue found around the hips and thighs HDL- high density lipoproteins in the blood (mg/dL)
Hypertension- high blood pressure, with a systolic pressure 140 mmHg or higher and diastolic pressure of 90 mmHg or higher
Insulin- glucose regulating hormone (IU/mL)
Insulin Resistance- Fasting glucose levels of 100 to 125 mg/dL indicate prediabetes, and values at or above 6.5 mg/dL indicates diabetes
NLDL- non-high density lipoproteins in the blood, which contains triglycerides and low-density lipoproteins (mg/dL)
7
levels of ≥100mg/dL, triglycerides levels ≥150 mg/dL, HDL cholesterol <40mg/dL in men or <50mg/dL in women, and blood pressure of >130mmHg systolic or >85mmHg diastolic Normal Weight Lean (NWL)-individuals that have “normal weight” BMI, and have a healthy amount of body fat
Normal Weight Obesity (NWO)- individuals who have “normal weight” BMI, but have excessive accumulations of body fat
Obesity- having abnormal or excessive fat accumulation that puts one’s health at risk2
Total Body Volume (BV)- estimate of body size and density11
Total Body Water (TBW)- measure of the intracellular and extracellular fluid compartments of the body estimated using bioelectrical impedance spectroscopy11
Total Bone Mineral Density (Mo)- a measure of the bone mineral content of the body estimated using dual-energy x-ray absorptiometry11
Total Cholesterol (TC)- measure of all the cholesterol in the blood (mg/dL) Triglycerides (TRG)- measure of the fat in the blood (mg/dL)
Visceral Adipose Tissue (VAT)- Adipose tissue located in the abdominal cavity, often surrounding internal organs. It will be measured as the distance between the posterior rectus abdominis and posterior aortic wall.
Significance of Study
8
CHAPTER II: REVIEW OF LITERATURE
Introduction
Obesity is universally defined as having an abnormal or excessive accumulation of body fat that poses a risk for health 2. Obesity has been associated with cardiovascular disease,
diabetes and metabolic dysfunction 2
. The most common parameter used to classify obesity in individuals is Body Mass Index (BMI)2
. However, the accuracy of BMI is limited 10
. This index fails to differentiate between body fat percentage (BF%) and lean mass (LM). Individuals with high muscle mass, tend to be misclassified by BMI 11
. In addition, some people who are of normal weight, as calculated through BMI, have been shown to contain excess body fat, putting them in an ‘obese’ classification 5–7
. Individuals in this population have been recently defined as Normal Weight Obesity (NWO), a topic of recent interest within the scientific community. Despite a normal BMI, these individuals have been shown to be at risk for chronic disease 5–7
. Characterizing NWO may be important due to the potential prevalence of misdiagnoses or detection of disease risk factors in normal weight individuals. NWO has yet to be studied in the young adult college population, however young adults may be an important group of people to characterize NWO. They are in a time point in life where behaviors and lifestyle changes occur
8,12
. Additionally, less than half of college students fail to utilize health services provided to them during their collegiate careers13
9
physiological factors associated with each. An examination of obesity and lifestyle trends found specifically in the collegiate population will follow.
Obesity
Obesity is associated with an increased risk for numerous chronic diseases 2
. A meta- analysis by Guh et al. 14 identified 18 co-morbidities attributable to overweight and obesity.
Among them, diabetes mellitus (DM) and cardiovascular disease (CVD) were established as a relative risk related to being overweight and obese. It was found that adult obese men had at least 6 times the risk, with women having 12 times the risk of developing DM compared to non-obese individuals14
. While obese females were also found to carry twice the risk of developing hypertension, and three times the risk of developing coronary artery disease compared to a normal weight cohort 14
. Metabolic syndrome (MS) is a cluster of risk factors that also lead to increased risk of developing DM and CVD15
. Abdominal obesity has been shown to have the most established association to metabolic syndrome (MS)16–18
. While obese adults have been extensively studied in relation to chronic disease, more research is needed on young adults.
As research on obesity has expanded, various methods to measure and assess this issue have been utilized. Although BMI is the most common clinical tool used to measure obesity, other measures are often used in conjunction. Waist circumference and waist-to-hip ratios are used to measure abdominal obesity when radiological techniques are not available. Adult men who have waist circumferences greater than 40 inches (102 cm) and adult women with circumferences greater than 35 inches (88 cm) are found to be at greater risk for developing a cardiometabolic disease19
. In a meta-analysis by Vazquez et al. 20
10 predictors of the disease. In contrast, Lee et al. 21
found that the same combination of these variables is superior for identifying CVD risk in adults compared to BMI. These anthropometric measures can also estimate visceral adipose tissue (VAT)22–24
, but may be inaccurate24,25
. Computed topography (CT) scans allow quantification of VAT and are currently regarded as the gold standard 24
. In a study completed by Miyawaki et al. 26
using CT scans, it was found that cut off values of 100 cm2
in men and 65 cm2
for area of VAT in women significantly detected the prevalence of MS. Where CT scans are not feasible, dual energy x-ray absorptiometry (DEXA) and ultrasound (US) scans have been found to be reliable and reproducible methods to measure visceral adiposity 27–29
. While it is known that visceral fat storage leads to pathologies like insulin resistance and systemic inflammation 25
, there is currently a variety of ways to measure VAT, but no clear association established with overall body composition or other metabolic parameters.
The relationship between BMI and body composition has been evaluated in a number of studies demonstrating contrasting findings 4,10,20,21,30–36
. The index assumes a linear relationship between BMI and BF% and does not differ between age, ethnicity, or sex 33,34,37
. Data have shown that standard BMI cut off values have high specificity but low sensitivity on the individual level. About half of the individuals that are calculated as non-obese through BMI may contain an excess amount of body fat 30
. These outcomes are supported by Wellens et al. 31
who demonstrated that only 56% of the men and 48% of women in the sample were correctly identified as obese. Another study also reported current BMI obesity cut-off values to be too high for both men and women, not identifying a number of those with a body fat that was considered obese 10
. BMI was also inaccurate in the intermediate ranges10
. In addition, body composition differs among ethnic groups, and BMI does not reflect such disparities. Obesity rates among white and Hispanic women were found to be underestimated using BMI 33
11
between BMI and disease risk has also been evaluated. BMI has been shown to have a strong correlation with DM risk when compared with other anthropometric measures 20
however in a review by Lotta et al. 36
being classified as metabolically unhealthy was associated with higher relative risk of DM across all BMI categories. Data have also shown that BMI is weakly associated with CVD risk21
. Furthermore, a study by Zeng et al. 35
compared BF% and BMI to CVD risk factors and determined BF% as the stronger predictor. Although BMI is an easy and reproducible method to gather anthropometric data, it is not a significant predictor of adiposity or risk for certain obesity related-diseases.
Normal Weight Obesity
Normal Weight Obesity (NWO) has yet to be universally defined, however numerous studies have explored this concept. NWO is defined by a BMI in the normal range accompanied by an excess amount of body fat 5
. Due to the variability when defining NWO, including variability in a number of aspects including sex, ethnicity, age, and method of determination, the occurrence of NWO is not well established. In a recent study by Romero-Corral et al.6
, it was estimated that 30 million Americans are affected by NWO. Knowing that men and women differ in body composition and disease risk, other studies have a given sex-specific prevalence. Kim et al.38
found that in a sample of healthy Korean adults, 36% of men and 29% of women were NWO. This study was done using DEXA to gather body composition data, and percent body fat cut offs of ≥20.6% in men; ≥33.4% in women. In contrast, Marques-Vidal et al.39
established NWO was more prevalent in Swiss women than men, with 10% and 3.2% respectively. Bioelectrical impedance analysis (BIA) was utilized along with a standard body fat cut off of ≥30%. The rate of occurrence of NWO in young adults, a key time for behavior change, has yet
to be evaluated. Madeira et al. 40
12
reported occurrence rates of 9.2% and 9.0% of NWO in males and females, respectively. Initial data suggests the occurrence of NWO may increase with age7
. Identifying occurrence rates in a college population may allow for more effective obesity prevention strategies.
Obesity has been established as a condition with increased risk for certain diseases. NWO has been found to have similar associations; a normal BMI does not act as a protective factor 6
. In order to examine the relationship between the development of chronic disease and NWO, studies have looked at certain pathologies that precede or exist alongside specific diseases. Kang et al.40
and Madiera et al. 41
reported that NWO individuals had lower levels of high-density lipoproteins (HDL) and higher levels of triglycerides compared with those that had healthy amounts of body fat . Romero-Corral et al.6
supported these findings and also demonstrated NWO individuals had higher levels of low-density lipoproteins (LDL). Furthermore, NWO has been linked to increased risk for developing CVD 6,7,41,42
. One study reported that NWO was independently associated with the development of soft coronary plaques41
. Insulin resistance is also related to NWO. It has been found that NWO is significantly associated with insulin resistance and hyperglycemia, compared to those that are normal weight lean7
. NWO individuals are also at an increased risk for developing DM and MS7,40,43,44
. Due to the associations between NWO and chronic disease, characterization of NWO earlier in life is imperative and may aid in the prevention of disease development or slow the progression of a disease course.
Weight Gain and Obesity in College
Weight gain in college is a topic acknowledged both in the scientific community and in the public. The transition to college has been described as a critical time period for weight management behaviors to develop 45,46
13
fifteen pounds of weight college freshman gain. However, fifteen pounds has been identified as an overestimation in numerous studies. A meta-analysis by Vella-Zarb and Edgar47
disputed this belief and reported that college freshman gain around five pounds of weight. Weight gain does not just occur in the first year of college; the literature suggests that increases in weight can be observed throughout an entire undergraduate career48,49
, yet details of weight gain in the latter years is not well characterized. Racette et al.49
reported that, although weight gain was variable, the prevalence of overweight and obese students was 15% freshman year and significantly increased to 23% senior year. Although weight does not differentiate between fat and lean mass, Gropper et al.50
reported that the proportion of weight gained throughout a college career was largely fat. Much is left to be determined regarding what type of weight is gained over a single freshman year, as well as other consecutive years throughout college.
Obesity is observed among individuals of all ages, ethnic, and socioeconomic groups, including the college-aged population2
. The occurrence of obesity and obesity related disorders, such as hypertension and dyslipidemia, have significantly increased throughout the last decade, particularly in teenagers and young adults51
. However, the occurrence rates of obesity among college students have varied. Certain studies have assessed obesity solely through BMI. Lowry et al.52
found that, using self reported height and weight, 11.4% of undergraduate students were overweight or obese. Another study by Huang et al.53
established 4.9% of their sample was obese. Few studies have examined obesity in college students through methods other than BMI. Using BIA, Al-Rethaiaa et al.54
reported that 15.7% of their sample had a BF% ≥ 25%. Body fat was found to be excessive in 30.7% of those with a normal BMI. Along with the occurrence of obesity in these students, MS has also been observed. In a sample of 2,103 college students, Morrell et al.55
14
the students (77% of men, 54% of women) displayed at least one criterion of MS. As a result of the relationship between MS and a number of chronic diseases, a proportion of college students may be at risk for developing these diseases later in life15,55
. More consistent research in college students to help identify the occurrence of these risk factors, as well as actual measurements of body composition, can further help to understand the obesity epidemic and potential treatments.
Lifestyle Patterns
Although obesity has both genetic and lifestyle contributions, due to the innate aspect of genetics, much of the research on obesity is focused on lifestyle. Specifically, diet and exercise are two primary lifestyle factors heavily evaluated 56,57
. There is a vast amount of dietary intake data and obesity with some data suggesting high fat and sugar intake are associated with an obese BMI and high amounts of BF 58–61
. Conversely, other studies have shown an association between high fat/high protein diets, such as the Atkins Diet, with better weight loss and lower body fat outcomes. In a study by Dansinger et al.62
, individuals demonstrated a reduction in weight on the Atkins diet, however results were largely dependent on high diet adherence. The amount of food that is consumed is also associated with obesity. Increased food intake has been reported to be associated with the obesity prevalence63,64
, while caloric restriction has also been associated with more weight gain65,66
. Another component of lifestyle that has been linked to obesity is physical activity, or lack thereof. A sedentary lifestyle has been associated with weight gain and positive energy balance61,67
. This is evidenced in the findings of Bouchard et al.68
, where a negative association was observed between physical activity level and body fat. However these conclusions are contradictory, with other studies showing a weak relationship between these two variables or significant correlations in only part of the sample (i.e. with men or women)69–71
. Sleep can also factor into obesity. In a meta analysis by Cappuccio et al.72
15
was associated with increased risk for obesity in adults. Insufficient sleep can also negatively affect the body fat loss one may see when adopting a healthy diet73
. Additionally, stress can influence obesity, specifically adiposity. Psychosocial stress has been reported to be positively associated with adiposity, however these results differed by sex, with stronger associations found in men74
. It is clear that obesity is a multifaceted issue where many environmental factors can have an influence. Due to the overlapping elements, there is the challenge of drawing independent associations.
College students are at a pivotal time in their lives where independence is established and lifelong lifestyle choices and health behaviors may develop8,9,12
. Overall, evidence suggests that college students consume low quality dietary intake and are physically inactive49,53,75–81
. A meta-analysis by Keating et al.81
reported that 30-50% of college students do not meet minimum physical activity guidelines, regardless of class year. In terms of diet, Racette et al.49
reported that over two thirds of the students sampled did not consume the recommended servings of fruits and vegetables. Both inadequate diet and inactivity are related to weight gain53,75–80
. Poor sleep quality in college students has also been found to be significantly associated with overweight and obesity82,83
, while high levels of stress have been linked to increased risk for weight gain84
. In addition, college students participate in risky behaviors such as binge drinking, which is significantly associated to other adverse habits, such as sedentary behavior and unhealthy dietary patterns, such as disordered eating 75,85,86. A study by Nelson et al.87 (2009) sampled college
students from each undergraduate class at a four-year university, and found that one in three students reported binge drinking in the past week. Additionally, alcohol related eating was associated with a 25% increase in weight status, more specifically alcohol consumption has been significantly associated with VAT accumulation and psychosocial stress 88,89
16
students may grow out of these lifestyle habits, many continue to maintain this behavior post college74
. These lifestyle patterns have the potential to cause detrimental pathologies and diseases, which may persist after college into adulthood, influencing lifelong habits.
It is important to have valid measures of lifestyle habits in order to properly understand possible associations to health. Because exercise patterns can greatly influence body composition and disease development90
, physical activity questionnaires can be a useful tool. There are currently several well-known and valid physical activity questionnaires in the literature. The International Physical Activity Questionnaire (IPAQ) has been shown to be consistently valid and reliable in a wide array of populations 91
. The IPAQ has been specifically examined in individuals 18-23 years old and found to be a reliable measure for physical activity 92
. In addition, stress can have a large impact on health and weight 89
. The perceived stress scale (PSS) is a fourteen-item questionnaire that has been found to be a valid measure of stress in many different populations, including two samples of college students 96
. The PSS can help identify the relationship between specific stressors and characteristics of NWO. Sleep is another important variable to evaluate in college students. The Pittsburgh Sleep Quality Index (PSQI) has been studied as a suitable measure to indicate whether an individual is a poor or good sleeper 97
. Since it has also been suggested that students participate in risky behaviors that are harmful to health, such as binge drinking, a questionnaire evaluating such activities would be useful 74
. The revised College Alcohol Problems Scale (CAPS-r) is a validated questionnaire that was developed to evaluate alcohol consumption in college students 98,99
. Although there is not a validated survey to assess all influential environmental factors such as living arrangements, it is still important to evaluate in this population, as there have been differences in diet and physical activity levels between those living on and off campus100
17
the subjects are being truthful in their reporting, they are a quick and easy method to obtain information from a sample.
Conclusion
NWO is a concern that may affect around 30 million Americans 6
. NWO individuals have a normal BMI and are often unaware of the health issues they may be at risk for that occur with a high BF%, like increased risk for CVD, DM, and MS 5–7,38–42,44
. There is a wide range of available methods to characterize NWO, and it is important to use valid and reliable tools that evaluate true compartments of the body, specifically fat mass, lean mass, and visceral fat. Due to BMI being limited in its ability to evaluate body composition6
, other measures offer a more accurate assessment such as DEXA and US 27–29
.
Although study methodologies differ, NWO has been found to occur in adult men and women6,7,38–40, while the occurrence in college students has yet to be determined. However,
components of NWO have been reported in the college population such as obesity and high BF%2,47–54
, as well as behaviors that are associated with increased body fat, like disordered eating, poor sleep quality, high stress, and lack of physical activity 49,53,75–89,101
. Obese adults have been found to share many of the aforementioned lifestyle characteristics as those often learned during college56–64,66–74, therefore making college students a critical population to evaluate. A
18
CHAPTER III: METHODOLOGY
Participants
Male and female volunteers between the ages of 18 and 23 years were recruited. Subjects were enrolled full-time in a college or university in the Chapel Hill, Durham, Carrboro or Raleigh area. Based on previous literature with a similar population41
a sample of 22 subjects per group [NWO and NWL] was determined. BF% means for NWL and NWO were 24.1± 4.5% and 30.1 ± 3.3 %, respectively. This calculated an effect size of 1.52. The sample size was based off of a power of at least 80% for an independent t-test with significance of α = 0.05. Power calculations were made with G*Power version 3.1.
For inclusion, subjects had a normal body mass index (BMI) between 18.5–24.9 kg/m2
. Subjects were required to be healthy, with no surgical or medical history that may influence the results of this study, including renal, hepatic, musculoskeletal, or pre-existing cardiometabolic disorders. For exclusion, subjects were also not be allowed to participate in the study if they had lost or gained 10 pounds three months prior to enrollment, or had a self-identified eating
disorder.
Experimental Design
19
correspondence. Potential subjects were sent a copy of the consent form to review prior to enrollment. Upon arrival, written consent was provided as well as completion of a series of questionnaires to screen for inclusion/exclusion criteria as well as evaluate physical activity and lifestyle habits. Subjects were advised to arrive at the lab following an eight hour fast, but remaining hydrated. Once deemed eligible, enrolled subjects first completed the anthropometric measures of weight (kg), height (cm), waist circumference (cm), and hip circumference (cm). Next, subjects completed a four compartment (4C) comprehensive assessment of body composition using measurements from dual-energy X-ray absorptiometry (DEXA) and bioelectrical impedance spectroscopy (BIS). Following body composition testing, visceral adipose tissue (VAT) was measured using ultrasound (US). Lastly, an individual trained in phlebotomy took a fasted blood sample and blood pressure was measured.
Body Composition
20
Bioelectrical impendence spectroscopy (BIS, ImpediMed, Queensland, Australia) was used to calculate total body water (TBW). After the subject information was entered in the device, the individual was positioned. The subject lied supine on a table for five minutes, with their arms and legs spaced slightly apart. Four electrodes were placed on their right-side wrist and ankle. Prior to electrode placement, the four areas were be sterilized. The first lead was connected to an electrode attached between the radius and ulna of the right wrist. The next lead was attached to an electrode located five centimeters from the placement of the electrode on the wrist, distally on the right hand. The third electrode was at the lead located in the middle of the medial and lateral malleoli of the right ankle. The last lead was fixed to the electrode five centimeters from the placement of the electrode on the ankle, distally on the right foot. The cables connected to the device were not touching the floor or any metal objects. The subject was instructed to limit movement during the test. The test was done twice, with the average of both measurements recorded for TBW.
Visceral Adipose Tissue
Brightness-mode (B-mode) ultrasound (US) (GE LOGIQ-e, Software version R8.0.7, GE Healthcare, Wisconsin, USA) with standardized settings (Frequency: 4.0 MHz, Gain: 45) was used to examine visceral adipose tissue (VATUS). The subject information was entered into the
21
researcher. Visceral adipose tissue was described as the distance between the posterior rectus abdominis and posterior aortic wall. The average of the two measurements were recorded. Test-retest reliability of VATUS from our lab produced an intraclass correlation coefficient
(ICC)=0.99, standard error of measurement (SEM)=0.35 cm, and minimum difference (MD)=0.69 cm.
DEXA was also used to examine visceral adipose tissue (VATDEXA). The DEXA software
has preselected the android region of the body scan. It measures abdominal fat from the top of the iliac crest and a height set to 20% of the distance from the top of the iliac crest to the base of the skull3
.
Cardiometabolic Biomarker Analysis
All blood draws were done in the Applied Physiology Laboratory by an individual trained in phlebotomy and blood borne pathogens. Total cholesterol (TC), high-density lipoproteins (HDL), non-high density lipoproteins (NHDL), fasting blood glucose (GLUC), triglycerides (TRG), and insulin were analyzed by collecting 4 ml of blood from the anticubital vein of the subject. Heparin tubes were used to prevent clotting. Samples were analyzed immediately following the draw using an Alere Cholestech LDX® Analyzer. Forty microliters
were pipetted from the whole blood sample onto a disposable cassette and inserted into the machine for analysis. The analysis took seven minutes. Blood pressure was measured in a seated position with a standard automated blood pressure cuff (The Omron 5 Series Upper Arm Blood
22 Questionnaires
Following enrollment, the participants completed a series of self-administered questionnaires about their lifestyle. The International Physical Activity Questionnaire (IPAQ) is a 27-item survey and was used to gather data on physical activity from the past seven days. The perceived stress scale (PSS) is a fourteen-item questionnaire that evaluated stress. The Pittsburgh Sleep Quality Index (PSQI) indicated whether an individual is a poor or good sleeper, and the revised College Alcohol Problems Scale (CAPS-r) evaluated alcohol consumption. All of these questionnaires have been validated, many in the college aged population 63, 64, 107, 108, 111, 112
. In addition, participants were asked about their living arrangements.
Statistical Analysis
23
CHAPTER IV: MANUSCRIPT
Introduction
In 2010, overweight and obesity was estimated to have caused 3.4 million deaths1
. The World Health Organization (WHO) defines obesity as having abnormal or excessive fat accumulation that puts one’s health at risk2
. Being obese puts an individual at risk for numerous diseases such as diabetes and cardiovascular disease2
. Along with the health consequences and increased burden on health, obesity carries a staggering economic burden of around 190 billion dollars per year in the United States3
. Due to the large health and economic impact, earlier identification and more comprehensive classification of obesity are imperative.
Body Mass Index (BMI) is commonly used to categorize obesity, especially in a healthcare setting. BMI uses weight and height to calculate whether an individual is underweight (<18.5 kg/m2
), normal weight (18.5-24.9 kg/m2
), overweight (25-29.9 kg/m2
) or obese (>30 kg/m2
)2
. The same categories are used across all adults, regardless of age or sex. Although BMI is useful for evaluating obesity on a population level, it is not necessarily the most accurate measure of obesity. This index fails to consider body composition variables such as body fat percentage (BF%) and lean mass (LM), and has been shown to have false-negatives and underestimate obesity prevalence4
24
circumferences greater than 35 inches (88 cm) are found to be at greater risk for developing a cardiometabolic disease19
. These anthropometric measures can also estimate visceral adipose tissue (VAT)22–24
, but may be inaccurate24,25
. Computed topography (CT) scans allow quantification of VAT and are currently regarded as the gold standard24
, but where CT scans are not feasible, dual energy x-ray absorptiometry (DEXA) and ultrasound (US) scans have been found to be reliable and reproducible methods to measure visceral adiposity 27–29
.
In 1981, Ruderman et al.17
introduced a new subset of obese individuals, those that are characterized by a “normal weight” defined by BMI, but have an unhealthy amount of body fat. Initial data have suggested that those classified as normal weight obese (NWO) are at a higher risk for certain diseases than individuals with lower body fat and normal BMI values6
. Identification of NWO may be particularly important for recognizing individuals at risk for obesity-related diseases. Although numerous studies have been published since this early characterization of NWO, no universal consensus on how to define NWO exists. Previous studies on NWO have contained samples with a wide variation in age (23 years-79 years), with varying methodology and body fat cut offs used to define NWO6,7,39,41,102,103
. Specifically, Madeira et al.40
characterized a sample of young adults 23-25 years old, using BF% cut offs of 23.1% in males add 33.3% in females. They reported occurrence rates of 9.2% and 9.0% of NWO in males and females, respectively, along with lower LM and higher blood glucose levels in those that are NWO compared to normal weight lean (NWL). To our knowledge, this is the youngest population characterized to date. Based on the life-long habits that develop during college, as well as environmental influences9
, exploring NWO among a younger college-aged population may be essential in understanding and preventing obesity that develops in early adulthood52
25
found that 35% of respondents were overweight or obese based upon self-reported height and weight9
. This is a population where over a quarter of individuals may be at risk for developing obesity-related illnesses in the future52
. Characterizing NWO in young adults will allow trends to be discovered and may aid in the development of a prevention strategy during a time when lifelong habits are being formed. Therefore, the aim of the present study was to characterize NWO in college-aged men and women, which included determining the occurrence rates along with measures of body composition, cardiometabolic markers, and lifestyle questionnaires. We hypothesized that 10% of our sample would be categorized as NWO, with a higher occurrence rate in females. NWO individuals would have a higher BF%, less LM, and a higher android/gynoid fat ratio. We also believed they would have lower levels of physical activity, higher levels of stress, and more disordered sleeping patterns. Lastly, we hypothesized NWO individuals would have more at risk cardiometabolic biomarker values.
Materials and Methods
Participants
Following CONSORT guidelines (Figure 1), approximately 194 individuals provided initial interest in study participation. Using electronic correspondence, 69 individuals were disqualified due to current exercise regimen (exercising 6 or more days per week), BMI, and student status (i.e. graduate student). Ninety-seven individuals came into the laboratory for the enrollment visit; three participants were excluded due to BMI being outside of the range. This resulted in a total of 94 enrolled males (n=30) and females (n=63) between the ages of 18 and 25 years (mean ± standard deviation [SD]; 19.6 ± 1.5 years) with a BMI between 18.5 to 24.9 kg/m2
(21.9 ± 1.6 kg/m2
26
juniors, and 21 seniors. They were also all healthy, with no surgical or medical history that may have influenced the results of this study, including renal, hepatic, musculoskeletal, or pre-existing cardiometabolic disorders. For exclusion, participants were also not permitted to participate if they had lost or gained 10 pounds three months prior to enrollment, or had a self-identified eating disorder. All females were premenopausal and completed a pregnancy test once they were enrolled.
Experimental Design
This study was a cross sectional experimental design that consisted of a single visit which encompassed both enrollment and testing periods. Participants were asked to follow pretesting guidelines which included an 8 hour fast, but to remain hydrated.. Upon arrival, written consent was provided followed by the completion of a series of questionnaires to screen for inclusion/exclusion criteria as well as evaluate physical activity and lifestyle habits. Participants completed a series of assessments including anthropometrics, body composition, and lifestyle questionnaires. Body composition was assessed using dual-energy X-ray absorptiometry (DEXA) and bioelectrical impedance spectroscopy (BIS); visceral adipose tissue (VAT) was measured from ultrasound. Lastly, a blood draw was taken to evaluate glucose and lipid values. All procedures were approved by the University’s Biomedical Institutional Review Board.
Anthropometric Measures
For weight and height, participants removed their shoes prior to the measurements.
Weight was measured to the nearest 0.01 kg with an electronic load scale (Health-o-meter,
McCook, Illinois, USA). Height was measured to the nearest 0.1 cm; participants were placed with their feet flat against the ground, and their heels and back against a fixed stadiometer
27
calculate BMI (kg/m2
) to ensure participants fell within the normal weight range (18.5-24.9
kg/m2
). Next, waist and hip circumference was measured, with the same research technician
measuring all participants. A retractable measuring tape was positioned at the smallest point of
the waist just superior to the iliac crest for waist measurement, and at the greatest circumference
of the buttocks for the hip circumference. The measuring tape was placed tight against the skin
but not constricting. Participants were asked to cease movement and limit breathing during the
measurement. Each circumference measurement was made to the nearest 0.1 cm, taken twice,
and then averaged. The averaged value of each circumference was used to calculate waist to hip
ratio (WHR).
Body Composition
FM, LM, trunk fat and BF% were estimated using dual-energy x-ray absorptiometry (GE Lunar iDXA, GE Medical Systems Ultrasound and Primary Care Diagnostics, Madison, WI, USA). Trained DEXA technicians performed the full body scans. Participants removed all metal jewelry prior to the scan, laid supine in the center of the DEXA table, with all limbs adjusted to fit inside the scanning area, and a velcro strap placed around the ankles to hold the legs and hips in position. The participant was instructed to limit all movement during the 7-13 minute scan.
28
Measurements were taken in duplicate, with the average recorded as TBW.
Visceral Adipose Tissue
Brightness-mode (B-mode) ultrasound (US) (GE LOGIQ-e, Software version R8.0.7, GE Healthcare, Wisconsin, USA) with standardized settings (Frequency: 4.0 MHz, Gain: 45) was used to examine visceral adipose tissue (VAT). The participant was asked to lie supine on a table. Gel was applied to a wide band convex array ultrasound transducer (GE: C1-5 R) and placed horizontally on the abdomen at the linea alba, two centimeters above the umbilicus. Pressure on the abdomen from the transducer was kept constant to prevent distortion. Once the transducer was in a position that displayed a clear image, the subject was instructed to take a normal breath in and exhale all of the air out of the lungs. The image was captured after complete expiration. Visceral adipose tissue was measured as the distance between the posterior rectus abdominis at the linea alba to the posterior aortic wall (Figure 2) 27,106. The average of the
two measurements were recorded. Test-retest reliability of VAT from our lab previously produced an intraclass correlation coefficient (ICC)=0.99, standard error of measurement (SEM)=0.35 cm, and minimum difference (MD)=0.69 cm.
Cardiometabolic Measures
Total cholesterol (TC), high-density lipoproteins (HDL), and non high-density lipoproteins (NHDL) were analyzed by collecting 4 ml of blood from the anticubital vein. Heparin tubes were used to prevent clotting. Samples were analyzed within five minutes following the draw using an Alere Cholestech LDX®
Analyzer, following manufacturer guidelines. Forty microliters were pipetted from the whole blood sample onto a disposable cassette and inserted into the machine for analysis.
29
pressure cuff (The Omron 5 Series Upper Arm Blood Pressure Model BP742); the average of 2
measurements was taken.
Questionnaires
A series of self-administered questionnaires were completed to determine lifestyle characteristics. The International Physical Activity Questionnaire (IPAQ), a 27-item survey, was used to gather data on physical activity from the past seven days; The IPAQ had several scored physical activity (PA) categories including minutes spent sitting, walking metabolic equivalent task score (METS), moderate METS, vigorous METS, or total PA METS. The perceived stress scale (PSS) evaluated stress with 14 items. The Pittsburgh Sleep Quality Index (PSQI) evaluated sleep habits, and the revised College Alcohol Problems Scale (CAPS-r) evaluated alcohol consumption; all were Likert scales. All of these questionnaires have previously been validated, many in the college aged population63,64,96,97,99. In addition, participants were asked about their
living arrangements: do they live on or off campus, how long they have lived at their current residence, and number of roommates.
Statistical Analysis
Due to a lack of universal NWO classification, different cut offs were used to categorize participants as NWO. Previously published NHANES cutoffs at the 25th and 50th body fat
percentiles104
, respectively, when stratified by age and sex were used; as well as cutoffs established by Heo et al.105
(Table 1). In females, sample cohorts for both the 50th
and Heo et al. cutoffs consisted of the same subjects.
30
relation between NWO/NWL and the PSQI, as well as to look at the relationship between NWO/NWL and living arrangements. Analyses were performed with SPSS software (Version 24, IBM, Armonk, NY, USA) and a value of p < 0.05 was considered significant.
Results
From the total sample of 94 participants evaluated, using the NHANES 25th
percentile 39.4% were classified as NWO; when implementing cutoffs from NHANES 50th
percentile and Heo et al., 12.8%, and 13.8% were classified as NWO, respectively. Sex specific NWO occurrence is presented in Figure 3. Males were shown to have a higher occurrence of NWO than females, across all cutoffs. Descriptive values for the sample are shown in Table 2. BMI was significantly different in NWO compared to NWL in both the total sample (p<0.001) and all female groups (p=0.000-0.006). However BMI did not differ between NWO and NWL males (p=0.074-0.478).
Body Composition
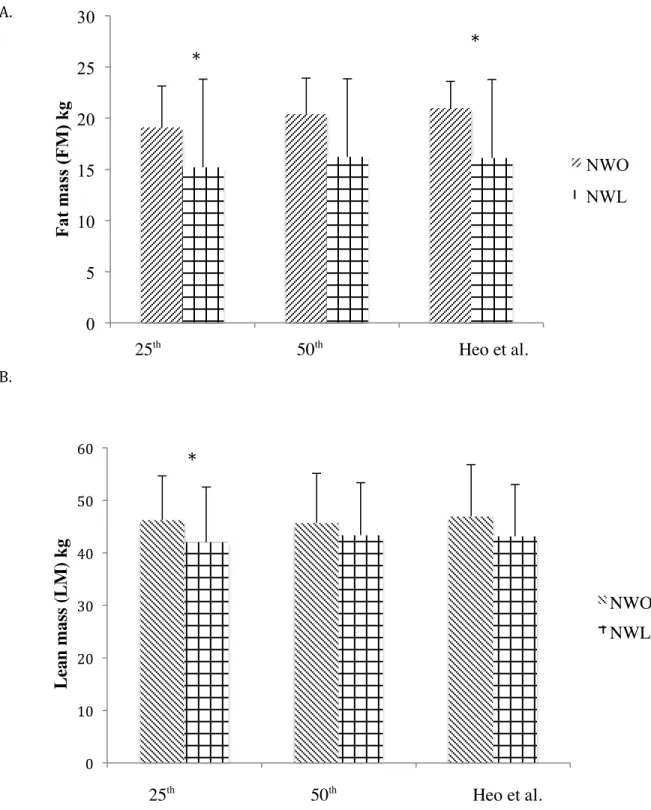
There was significantly more FM in the total NWO NHANES 25th
percentile (p=0.011) and Heo et al. groups (p=0.024) compared to the NWL (MD: 3.91 ± 3.02 kg; and 4.96 ± 4.30 kg, respectively). However FM was not significantly different between the NWO NHANES 50th
percentile and NWL groups (MD: 4.24 ± 4.48 kg, p=0.063). With the total NWO 25th
NHANES percentile cutoff, NWO had significantly more LM than NWL (MD: 4.14 ± 4.10 kg; p=0.047), yet no significant differences were seen in the NHANES 50th
percentile (MD: 2.33 ± 6.12 kg, p=0.447) or Heo et al. groups (MD: 3.80 ± 5.88 kg, p=0.200). FM and LM values for the total sample are displayed in Figure 4. There was significantly more trunk fat in NWO (25th
: 7.77 ± 2.25kg, 50th
31
significantly (p<0.001) larger in the total NWO sample for 25th
(3.96 ± 0.90 cm), 50th
(4.24 ± 1.96 cm), and Heo et al (4.28 ± 1.10 cm) compared to NWL (3.39 ± 0.99 cm; 3.53 ±0.94 cm; 3.51 ± 0.94 cm, respectively). WHR was also found to be significantly (p<0.001) larger in the total sample (25th
: 0.76 ± 0.40cm; 50th
: 0.78 ± 0.41cm; Heo et al: 0.77 ± 0.44 cm) compared to the NWL (25th
: 0.72 ± 0.40cm; 50th
: 0.73± 0.40; Heo et al.: 0.73 ± 0.41cm).
Each male NWO group, 25th
percentile, 50th
percentile, and Heo et al, displayed significantly larger FM than NWL (MD: 4.5 ± 2.6 kg; 5.1 ± 3.0 kg, p=0.000-0.002, respectively). There were no significant differences in LM between any cutoff groups (p=0.261-0.661). Trunk fat was significantly larger in all male NWO cohorts compared to NWL (MD: 25th
: 2.22 ± 1.76 kg; 50th: 2.41 ± 2.06 kg; Heo et al: 4.37 ± 1.38 kg, p=0.000-0.027). Both VATUS and WHR were
not significantly different between NWO and NWL males (p=0.139-0.846; p=0.082-0.525).
When evaluating the female cohort, NHANES 25th
percentile cutoff exhibited significantly more FM than NWL (MD: 21.82 ± 1.95 kg, p=0.011); there were no significant differences in FM between any other female cutoff groups (0.124). LM was not significantly different in any group (p=0.410-0.454). Trunk fat was significantly higher in all female NWO (8.70-9.66 ± 1.03-1.30 kg, p<0.001) groups compared to NWL (5.22-5.94 ± 1.30-1.70 kg). With the 25th
NHANES percentile cutoff, NWO females had a significantly higher VATUS (3.89 ± 0.72
cm, p= 0.008) compared to NWL (3.25 ± 0.93 cm), however this was not seen the NHANES 50th
percentile or Heo et al. female groups (p=0.297). WHR was significantly larger in each female NWO cohort compared to NWL, with results presented in Table 3 (p=0.006-0.023).
32
In the total NWO sample, cardiometabolic biomarkers and BP were not significantly different between NWO and NWL groups, across all cutoffs (p=0.354-0.943; p=0.092-0.905). In females, there was no significant difference between cardiometabolic biomarkers in the NWO and NWL groups, nor was there a difference in BP (p=0.361-0.962; p=0.165-0.697). NWO males also did not exhibit a significant difference compared to NWL in biomarkers or BP (p=0.122-0.696; p=0.232-0.911). Cardiometabolic health results are displayed in Table 4.
Questionnaires
There was no significant difference between NWO and NWL in the 25th
and 50th
NHANES cut offs with any IPAQ component (p= 0.065-0.887). In the Heo et al. cut off, NWO was found to have significantly less vigorous METS (587.69 ± 823.87 METS) than NWL (1292.84 ± 1188.40 METS, p=0.043), yet no other IPAQ component was found to be significant (p= 0.247-0.854). PSS scores did not significantly differ between NWO and NWL (p=0.052-0.814). There were significantly lower scores on the CAPS-r in the NWO cohort in the 25th
percentile (8.57 ± 1.55 pts), and Heo et al. groups (8.07 ± 0.28 pts) than the NWL (25th
: 10.17 ± 3.51 pts, p=0.11; Heoet al.: 9.77 ± 3.16 pts, p<0.001). There was no significance between groups with PSQI scores (p=0.386-0.943). With living arrangements, NWO were more likely to live on campus than NWL in the 25th
percentile ( X2
(1, N=94) =7.865, p=0.005), but no significance was found in the 50th
and Heo et al. groups (p=0.132-0.290). In all cutoffs, NWO had significantly fewer roommates (25th
: 1.2 ± 0.6 roommates; 50th
33
When evaluating the male cohort, there was no significant difference with any IPAQ component in the 25th
and 50th
NHANES cutoffs (p=0.125-0.791). However, in the Heo et al. group, NWO males were found to have significantly lower total physical activity METS and vigorous METS (Total: 1933.6 ± 1230.8 METS, vigorous: 435.0 ± 528.7 METS) than NWL (3871.1 ± 1777.0 METS, p=0.008; 1246.4 ± 1089.7 METS, p= 0.013). In addition, those that were NWO were found to have significantly more minutes of weekday sitting (457.5 ± 205.8 minutes) than NWL (326.1 ± 117.9 minutes, p= 0.037). In the Heo et al. cutoff, no other IPAQ component was found to be significant (p=0.391-0.487). Scores on the PSS and CAPS-R did not significantly differ between NWO and NWL, seen across all cutoffs (p=0.326-0.993). NWO and NWL did not significantly differ on the PSQI, regardless of the cutoff used (p=0.883-0.918). There were no significant differences between NWO and NWL in any living arrangement component (p=0.119-0.913).
In the female group, NWO were found to have significantly more walking METS (3283.5 ± 1684.6 METS) than the NWL cohort in both the 50th
percentile and Heo et al. cut offs (p=0.023). No other IPAQ component was found significant in any cutoff (p=0.163-0.833). With the PSS, NWO females were found to have significantly lower scores (10.9 ± 5.4 pts) than NWL (14.6 ± 6.4 pts, p=0.032) in the 25th
percentile; no other cutoff exhibited significant findings (p=0.533-0.538). Lastly, in all cutoffs, those that were NWO had lower scores on the CAPS-r (25th: 8.7 ± 1.5 pts; 50th: 8.2 ± 0.4; Heo et al.: 8.2 ± 0.4) than NWL (14.6 ± 6.4; 10.1 ± 3.3; 10.1 ±
3.3) p=0.000-0.009). Scores on the PSQI did not significantly differ between NWO and NWL in any group (p= 0.113-0.952). In all cutoffs, NWO females were found to have significantly fewer roommates (25th
: 1.3 ± 0.7 roommates; 50th
34
1.4 roommates, p= 0.048). NWO and NWL females did not differ with any other living component (p=0.068-0.545).
Discussion
The present study aimed to characterize the prevalence and demographics of NWO in college aged men and women. Due to the lack of universal classification of NWO in the current literature, this study explored characteristics based on three different published cutoffs, including NHANES 25th
percentile and 50th
percentiles1
,and those previously published by Heo et al.2
. In the present study, the rate of NWO was found to be relatively high, with 17-37% of the sample characterized as obese, despite having a normal BMI. In contrast with our hypothesis, males in the current sample had higher rates of NWO (23-60%), compared to females (8-30%). When characterizing the total sample, all three cutoffs displayed NWO as having more trunk fat, visceral fat, and a higher WHR compared to NWL. Two of the three cutoffs (25th
and Heo et al.) showed NWO as having significantly more FM than NWL. When stratified for sex, results were similar with significant difference in FM and trunk fat/visceral fat between NWO and NWL. Significant lifestyle factors between NWO and NWL cohorts were attributed to living conditions, with on campus housing and fewer roommates appearing as significant factors. Additionally, less vigorous physical activity was a significant factor for NWO compared to NWL. This study supports the notion that NWO exists in a collegiate population, and that characteristics may differ between men and women.
Only one previous study has evaluated NWO rates in a similar population, using skinfold thickness, reporting a 9.2% occurrence in men and 9.0% rate in women40, utilizing cutoff values
of 23.1% and 33.3% respectively. In the present study, total NWO occurrence rates ranged from 17-37%, demonstrating slightly higher rates in comparison to previous data (9.1%)40
35
in the occurrences may be due to several factors; the study most similar to ours40
used skinfold thickness to measure body fat, and also looked at a Brazilian population, which may have different environmental considerations. In comparison to previous studies in older populations (20-79 yrs) with varied demographics and methodology, rates of NWO were similar. Body composition data assessed from BIA in Korean adults aged 30-49 years old, and found an occurrence of 12.9%.102
Classifications determined by DEXA, reported occurrences of 33.7% in a Polish sample 20-79 years old,107
and 19-32% in a Canadian group 20-29 years old.108
Several studies examined just females, however to our knowledge only study evaluated occurrence, reporting a 33.4% of NWO women over the age of 20 yrs. In contrast to previous findings suggesting NWO is more prevalent in women, the present study found that NWO had a higher occurrence in males; the occurrence in females spanned from 8-30%, and the males ranged from 23-60%. These findings suggest that in a college-aged population, NWO may be a bigger concern in men, compared to women. Additional consideration should be given to BMI; in the present sample NWO and NWL exhibited significantly different BMI values in the female cohort, and no differences in the male cohort, despite higher rates of NWO in men. These results support the need for other tools, or updated BMI ranges, to capture obesity among a young adult population.
Body Composition
In the present cohort of young adults, NWO individuals demonstrated greater FM, significantly more LM in one cut off (25th
), and greater trunk fat, VATus and WHR compared to NWL. Several studies have supported our findings of FM, trunk fat, VATUS, and WHR in various
populations; however studies have varied widely with their results of NWO and LM12,15,18
. One previous study, also using DEXA, reported greater FM mean differences (7.9 ± 1.0 kg)107
36 compared to 3.91 ± 3.02 (25th
) and 4.96 ± 4.30 (Heo et al.) in the present study. On the other hand, a study that employed BIA found a similar FM mean difference of 4.4 ± 2.0 kg41
.Studies have varied on their findings of LM, with one study reporting no significant differences between their NWO and NWL sample, and another reporting NWO as having significantly less41,107
. To our knowledge, trunk fat has only been reported in one previous study,107
reporting greater mass in NWO (2.0 ± 0.4 kg) compared to NWL (1.1 ± 0.4 kg). Results of the present study agree, demonstrating more trunk fat in the NWO cohort (7.77-9.43 kg ± 1.47-2.50 kg) compared to NWL (5.08-5.77 ± 1.30-1.87 kg). Additionally, VAT and WHR have also been shown to be significantly greater in NWO adults38,41,107
. Specific to males and females in the present study, NWO males had significantly higher FM and trunk fat, with no differences in LM, compared to NWL males; these results were significant across all cut offs. In contrast to results seen in several studies,38,40,41,107 there were no differences in WHR between NWO and NWL males in the
present study. Similar differences in FM have been reported from two previous studies (average MD: 5.15 ± 1.2 kg) compared to the current study (Average MD: 4.5-5.1 ± 2.6-3.0 kg). LM results are generally in line with the present study, demonstrating no differences between cohorts41
. The NWO females in this sample displayed no significant differences in LM, while there was significantly more trunk fat and higher WHR across all three cut offs. Collectively, previous data has shown similar findings for trunk fat, with NWO females demonstrating higher levels. WHR data is mixed with some reporting higher ratios in NWO,38–40
with others showing no difference103,109
37 significantly lower in NWO cohorts;6,40
these discrepancies are likely related to the younger age studied in the present population.
Cardiometabolic Health
In the present study there were no significant differences between any cardiometabolic variable and total sample of NWO/NWL. This data contrasts the majority of available data. Specifically, Madeira et al., 40
who sampled a population similar in age to our study, found that their NWO sample had significantly higher blood glucose than NWL, with several studies supporting these findings38,41,102
. While our study did not find any difference in lipoproteins between groups, previous studies report that their NWO sample had significantly higher TC and lower HDL than NWL38,41,102,107
. Additionally, numerous studies have reported systolic BP to be significantly higher in NWO individuals compared to NWL39,41,102,108
. In the present study there were also no cardiometabolic differences in our sex specific NWO and NWL cohorts. Conversely, studies have found that their male40
and female109
NWO groups had significantly lower HDL than NWL. Lastly, one study reported that only in their male cohort NWO exhibited higher systolic BP than NWL38
.
Questionnaires
In our total sample, we reported that in the 25th
percentile cut off, NWO had significantly less vigorous METS than NWL. PSS and PSQI scores did not differ between groups, but two cutoffs (25th
and Heo et al.) showed that NWO had significantly fewer problems related to alcohol. The 25th
38 found to have more walking METS in two cutoffs (50th
and Heo et al.), lower scores on the PSS in the 25th
percentile cutoff, and lower scores on the CAPS-R than NWL. Additionally, all three cutoffs reported that NWO females had significantly fewer roommates. To our knowledge, this is the first study that has examined lifestyle associations with this specific population, however research on the interactions between lifestyle, college students, and obesity is extensive. Prior evidence suggests that physical inactivity is linked to obesity,61,67,68
and college students are a population deemed inactive in the literature53,75,77,79,80
. Two studies support our PA findings, albeit in different populations. A study on sixth graders and physical activity found that obese youth had significantly less moderate-vigorous physical activity than their non-obese counterparts, while another study sampling adolescents reported significantly lower BF% in those that engaged in relatively large amounts of vigorous PA110,111
. Vigorous PA may be a good target for future interventions in this population, as a previous study has shown that a decrease in vigorous PA in college students resulted in a decline in total PA over time112
. While we found no differences in stress and sleep quality in our total sample, male cohort, and our female NWO group had significantly less stress than NWL; other studies have contrasted our results. High levels of stress84
and poor sleep quality82,83
have been linked to being overweight and obese in college students. Although we found that our total and female NWO group had fewer problems related to alcohol than NWL, past reports on the relationship between alcohol and adiposity are conflicting. Several studies have found that only excessive or heavy drinking is associated with increased body fat 113,114
, and others have found that light drinking is negatively associated with adiposity115–117
39
reporting that females who are more likely to live alone have significantly more BF%118
, and another showing that college men and women were more likely to be overweight/obese if they lived off campus100
. However, in the latter study BMI was the only measure utilized.
Limitations