IMPACT OF FREE CHLORINE ON THE FATE OF BIOCHEMICALLY ACTIVE COMPOUNDS IN DRINKING WATER
Jacqueline Pearl Kaplan
A thesis submitted to the faculty of the University of North Carolina at Chapel Hill in partial fulfillment of the requirements for the degree of Master of Science in the Department of
Environmental Sciences and Engineering.
Chapel Hill 2011
Approved by:
©2011
ABSTRACT
Jacqueline Pearl Kaplan: Impact of Free Chlorine on the Fate of Biochemically Active Compounds in Drinking Water
(Under the direction of Dr. Howard S. Weinberg)
As a result of the rapid development of the pharmaceutical and agricultural industries, the biochemically active compounds they produce to treat human ailments, maintain livestock health, and improve crop output are finding their way into the aquatic environment. Surface waters supplying drinking water treatment plants may be particularly vulnerable if the chemicals persist through upstream wastewater treatment or appear in run-off from land application. During drinking water treatment physicochemical processes may remove some of these chemicals or transform them into products with unknown structures and biological activity.
ACKNOWLEDGEMENTS
I would like to thank Dr. Howard Weinberg for his enthusiasm for teaching and commitment to sharing his knowledge with others. For this I am very grateful and have enjoyed learning from his expertise. Additionally, I would like to thank my committee members Dr. Detlef Knappe and Dr. Steve Whalen for their participation and input in the completion of this research project.
I would like to thank the members of the Weinberg research group for their support and friendship. In particular I would like to thank Bonnie Lyon for sharing her knowledge in the lab and for her willingness to help others. I would also like to thank Paul Ebohon for helping complete the occurrence sampling. I would also like to thank Yi Liu for her help during chlorination experiments and for her enthusiasm for learning in the laboratory.
I would like to thank the individuals from the drinking water treatment plants, Rachel Monschein, Jimmy Gamble, Tom Murr and Eric Davis for their assistance during sampling events and providing information to help with data analysis.
I would like to thank my family and friends who have provided me with their continued support, and I would like to sincerely thank Hayden Black for his daily encouragement and support.
TABLE OF CONTENTS
LIST OF TABLES………viii
LIST OF FIGURES………xi
LIST OF ABBREVIATIONS………xv
Chapter 1. INTRODUCTION………..……..………...1
1.1 LITERATURE REVIEW……...………..…...2
1.1.1 USES OF BIOCHEMICALLY ACTIVE COMPOUNDS………..…...2
1.1.2 ROUTES OF BAC EXPOSURE INTO THE ENVIRONMENT...….3
1.1.3 FATE OF BACS IN THE ENVIRONMENT……….7
1.1.4 ANALYTICAL METHODS………...13
1.1.5 PRESENCE OF BACS IN NATURAL WATERS………...14
1.1.6 OCCURRENCE IN DRINKING WATER SOURCES………17
1.1.7 FATE OF BACS DURING DRINKING WATER TREATMENT…..21
1.1.8 REACTIVE SITES ON BACS WITH FREE CHLORINE…………..30
1.1.9 IDENTIFICATION OF TRANSFORMATION BY-PRODUCTS OF BACS DUE TO CHLORINATION………38
1.1.10 POLICIES………..45
1.1.11 FUTURE MANAGEMENT STRATEGIES………...47
2. MATERIALS AND METHODS………51
2.1 MATERIALS………....51
2.2 METHODS………55
2.2.1 BENCH SCALE CHLORINATION EXPERIMENTS………....55
2.2.2 OCCURRENCE SAMPLING………...60
3. CHLORINATION OF BACS – INCORPORATION OF CHLORINE ONTO PARENT MOLECULE………...73
3.1 INTRODUCTION………...73
3.2 CHLORINATION EXPERIMENTS……….74
3.3 RESULTS AND DISCUSSION………76
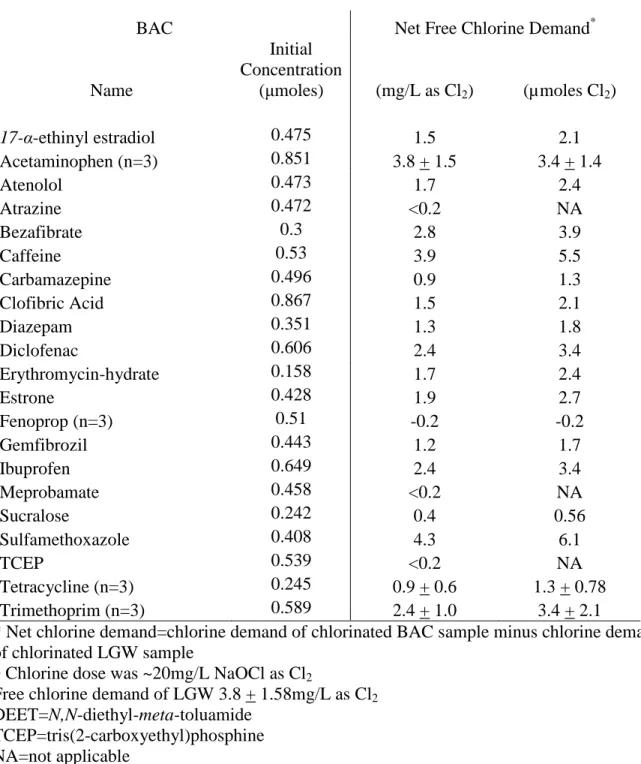
3.3.1 CHLORINE DEMAND………....76
3.3.2 REACTIVITY OF PARENT BACS WITH FREE CHLORINE…….78
3.3.3 REMOVAL OF PARENT BAC………....90
3.3.4 CASE STUDY OF TETRACYCLINE REACTIVITY WITH FREE CHLORINE………...92
3.4 CONCLUSIONS………...120
4. OCCURRENCE OF BIOCHEMICALLY ACTIVE COMPOUNDS DURING DRINKING WATER TREATMENT……….124
4.1 INTRODUCTION………...124
4.2 SAMPLE COLLECTION AND SITE INFORMATION………....125
4.3 RESULTS AND DISCUSSION………..131
4.3.1 FATE OF BACS DURING DRINKING WATER TREATMENT………...131
4.4 CONCLUSIONS………..139
APPENDIX 1. Composite Sample Collection Procedure………..……….…....144
APPENDIX 2. Standard Operating Procedure (SOP)……….…..145
APPENDIX 3. North Carolina Land Use Maps………..…178
APPENDIX 4. Chlorine Isotope Ratios……….….…..184
LIST OF TABLES
1.1: Percent Excretion of BACs from the Body Unchanged………..5
1.2: Removal of BACs during Wastewater Treatment…………..………...6
1.3: Physical Properties of BACs………..11
1.4: Occurrence Levels of BACs in U.S. Streams 1999-2000……….….…..….15
1.5: Occurrence Levels of BACs in Drinking Water Sources………..19
1.6: Average Concentration (Cave) of BACs during Conventional Drinking Water Treatment (n = 12)……….………..…23
1.7: Percent Removal of BACs using PAC………..27
1.8: Approximate Percent of Parent BAC Removed using 3.5 mg/L NaOCl as Cl2 at pH 5.5, Contact time 24 hours.……….………..29
1.9: Electrophilic Aromatic Substitution-Substituent Effects………..32
1.10: Transformations of BACs in Reactions with Free Chlorine and Impact on Biological Effect………40
2.1: Studied BACs and Intended Uses………..52
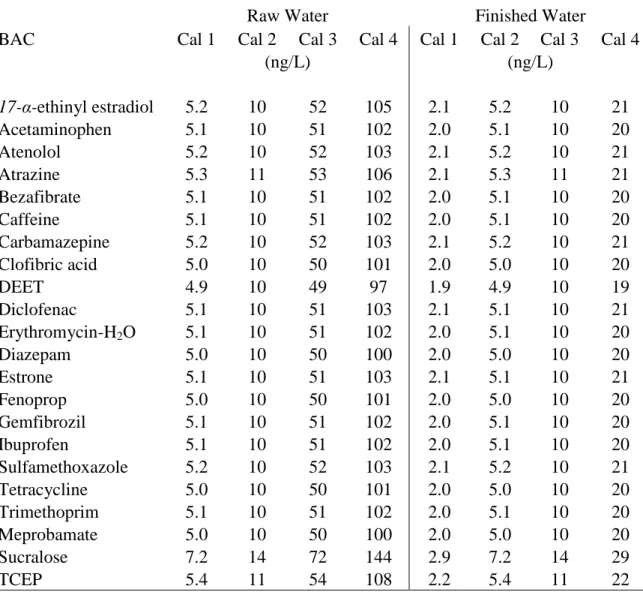
2.2: BAC Solutions used for Analytical Calibration..………...63
2.3: Concentration of Standard Addition Levels used for Quantification………64
2.4: Mobile Phase Gradient used for LC-(+/-)-ESI-MS/MS………67
2.5: Source Dependent Mass Spectrometer Parameters……….………..67
2.6: Optimized Acquisition Data for Group 1 (+ESI) Compounds………..69
2.7: Optimized Acquisition Data for Group 2 (+ESI) Compounds………..69
2.8: Optimized Acquisition Data for Group 3 (–ESI) Compounds………..70
2.9: Optimized Acquisition Data for Internal and Surrogate Standards………...70
2.10: Instrument Detection Limit for Targeted BACs………71
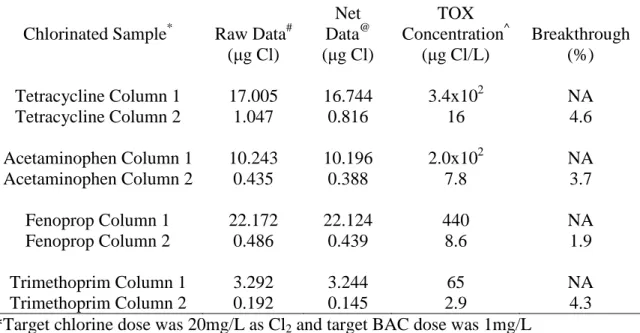
3.1: Studied BACs and Experimental Conditions………....75 3.2: Net Free Chlorine Demand of Chlorinated BACs………..………...77 3.3: Breakthrough Determination of Select Chlorinated BACs during TOX Analysis……78 3.4: Results from TOX Analysis of Chlorinated BACs………80 3.5: (+)-ESI-MS/MS Results of Targeting Parent BAC Before/After Chlorination………91 3.6: Concentration of HOCl Used during Experiment and Corresponding
Molar Ratio………93 3.7: Chlorine Dose (mg/L as Cl2) Required for Mono-, Di-, and Tri-,
Substitution of Tetracycline (C0 = 22µM) in LGW Assuming
all Chlorine is Consumed………...95 3.8: Effect of Chlorination of the UV Absorbance of Tetracycline
at Different Chlorine Doses with Contact Time of 24 Hours………98 3.9: Direct Infusion MS/MS Results of Tetracycline Before
and After Reaction with Chlorine [HOCl]:[TC] = 1:5 in LGW 24 hours after Reaction of Tetracycline with Free
Chlorine with a Residual of 0mg/L as Cl2………...111
3.10: Direct Infusion MS/MS Results of Targeted Potential Transformation Products from [HOCl]:[TC] = 1:5 in LGW 24 hours after Reaction of Tetracycline with
Free Chlorine with a Residual of 0mg/L as Cl2………...112
3.11: Direct Infusion MS/MS Results of Tetracycline in the Unchlorinated Sample and the [HOCl]:[TC] 1:20 in LGW 24 hours after Reaction of Tetracycline with Free Chlorine with a Residual of 0mg/L as Cl2 due to
the addition of quenching agent………..118 4.1: Water Quality Data of Source and Finished Waters of
DWTPs 1-3 Provided by the Utility………....127 4.2: Concentrations (ng/L) of BACs Detected in Drinking
Water Sources in North Carolina………...131 4.3: Concentrations (ng/L) of BACs Detected in Settled Drinking
4.4: Concentrations (ng/L) of BACs Detected in Finished Drinking
Water in North Carolina (and percentage decrease from settled water)……….135 4.5: Concentrations (ng/L) of BACs Detected in Distributed Drinking
LIST OF FIGURES
1.1: Pathways of BACs into Drinking Water………..……..………..4 1.2: pH Dependent Speciation of BACs: (a) Acetaminophen,
(b) Trimethoprim, and (c) Tetracycline………...12 1.3: Chlorination of 17-α-ethynylestradiol (EE2)………...…….34 1.4: Reaction of Sulfonamide Antibiotic, Sulfamethoxazole, with Free
Chlorine.………....35
1.5 Reaction of Sulfonamide Antibiotic, Sulfamethoxazole, with a
Molar Excess of Free Chlorine.……….36 1.6: Reactions of Amines with Free Chlorine.………..37 3.1: Structures of BACs Studied which Showed the Greatest Degree
of Chlorine Incorporation During Reaction with Free Chlorine………..….82 3.2: Structures of BACs Studied with the Lowest Degree of Chlorine
Incorporation During Reaction with Free Chlorine………...86 3.3: Structures of BACs Studied with Moderate Chlorine Incorporation
During Reaction with Free Chlorine………..89 3.4: Reactivity of Tetracycline (C0 = 22.5µM) as a Function of
Free Chlorine Dose and Measured by Chlorine Residual
(Right-Hand y-axis) and MS/MS Ion Intensity (Left Hand y-axis)………..93 3.5: UV-Vis Spectrum of Tetracycline in LGW………...97 3.6: UV-Vis Spectrum of 450µM Free Chlorine in LGW………....97 3.7: UV-Vis Spectrum of Chlorinated Tetracycline [HOCl]:[TC] = 20
in LGW after Quenching with Sodium Sulfite………100 3.8: UV-Vis Spectrum of Sodium Sulfite Quenched Chlorine (450uM)
in LGW………...……….100 3.9: Free Chlorine Residual (mole/L as Cl2) as a Function of Reaction
3.10: Integrated Rate Law Analysis of the Reaction between Free
Chlorine and Tetracycline………103
3.11: Full Scan Spectra of 22µM Tetracycline in LGW. Prominent
Ion at m/z 445.1 is that of [M+H]+ for Tetracycline………..………..……104 3.12: Full Scan Spectra of a Quenched Chlorinated Tetracycline
Sample [TC]:[HOCl] = 1:20. Prominent Tetracycline Ion
(m/z 445.1) is Missing and a New Spectra is Observed………...…105 3.13: Full Scan Spectra of HOCl in LGW Quenched with
Ascorbic Acid. Prominent Ions m/z 215 and 407 are Seen in Both Chlorinated Tetracycline Sample
(Figure 3.11) and Chlorinated Lab Grade Water Control Sample………...105 3.14: Full Scan Mass Spectra (50-1000 m/z) of Chlorinated
Tetracycline ([HOCl]:[TC] = 1:5) in LGW After 24 Hours
Contact Time Leaving No Cl2 Residual………...106
3.15: 22µM Tetracycline in LGW. Collision Induced Dissociation of the Molecular Ion (m/z 445) of Tetracycline in Q2 of the
Mass Spectrometer………...108 3.16: Chlorinated Tetracycline ([HOCl]:[TC] = 1:5) in LGW After
24 Hours Contact Time and 0mg/L as Cl2 Residual. Collision
Induced Dissociation of Molecular Ion (m/z 445) of Tetracycline
in Q2 of the Mass Spectrometer (n = 1)………...109 3.17: Chlorinated Tetracycline ([HOCl]:[TC] = 1:5) in LGW After
24 Hours Contact time and 0mg/L as Cl2 Residual. Collision
Induced Dissociation of Prominent Fragment m/z 483 of a Potential Transformation Product of Tetracycline in Q2 of
the Mass Spectrometer (n = 1)………...109 3.18: Chlorinated Tetracycline ([HOCl]:[TC] = 1:5) in LGW After
24 Hours Contact Time and 0mg/L as Cl2 Residual. Collision
Induced Dissociation of Molecular Ion m/z 477 of a Potential Transformation Product of Tetracycline in Q2 of
the Mass Spectrometer (n = 1)………...110 3.19: Chlorinated Tetracycline ([HOCl]:[TC] = 1:5) in LGW After
24 Hours Contact Time and 0mg/L as Cl2 Residual. Collision
Induced Dissociation of Molecular Ion m/z 467 in Q2 of a Potential Transformation Product of Tetracycline of
3.20: Chlorinated Tetracycline ([HOCl]:[TC] = 1:5) in LGW After 24 Hours Contact Time and 0mg/L as Cl2 Residual. Collision
Induced Dissociation of Molecular Ion m/z 461 of a Potential Transformation Product of Tetracycline in Q2 of
the Mass Spectrometer (n = 1)……….111 3.21: Full Scan Mass Spectra (50-1000 m/z) of Chlorinated Tetracycline
([HOCl]:[TC] = 1:20) in LGW After 24 Hours Contact Time
and Quenched Chlorine Residual……….114 3.22: [TC]:[HOCl] = 1:20 in LGW. Collision Induced Dissociation
of Molecular Ion (m/z 445) of Tetracycline in Q2 of the Mass
Spectrometer………....115 3.23: Chlorinated Tetracycline ([TC]:[HOCl] = 1:20) in LGW
After 24 Hours Contact Time and Quenched Chlorine. Collision Induced Dissociation of Molecular Ion m/z 456 of a Potential Transformation Product of Tetracycline in Q2 of the Mass
Spectrometer (n =1 )………....115 3.24: Chlorinated Tetracycline ([TC]:[HOCl] = 1:20) in LGW 24
Hours Contact Time and Quenched Chlorine. Collision Induced Dissociation of Molecular Ion m/z 399 of a Potential Transformation
Product of Tetracycline in Q2 of the Mass Spectrometer………....116 3.25: Chlorinated Tetracycline ([TC]:[HOCl] = 1:20) in LGW 24
Hours Contact Time and Quenched Chlorine. Collision Induced Dissociation of Molecular Ion m/z 461 of a Potential Transformation
Product of Tetracycline in Q2 of the Mass Spectrometer………....116 3.26: Chlorinated Tetracycline ([TC]:[HOCl] = 1:20) in LGW 24
Hours Contact Time and Quenched Chlorine. Collision Induced Dissociation of Molecular Ion m/z 477 of a Potential Transformation
Product of Tetracycline in Q2 of the Mass Spectrometer………....117 3.27: Chlorinated Tetracycline ([TC]:[HOCl] = 1:20) in LGW 24
Hours Contact Time and Quenched Chlorine. Collision Induced Dissociation of Molecular Ion m/z 451 of a Potential Transformation
Product of Tetracycline in Q2 of the Mass Spectrometer………....117 3.28: Chlorinated Tetracycline [TC]:[HOCl] = 1:20 in LGW After
24 Hours Contact Time with Quenched Chlorine. Chlorine
Isotopes [M], [M+2], [M+4], and [M+6] of Potential Transformation
3.29: Chlorinated Tetracycline [TC]:[HOCl] = 1:20 in LGW After 24 Hours Contact Time and Quenched Chlorine. Chlorine
Isotopes [M], [M+2], [M+4], and [M+6] of Potential Transformation
Product m/z 467 Targeted in Q1 of the Mass Spectrometer………120
4.1: Plant Schematic of DWTP1 including Chemical Doses on 7/20/2010 and 7/21/2010………..………...128
4.2: Plant Schematic of DWTP2 including Chemical Doses..……….……..129
4.3: Plant Schematic of DWTP3 including Chemical Doses………...130
4.4: Removal of Detected BACs from DWTP1……….137
4.5: Removal of Detected BACs from DWTP2………...…..138
LIST OF ABBREVIATIONS
ACN Acetonitrile
Amu Atomic Mass Unit APCI Atmospheric Pressure Chemical Ionization
AR Analytical Reagent
BACs Biochemically Active Compounds
BSTFA N,O-bis(trimethylsilyl) trifluoroacetamide CCL3 Candidate Contaminant List 3 CID Collision Induced Dissociation
DBPs Disinfection By-Products
DEET N,N-diethyl-meta-toluamide DMDCS Dimethyldichlorosilane DOM Dissolved Organic Matter
DPD N,N-Diethyl-p-phenylenediamine
DWS Drinking Water Strategy
DWTPs Drinking Water Treatment Plants
EDCs Endocrine Disrupting Compounds
EE2 17-a-ethinyl estradiol
EPA Environmental Protection Agency
ESI Electrospray Ionization
GC Gas Chromatography GC-MS Gas Chromatography Mass Spectrometry HAAs Haloacetic Acids HCB Hexachlorobenzene
HLB Hydrophilic-Lipophilic Balance
HPLC High Performance Liquid Chromatography
IS Internal Standard
IDL Instrument Detection Limit Kow Octanol Water Partition Coefficient
LC Liquid Chromatography
LC-MS Liquid Chromatography Mass Spectrometry LC-MS/MS Liquid Chromatography Tandem Mass Spectrometry
LGW Laboratory Grade Water
LOQ Limits of Quantification
MCL Maximum Contaminant Level
MCLG Maximum Contaminant Level Goal
MS Mass Spectrometry
MtBE Methyl-tert-butyl-ether
Na2EDTA Disodium ethylenediamine tetraacetic acid
ND Not Detected
NMR Nuclear Magnetic Resonance
NDPES National Pollutant Discharge Elimination System NPDWRs National Primary Drinking Water Regulations NSDWRs National Secondary Drinking Water Regulations
PCPs Personal Care Products
PCS Potential Contaminant Sites pKa Acidity Constant
PPG Poly-(propylene glycol) RL Reporting Level SDWA Safe Drinking Water Act S/N Signal to Noise ratio
SPE Solid Phase Extraction
SS Surrogate Standard
TC Tetracycline
TCEP Tris (2-chloroethyl)phosphate
TMCS Trimethylchlorosilane
TOX Total Organic Halogen
THMs Trihalomethanes UC Unquantified Concentration Estimated to Exceed the Reporting Level
UHP Ultra High Purity
USGS United States Geological Survey
UV Ultra Violet
1. INTRODUCTION
remains a challenging area of environmental research, but would provide essential information to help direct toxicology and sampling research, evaluate effective treatment technologies, and develop more environmentally responsible drug and agricultural products.
1.1 Literature Review
1.1.1 Uses of Biochemically Active Compounds
Biochemically active compounds (BACs) are those manufactured to effect a biological response in a target cell, and include a broad range of compounds including human and animal use pharmaceuticals, personal care products (PCPs), endocrine disrupting compounds (EDCs), agricultural products, artificial sweeteners and stimulants. Pharmaceutical compounds are those that are available either with or without a prescription including antibiotics, lipid regulators, beta blockers, anti-epileptics, anti-cholesterols, analgesics and anti-anxiety compounds to name a few. PCPs include compounds that are in soaps and lotions such as anti-microbial agents as well as insect repellants and flame retardants. EDCs induce a change in the endocrine system and include steroid hormones and synthetic estrogens, among others. Agricultural products are those that are used for land application and include herbicides and insecticides. Other compounds that are biochemically active are stimulants such as caffeine, artificial sweeteners such as sucralose, and illegal drugs.
account the illegal purchase of prescription or recreational drug use. The top six most commonly prescribed pharmaceuticals in the U.S. were lipid regulators, analgesics, thyroid regulators, blood pressure regulators and antibiotics (rxlist.com). Antibiotics and steroid hormones are the most commonly used veterinary pharmaceuticals and account for a significant portion of the pharmaceuticals used.
In the U.S. PCPs and agricultural chemicals including flame retardants, antimicrobials, detergents, pesticides and herbicides are highly used. For example, the average annual estimate of the use of the insect repellant N,N-diethyl-meta-toluamide (DEET) in 1990 was approximately 4 million pounds of the active ingredient (U.S. EPA, 1998). The herbicide, atrazine, is one of the two most highly used agricultural pesticides, and is used for the majority of the corn, sugarcane, and sorghum production (U.S.EPA, 2006). The estimated annual use of atrazine is 64 to 76 million pounds and prohibiting its use would result in a significant loss in crop yield and revenue for the industry (U.S.EPA, 2006). Although these figures are not up to date it may be assumed that the current use of human and veterinary pharmaceuticals, PCPs, and agricultural chemicals is at least as high as the reported values.
1.1.2 Routes of BAC Exposure into the Environment
body also results in their excretion and subsequent introduction into wastewater treatment plants (WWTPs). Limited options for unused prescription drug disposal results in BACs being flushed down the toilet or thrown out in the trash allowing them to enter WWTPs or landfills, respectively. PCPs such as sunscreens, bug sprays, lotions, etc. may wash off the user when either washing hands, showering, or swimming in lakes/rivers.
Table 1.1 Percent Excretion of BACs from the Body Unchanged
Compound Excretion as unchanged (%) Reference
Atenolol 50 Kasprzyk-Hordern et al., 2009
Bezafibrate 50 Kasprzyk-Hordern et al., 2009 Carbamazepine 3 Kasprzyk-Hordern et al., 2009 Diclofenac 5-10 Kasprzyk-Hordern et al., 2009 Erythromycin-H2O >60 Hirsch et al., 1999
Ibuprofen 1 Kasprzyk-Hordern et al., 2009
Sulfamethoxazole 30 Kasprzyk-Hordern et al., 2009 Tetracycline 80-90 Hirsch et al., 1999
Trimethoprim 80 Kasprzyk-Hordern et al., 2009
Table 1.2 Removal of BACs During Wastewater Treatment (Heberer, et al., 2002) Compound Cave influent(µg/L) Cave effluent(µg/L) Removal (%)
Carbamazepine 1.78 1.63 8
Clofibric acid 0.46 0.48 0
Diclofenac 3.02 2.51 17
Caffeine 230 0.18 <99.9
There are also many ways in which BACs may contaminate water resources as the result of land use. The application of herbicides and insecticides to agricultural land is usually completed by spraying fields. Due to this practice, herbicide aerosols may be directly introduced into the atmosphere or may sorb onto particulate matter in the air where it is then transported long distances via wind. A study of air samples collected in 1995 showed that in agricultural areas during the application of the widely used herbicide atrazine, it was detected in 67% (n = 21) of particulate samples (Cmax= 0.42ng/m3) and in 42% (n = 21) of air samples
(Cmax=2.6ng/m3) (Coupe et al., 2000). The same study also showed that atrazine was
detected in urban air in 29% (n = 24) (Cmax= 0.019ng/m3) on particulate and was not detected
in the gas phase (Coupe et al., 2000).
Whether atrazine is directly released into the atmosphere as an aerosol, bound to particulate matter in the air, or evaporates from soil, rain events may scrub the atmosphere, with particulate matter being more effectively removed (Goolsby et al., 1997). A two year study showed that atrazine was always present in rainwater samples with the highest detected concentration of 2.19 µg/L during the early spring (May), which correlated to the spraying of the fields with the herbicide around that time (Wu, 1981). Rainwater can incorporate aerosols and particulate matter and one study by the U.S. Geological Survey (USGS) revealed that atrazine was detected in 30.2% of all rainwater samples tested from the midwestern and northeastern U.S. (n=2,085) and was present in rainfall at concentrations up to 10.9 µg/L (Goolsby et al., 1997). As the result of atrazine being transported via wind and scrubbed from the atmosphere by rain it is potentially deposited into surface water.
The aforementioned discussion is just a brief overview of the complex nature of the fate of atrazine after its introduction to the environment. As with many anthropogenic compounds, its fate is extremely complex and not well understood. Therefore, extreme caution should be undertaken when highly persistent and ubiquitous chemicals are being constantly introduced into the environment. A summary of some of the routes of exposure of BACs into the environment are shown in Figure 1.1.
1.1.3 Fate of BACs in the Environment Physicochemical Properties
2004; Lam and Mabury, 2005; Löffler et al., 2005). PCPs are either introduced directly into surface waters as the result of recreational use or may be subjected to wastewater treatment and eventual release into the environment. Agricultural chemicals and animal use pharmaceuticals are subjected to dilution, photolysis, and hydrolysis in surface water, mobility through soils, and transport via evaporation or sorption onto particulate matter in the atmosphere. Important physicochemical properties that govern a compound’s behavior and ultimate fate in the environment are the octanol-water distribution coefficient (Kow) and the acidity constant(s) (pKa).
The Kow describes a compounds affinity for either the organic or aqueous phase of a solution and is helpful in understanding if a compound will be more likely to remain in water or migrate into soils/sediments. If a chemical has a high log Kow value which indicates hydrophobicity such as for the steroid hormones compounds (estrone and 17-α-ethinyl estradiol (EE2)), this means that the chemical is more likely to sorb onto soils and not be detected in the aqueous phase. As a result BACs that migrate into soils may be subjected to biodegradation or uptake into plants. BACs with low log Kow values are expected to be more polar and hydrophilic and are more likely to remain in the aqueous phase.
The pKa, or acidity constant, indicates the speciation (protonated or deprotonated) of
dependent dissociation in water for three BACs. Table 1.3 also shows, in parenthesis, the pH dependent transitions of each BAC.
Photolysis and Sorption onto Soils
Organic compounds are able to undergo direct (i.e. light directly from the sun) or indirect (i.e. from photolysis radicals) photolysis, and the mechanism of action varies between BACs (Lam and Mabury, 2005). A study on the persistence of eight pharmaceuticals in controlled outdoor field microcosms concluded that indirect photolysis reactions due to the presence of dissolved organic matter (DOM) in water are more likely to degrade pharmaceuticals in the natural environment than hydrolysis or biodegradation (Lam et al., 2004). A compound in the tetracycline family of antibiotics was found to degrade rapidly under sunlight irradiation and photolysis was proposed to contribute more significantly to the attenuation than hydrolysis in shallow non-turbid water (Xuan et al., 2010). The chemical structure of BACs including heteroatoms, aromatic rings, phenol, and nitro groups explain their reactivity due to their ability to absorb solar radiation (Boreen et al., 2003).
and these polar and hydrophilic compounds have been found to remain in the aqueous phase and are not detected in sediments (Wu et al., 2009). The persistence of BACs that are applied directly to land are of particular interest, and the adsorption of pesticides including atrazine is largely dependent on soil composition and pH (Gao et al., 1998).
Hydrolysis
Table 1.3 Physical Properties of BACs
BAC Log Kow pKa
17-α-ethynylestradiol 3.67b ~10.5b (0/-)
Acetaminophen 0.46b 9.7b (0/-)
Atenolol 0.16c 9.6e (0/-)
Atrazine 2.61b <2b (+/0)
Bezafibrate 4.25f 3.6e (0/-)
Caffeine <0b 6.1b (+/0)
Carbamazepine 2.45b <2b (+/0)
Clofibric Acid 2.57f 3.2g (0/-)
DEET= N,N-Diethyl-meta-toluamide 2.18b <2b (+/0)
Diazepam 2.82b 2.4/1.5b (2+/+/0)
Diclofenac 0.7b 4.15e (0/-)
Estrone 3.13c 10.3b (0/-)
Erythromycin-hydrate 3.06b 8.2h (0/-)
Fenoprop 3.86m 3.2a (0/-)
Gemfibrozil 4.77b 4.7b (0/-)
Ibuprofen 3.97b 4.5b (0/-)
Meprobamate 0.7b <2b(+/0)
Sucralose -0.5i Not Applicable
Sulfamethoxazole 0.89b 1.7/5.6n (0/-/2-)
TCEP= tris(2-carboxyethyl)phosphine 1.44d Not Found
Tetracycline -1.19j 3.30/7.68/9.69k (+/0/-/2-)
Trimethoprim 0.91b 1.3o/7.5l (2+/+/0)
Legend 0 = neutral; - = negatively charged species; + = positively charged species
(a)Garrison et al., 1994; (b)Westerhoff et al., 2005; (c) Hansch et al., 1995; (d) Trenholm et al., 2006; (e) SRC, 2011; (f) Kujawa-Roeleveld et al., 2008; (g) Bhandari et al., 2009; (h) Qiang and Adams, 2004; (i) Neset et al., 2010; (j) Wollenberger et al., 2000; (k) Stephens et al., 1956; (l) Cocco et al., 1983; (m) Isnard and Lambert, 1989; (n) Lucida et al., 2000; (o) Cao and Cross, 2000
1.1.4 Analytical Methods
The development of sensitive methods amenable to the extraction and analysis of BACs is based on pairing knowledge of physicochemical properties of target BACs with available analytical instrumentation. This is not an easy task as BACs have a wide range of polarities and exist as acidic, neutral, or basic species. An effective goal is to have a comprehensive method that can process a variety of BACs with the minimal amount of sample preparation which usually includes sample collection, preservation, filtration, extraction, elution, concentration, and instrumental analysis.
Due to their high sensitivity and selectivity, the analytical instruments of choice are mass spectrometers (MS). While it is possible to scan for a broad range of masses (full scan analysis) this practice drastically reduces sensitivity. Therefore, one limitation of mass spectrometry is that you can only detect compounds with a high level of sensitivity that are directly targeted in the method. This is achieved by selecting specific ions and/or ion transitions associated with a particular molecule to reduce any noise relating to non-target compounds. Mass spectrometry has been paired with liquid chromatography (LC) or gas chromatography (GC) for the separation and analysis of more polar and more volatile compounds, respectively.
sample extraction and concentration using both gas chromatography-mass spectrometry (GC-MS) and liquid chromatography (tandem) mass spectrometry LC-MS/((GC-MS) methods with reporting limits between 1-10ng/L (Trenholm et al., 2006). Sample preparation is minimized through the use of different analytical methods that use LC-MS/MS in both positive and negative electrospray ionization (+/-ESI) and positive atmospheric pressure chemical ionization (+APCI) with reporting limits of 1.0ng/L (Vanderford et al., 2003). One major analytical challenge is maintaining up to date methods with the production of new pharmaceuticals. Occurrence data for environmental samples depends on targeting known chemicals since LC-MS methods are, for the most part, unable to screen for unknowns at the low levels expected. Identifying effective methods to screen drugs for environmental toxicity screening or persistence may help guide environmental sampling efforts.
1.1.5 Presence of BACs in Natural Waters
summarized in Table 1.4. It is important to note that in this study the selection of the 139 sampling sites were biased towards those that were more likely to be impacted by both urbanization and livestock production.
Table 1.4 Occurrence Levels of BACs in U.S. Streams 1999-2000 (Kolpin et al., 2002) Compound Cmax(µg/L) Frequency (%)
17-α-ethinyl estradiol (n=70) 0.831 15.7
17β-estradiol (n=70) 0.093 10
Acetaminophen (n=84) 10 23.8
Caffeine (n=84) 6 61.9
DEET (n=54) 1.1 74.1
Erythromycin-H2O (n=104) 1.7 21.5
Estriol (n=70) 0.051 21.4
Estrone (n=70) 0.112 7.1
Gemfibrozil (n=84) 0.79 3.6
Ibuprofen (n=84) 1 9.5
Mestranol (n=70) 0.407 10
Sulfamethoxazole (n=104) 1.9 12.5
Tetracycline (n=84) 0.11 1.2
TCEP (n=85) 0.54 57.6
Triclosan (n=85) 2.3 57.6
Trimethoprim (n=104) 0.71 12.5
high concentrations. Ibuprofen, due to its high log Kow value, likely migrates out of the aqueous phase and eludes detection. Conversely, acetaminophen has a very strong affinity for the aqueous phase and is present at very high concentrations. More hydrophobic BACs (compounds with higher log Kow values) including gemfibrozil and the steroid hormones were detected less frequently and this may be due to their ability to sorb onto soils.
The antibiotics (erythryomycin-H2O, sulfamethoxazole, tetracycline, and
1.1.6 Occurrence in Drinking Water Sources
The result of high BAC use, their persistence through WWTPs and in the environment is that they are continuously being introduced into waters that may become sources for drinking water. Many occurrence studies have been completed to determine the concentration of BACs in drinking water sources, and data from three different sampling studies are shown in Table 1.5. One study completed by the U.S.G.S. sampled from only one DWTP source during a three week time period. The source was located in a heavily populated, highly urbanized area with significant WWTP effluent entering the source water (Stackelberg et al., 2007). Since this sampling event took place at only one source it could be expected that the same BACs would be detected due to usage patterns, and this information is reflected in Table 1.5 with the bias shown in relative high frequency of those compounds detected (42% or greater). While this information does not provide representative information for a wide range of drinking water sources it does reveal that a particular drinking water source with upstream wastewater influences is constantly receiving detectable levels of particular chemical loads.
The third study shown in Table 1.5 was completed by the Southern Nevada Water Authority and represents information gathered from an occurrence study on 19 US utilities. Source waters were selectively chosen based on their uses and upstream influences. In this study one ground water site was sampled, one lake with upstream wastewater influences, four reservoirs with WWTPs upstream, six rivers with no WWTP influences, four reservoirs with no WWTP inputs but with recreational use, and three reservoirs with no WWTP inputs or recreational use (Benotti et al., 2009). Correlations were observed between detecting BACs in drinking water sources and the direct input of wastewater and recreational use (Benotti et al., 2009). This study represented a wide range of drinking water sources and the frequencies of detection in Table 1.5 from this study reflect site selection choice.
Table 1.5 Occurrence Levels of BACs in Drinking Water Sources
Compound Cmax(ng/L) n Frequency (%) Reference
17-α-ethinyl estradiol 1.4 19 5.3 Benotti et al., 2009
Acetaminophen 160 74 8.1 Focazio et al., 2008 Acetaminophen 120 12 75 Stackelberg et al., 2007
Atenolol 36 19 63 Benotti et al., 2009
Atrazine 870 19 79 Benotti et al., 2009
Caffeine 270 74 7.5 Focazio et al., 2008
Caffeine 100 12 42 Stackelberg et al., 2007
Carbamazepine 51 19 79 Benotti et al., 2009 Carbamazepine 190 74 21.6 Focazio et al., 2008 Carbamazepine 600 12 92 Stackelberg et al., 2007
DEET <500 73 14 Focazio et al., 2008
DEET 200 12 92 Stackelberg et al., 2007
DEET 110 19 32 Benotti et al., 2009
Diazepam 0.47 19 11 Benotti et al., 2009
Diclofenac 1.2 19 21 Benotti et al., 2009
Erythromycin-hydrate 300 73 8.1 Focazio et al., 2008 Erythromycin-hydrate 10 12 58 Stackelberg et al., 2007
Estrone 0.9 19 79 Benotti et al., 2009
Gemfibrozil ND 74 0 Focazio et al., 2008
Gemfibrozil ND 12 0 Stackelberg et al., 2007
Gemfibrozil 24 19 58 Benotti et al., 2009
Ibuprofen 270 74 1.4 Focazio et al., 2008
Ibuprofen ND 12 0 Stackelberg et al., 2007
Meprobamate 73 19 84 Benotti et al., 2009
Sulfamethoxazole 60 12 83 Stackelberg et al., 2007 Sulfamethoxazole 110 19 89 Benotti et al., 2009
TCEP <500 73 20.3 Focazio et al., 2008
TCEP 120 12 100 Stackelberg et al., 2007
TCEP 530 19 53 Benotti et al., 2009
Tetracycline ND 73 0 Focazio et al., 2008
Tetracycline ND 12 0 Stackelberg et al., 2007
Triclosan ND 12 0 Stackelberg et al., 2007
Triclosan <100 73 8.1 Focazio et al., 2008
Triclosan 6.4 19 32 Benotti et al., 2009
Trimethoprim 20 71 6.8 Focazio et al., 2008
Trimethoprim 11 19 58 Benotti et al., 2009
Trimethoprim ND 12 0 Stackelberg et al., 2007
Of the six compounds targeted in all three studies the results from Benotti et al. (2009) have the second highest frequency of detection (carbamazepine, DEET, TCEP, triclosan, and trimethoprim) and this is most likely a result of site selection and sampling from mainly surface water sources. The lowest frequencies of detection are from the study by Focazio et al. (2008) for these six compounds, and this may be the result of sampling from many ground water sites or selecting source waters with less anthropogenic impacts.
The concentrations of all BACs in drinking water sources (Table 1.5) are lower than those in U.S. streams (Table 1.4). This attenuation from streams to drinking water sources is most likely due to a combination of hydrolysis, photolysis, sorption onto soils, and biodegradation. Another possible explanation is dilution of streams in larger reservoirs or degradation due to the half-lives of the BACs. Also it should be noted that the sampling completed by Kolpin et al. (2002) had a greater bias towards impacted sites which may provide another explanation for this observation.
The concentrations of the PCPs targeted (DEET and TCEP) were relatively high as were the concentrations of the non-prescription BACs (acetaminophen, ibuprofen, and caffeine), and this result is most likely due to high use and availability without a prescription. The compounds with the lowest concentrations or not detected were the steroid hormones, 17-α-ethinyl estradiol and estrone, and this may be due to their use in lower quantities,
affinity towards soils (see their high log Kow values in Table 1.3), and degradation by organisms in the water.
Contaminant Level Goal (MCLG)/Maximum Contaminant Level (MCL) for atrazine in drinking water which is 0.003mg/L (U.S. EPA, 2009a). One particularly troubling result from occurrence studies is the ubiquitous nature of certain anthropogenic compounds. Atrazine, a widely used herbicide, is frequently detected in source waters close to and even those that are far removed from agricultural land (Benotti et al., 2009). The widespread occurrence of atrazine in water poses a troubling public health concern and highlights the challenges associated with effectively managing persistent environmental contaminants. These occurrence studies are helpful to gather current information and guide future research studies and policy decisions.
1.1.7 Fate of BACs during Drinking Water Treatment
The fate of BACs during drinking water treatment could be:
1. Complete removal of the intact chemical by physical treatment processes (e.g., coagulation, powdered or granular activated carbon)
2. Complete removal by chemical processes (e.g., mineralization due to oxidation) 3. Incomplete removal by both physical and chemical treatment processes
4. Incomplete removal and/or transformation due to both physical (e.g., ultraviolet) and chemical disinfectants (e.g., chlorination)
5. Transformation due to chemical treatments.
Table 1.6 Average concentration (Cave) of BACs during Conventional Drinking Water Treatment (n=12) (Stackelberg et al., 2007)
Compound
Source (ng/L)
Clarified FeCl3 (ng/L)
Disinfected NaOCl (ng/L) Filtered Sand/GAC (ng/L) Finished ~1.2mg/L Cl2
residual (ng/L)
Acetaminophen 15 6 ND 1 0.3
Caffeine 126 126 116 4 15
Carbamazepine 191 186 149 4 29
DEET 120 130 125 71 78
Erythromycin-H2O 10 5.3 0.4 ND ND
Gemfibrozil ND ND ND ND ND
Ibuprofen ND ND ND ND ND
Sulfamethoxazole 30 20 ND ND ND
TCEP 95 94 92 ND 4
Tetracycline ND ND ND ND ND
Trimethoprim ND ND ND ND ND
ND = not detected
It is interesting to note in Table 1.6 that two of the most non-polar compounds (gemfibrozil and ibuprofen) were not detected in source water. This may be due to their sorption onto soils or other particulate matter as a result of their high log Kow values or presence as anionic species (see pKa and log Kow values in Table 1.3) in which case, they would elude detection in the aqueous phase. Also it is interesting to note that the antibiotics tetracycline and trimethoprim are both not present in source water (the other antibiotics sulfamethoxazole and erythromycin-H2O are present at lower concentrations), and this may
compounds with the addition of the coagulant, iron chloride, (FeCl3), which may be the result
of both high solubility of these compounds in water and low log Kow values. FeCl3 removed
erythromycin-H2O and acetaminophen most effectively which may be the result of sorption
of BACs onto natural organic matter (NOM) that is removed during coagulation. The removal of erythromycin-H2O can be explained due to its relatively high log Kow value and its low solubility in water. The removal of acetaminophen due to coagulation is not well understood because it is a very hydrophilic compound, but may be due to the base or acid hydrolysis that results from the addition of FeCl3, but this remains to be studied (Stackelberg
et al., 2007). Disinfection using sodium hypochlorite (NaOCl) resulted in minimal removal for caffeine, DEET, and TCEP, while sulfamethoxazole, erythromycin-H2O, carbamazepine,
the water treatment plant and any change in influent levels would have contributed to variable levels of removal during treatment.
Coagulation/Flocculation
Coagulation/flocculation involves the destabilization of suspended solid particles (<0.45µm) in source water with the use of either iron hydroxide or aluminum hydroxide. With the addition of these coagulants the suspended solids clump together to form flocs, which are removed from the water during sedimentation and filtration. Settled solids have been analyzed for their concentration of BACs, and it has been found that hydrophobic compounds are removed during coagulation while hydrophilic compounds are not (Stackelberg et al., 2007). Therefore, the octanol-water partition coefficient, Kow, can predict whether a compound will be effectively removed during coagulation/flocculation (Table 1.3), and BACs that associate with NOM will likely be more effectively removed. Additionally, it has been observed in laboratory batch studies that compounds with relatively high polarity are not removed during coagulation using FeCl3 (Ternes et al., 2002). Both simulated and
Adsorption onto Activated Carbon
Activated carbon is used during water treatment because many organic compounds can adsorb onto the carbon via van der Waals forces. This makes activated carbon an attractive option for removal of compounds but lab-scale studies have shown that competition for active sites between BACs minimizes the removal of the more hydrophilic compounds (Simazaki et al., 2008). It is hypothesized that DOM in raw water samples outcompetes with BACs during adsorption and minimizes BAC removal (Simazaki et al., 2008). Compounds more amenable to removal using activated carbon are those that are hydrophobic or neutral (Simazaki et al., 2008). Simulated drinking water treatment studies have shown that increasing the powdered activated carbon (PAC) dose (Westerhoff et al., 2005) or contact time (Simazaki et al., 2008) will increase the removal efficiency of BACs. Plant sampling studies have shown that adsorption onto PAC is a very effective strategy employed by conventional drinking water treatment plants to remove hydrophobic compounds (Ternes et al., 2002; Stackelberg et al., 2007), but the materials for this treatment option are very expensive relative to the use of ozone, UV/H2O2, or membranes. The results
Table 1.7 Percent Removal of BACs using PAC (Westerhoff et al., 2005)
Compound Percent Removal (5mg/L PAC, 4-hour contact time)
17-α-ethinyl estradiol 77
Acetaminophen 72
Atrazine 60
Caffeine 70
Carbamazepine 74
DEET 49
Diazepam 67
Diclofenac 39
Erythromycin-hydrate 54
Estrone 76
Gemfibrozil 37
Ibuprofen 16
Meprobamate 33
Sulfamethoxazole 36
Trimethoprim 83
TCEP 52
Disinfection Using Chlorine
Chlorine has been used as a disinfectant for water since the early 20th century in the United States. Before that time there were no safeguards against the pathogens in water, the cause of many disease outbreaks, illnesses, and death. The use of chlorine as a drinking water disinfectant has increased life expectancy and improved overall public health due to the removal of pathogens and other organic contaminants.
The most commonly used disinfectants in the United States are sodium hypochlorite (NaOCl) and chloramines (NH2Cl). To disinfect water chlorine is either added as chlorine
gas (Cl2) or as sodium hypochlorite solution (NaOCl). The reactive species of free available
equilibrium of HOCl in water is dependent on whether the reaction is carried out above or below the pKa of HOCl (pKa = 7.54). For example, when the pH of the water is lower than
the pKa of HOCl, the acid is in its more reactive protonated state and as a result will react
more with species in the water. The equilibrium of HOCl in water is:
Chlorine is a strong oxidant and it acts as an electrophile, attacking areas on a molecule that are rich in electron density. Many studies have also shown that when chlorine reacts with dissolved organic matter or other organic compounds in drinking water disinfection by-products (DBPs) can be formed. Dissolved organic matter, microbiological communities and anthropogenic compounds contribute to the chlorine demand of a particular water. Chlorine demand is the dose of chlorine that can be applied to completely react with substances in the water before a residual will be present (AHPA, 1999).
have electron donating functional groups on the aromatic ring, such as acetaminophen, 17-α -ethinyl estradiol, and estrone, high reactivity with free chlorine was observed. This is the result of the BAC being in its neutral form and having the electron-donating phenol functional group on the aromatic ring, and most likely ring chlorination had occurred. Conversely, for compounds with aliphatic regions and/or very low pKa values such as
meprobamate, DEET, TCEP, and atrazine, very low reactivity was observed.
Table 1.8 Approximate Percent of Parent BAC Removed using 3.5 mg/L NaOCl as Cl2 at pH 5.5, Contact time 24 hours (Westerhoff et al., 2005)
Compound Approximate Percentage Parent BAC Removed
17-α-ethinyl estradiol 100
Acetaminophen 95
Atrazine 5
Caffeine 60
Carbamazepine 95
DEET 5
Diazepam 75
Diclofenac 100
Erythromycin-hydrate 100
Estrone 100
Gemfibrozil 100
Ibuprofen 25
Meprobamate 10
Sulfamethoxazole 100
TCEP 0
Trimethoprim 100
Disinfection using Chloramines
When hypochlorite is used as a disinfectant, natural organic matter (NOM) in the water has been found to be a precursor for disinfection by product (DBP) formation including trihalomethanes (THMs) (Rook, 1977) and haloacetic acids (HAAs) (Christman et al., 1983). Many utilities are switching to use a weaker disinfectant, chloramines, to meet DBP regulations for drinking water, under the U.S. Environmental Protection Agency Stage 1 Disinfectants and Disinfection Byproducts Rule (U.S EPA, 2001). Chloramines can exist as monochloramine or dichloramine, with the former being the primary disinfectant chosen by utilities.
Chloramines are formed during drinking water treatment by utilities first adding chlorine to the water as a primary disinfectant and then adding ammonia as a secondary disinfectant later in the treatment train. Since chloramine is a weaker disinfectant than hypochlorite it has been found to react slower with BACs and remove and/or transform them to a lesser degree (Pinkston and Sedlak, 2004).
1.1.8 Reactive sites on BACs with free chlorine
2004; Pinkston and Sedlak, 2004; Glassmeyer and Shoemaker, 2005; Ye, 2005; Bedner and MacCrehan, 2006; Nakamura et al., 2006; Dodd and Huang, 2007; Brix et al., 2008; Kotcharaksa, 2008; DellaGreca et al., 2009; Lee and Gunten, 2009; Quintana et al., 2010; Wulfeck-Kleier et al., 2010; Krkošek et al., 2011; Soh et al., 2011; Wang et al., 2011). As described in section 1.1.7 free chlorine is an oxidant and reacts non-selectively with regions of electron density and/or regions of extended π conjugation, including anthropogenic contaminants such as BACs. Aromatic regions are more likely to react with chlorine than aliphatic regions due to the electron density on the aromatic rings. Another important factor to predict the reactivity of chlorine with BACs is steric hinderence; bulkier molecules, such as atrazine and caffeine, are expected to be less reactive. In order to make predictions of the fate of BACs during disinfection, chlorination chemistry in aqueous solution will be briefly reviewed.
Substituted Benzene Rings
Table 1.9 Electrophilic Aromatic Substitution-Substituent Effects (McMurry, 2004) Substituent Reactivity Orientation Inductive Effect
-CH3 Activating Ortho, para Weak; electron-donating
-OH, -NH2 Activating Ortho, para Weak; electron-withdrawing
-Cl, Deactivating Ortho, para Strong; electron-withdrawing -N+(CH3)3 Deactivating Meta Strong; electron-withdrawing
-NO2, -CN, CHO,
-CO2CH3, -COCH3,
-CO2H
Deactivating Meta Strong; electron-withdrawing
Table 1.9 helps in the understanding of the reactions between ring-substituted BACs and an electrophile such as chlorine. For example, in a compound containing the ring-activating phenol group (-OH) it can be expected that the electrophile will substitute on the aromatic ring and this explains the high reactivity of phenol containing compounds acetaminophen, estrone, and 17-α-ethinyl estradiol in Table 1.8. This is the result of the phenol group donating electron density to the aromatic ring and making it more susceptible to electrophilic attack.
Phenols
The reaction between free chlorine, Cl2/HOCl/OCl-, and phenols under aqueous
Figure 1.3 Chlorination of 17-α-Ethynylestradiol (EE2), an Aromatic Phenol Compound
Sulfonamides
this has not yet been confirmed. In occurrence studies where only the parent BAC is targeted, the transformation products will not be detected, and the environmental and human health impact of the products may be underestimated.
Amines
When amines are chlorinated in aqueous solution, the reaction takes place via chlorine addition between the deprotonated amine and HOCl. Therefore, the reactions are dependent on the pH of the solution, and the reaction will proceed fastest between the pKa values of HOCl and the amine (Pinkston and Sedlak, 2004). Aliphatic amine groups (R2
-NH2) react with free chlorine in aqueous solutions through the transfer of chlorine from
HOCl to the amine nitrogen as is shown in Figure 1.6 (Abia et al., 1998). Chlorination of primary and secondary amines proceeds more quickly than chlorination of tertiary amines.
1.1.9 Identification of transformation products of BACs due to chlorination
Wastewater and drinking water treatment have been simulated in laboratory studies to determine whether BACs are removed or transformed into by-products during chlorination (Gould and Richards, 1984; Miyamoto et al., 1997; Dodd and Huang, 2004;Moriyama et al., 2004; Pinkston and Sedlak, 2004; Glassmeyer and Shoemaker, 2005; Ye, 2005; Bedner and MacCrehan, 2006; Nakamura et al., 2006; Dodd and Huang, 2007; Brix et al., 2008; Kotcharaksa, 2008; DellaGreca et al., 2009; Lee and Gunten, 2009; Quintana et al., 2010; Wulfeck-Kleier et al., 2010; Krkošek et al., 2011; Soh et al., 2011; Wang et al., 2011). Determining if BACs are removed or transformed is important to accurately assess the risk that these compounds pose to environmental and human health. BACs that are not removed, but transformed into new products may have unknown health outcomes, and it is important to gain a greater understanding of these potential risks. These reactions are usually conducted in aqueous media and use an initial molar excess of chlorine to BAC in order to simulate treatment conditions. Determining the fate of BACs during drinking water treatment is a challenging task that requires the use sophisticated analytical instruments such as liquid chromatography or gas chromatography paired with detection such as: ultraviolet (UV), mass spectrometry (MS), nuclear magnetic resonance (NMR), or post-column reaction/reductive electrochemistry.
initially to determine product formation and then followed by a separate LC-MS analysis to determine the identity of transformation products in many experiments. A limitation of LC is that transformation products may not elute off the analytical column and the products will remain undetected, and a limitation of using MS analysis is that the transformation products may not ionize to a great degree. Another technique used to determine the structure of transformation products and mechanism of reaction is to perform sub-structure analysis where sub-structures of the parent compound are reacted with free chlorine to determine the reactive sites (Dodd and Huang, 2004; Dodd and Huang, 2007). Commercially available standards have been used to compare to potential transformation products of BACs with chlorine (Bedner and MacCrehan, 2006).
A mass spectrometer, an extremely sensitive analytical instrument, can be used to determine the identity of transformation products. Ionization sources that have been used are both electrospray ionization (ESI) and atmospheric pressure chemical ionization (APCI). Techniques include full scan mass spectrometry to gather information on all ions that are ionized in the MS. Additionally chlorine isotope ratios can be used to determine the number of chlorine substituents that are on a molecule.
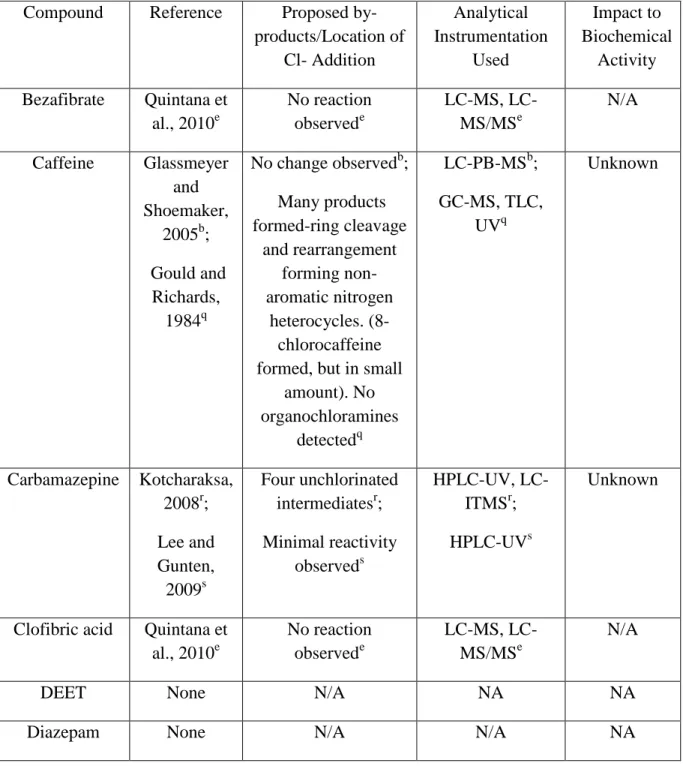
some BACs due to aqueous chlorination and the impact of these by-products on biological effect is shown in Table 1.10.
Table 1.10 Transformation of BACs in Reactions with Free Chlorine and Impact on Biological Effect
Compound Reference Proposed by-products/Location of Cl- Addition Analytical Instrumentation Used Impact to Biochemical Activity 17-α-ethinyl
estradiol
Nakamura et al., 2006k; Moriyama et al., 2004l
Three mono- and di- chlorinated derivatives
isolated (carried out in organic solvent)k;
Mono- and di-chlorinated products
formed (major) and four other minor
productsl
FAB-MS, 1H NMR, 13C NMR,
HPLC-UV, preparative HPLCk; Preparative HPLC-UV,
LC-(+/-)-APCI-MS, 1H NMR,
13
C NMRl
Yeast assays revealed chlorinated products less estrogenic than parent (more than BPA)k; ELISA test kit
used for estrogen receptor and showed that mono-Cl product had similar activity and di-Cl was less
Table 1.10 (continued) Transformation of BACs in Reactions with Free Chlorine and Impact on Biological Effect
Compound Reference Proposed by-products/Location
of Cl- Addition
Analytical Instrumentati on Used Impact to Biochemical Activity Acetaminophen Glassmeyer
and Shoemaker, 2005b Bedner and MacCrehan, 2006i
Mono- and di- Cl- addition to aromatic
ring, 1,4-benzoquinone and
N-acetyl-p-benzoquinone; transform back to acetaminophen with
sodium sulfitei; mono- and di- chlorinated ring
productsb
UV, LC- UV-(+)-ESI-MS,
LC-UV-ECi;
LC-MSb
LD50 toxicity
testing in mouse reveals transformation products much
more toxici
Atenolol DellaGreca et al., 2009f
N-chlorination; de-chlorinated upon addition of sodium
thiosulfatef HPLC-UV, HPLC-MS, 1 H NMR, TLC, (+)-ESI-LC-MSf Chlorinated products more phytotoxic than atenololf
Atrazine Wulfeck-Kleier et. al.,
2010m; Brix et al.,
2008n
N-chloro atrazine, transforms back to
Atrazine with sodium sulfite and
ascorbic acid (ammonium chloride does not reform Atrazine)m;
No reaction observedn
GC-MS,
HPLC-(+)-ESI-MS, HPLC-UVm;
UPLC-Q-ToF-MS/MS using Masslynx software (Waters Corp)n Chlorinated product retains
s-chlorotriazine moietym which is
the cause of toxicity (EPA,
2006) not yet studied; Toxicity of
other chlorinated triazines studied
Table 1.10 (continued) Transformation of BACs in Reactions with Free Chlorine and Impact on Biological Effect
Compound Reference Proposed by-products/Location of Cl- Addition Analytical Instrumentation Used Impact to Biochemical Activity Bezafibrate Quintana et
al., 2010e
No reaction observede
MS, LC-MS/MSe
N/A
Caffeine Glassmeyer and Shoemaker,
2005b; Gould and
Richards, 1984q
No change observedb; Many products formed-ring cleavage and rearrangement forming non-aromatic nitrogen heterocycles. (8-chlorocaffeine formed, but in small
amount). No organochloramines
detectedq
LC-PB-MSb; GC-MS, TLC,
UVq
Unknown
Carbamazepine Kotcharaksa, 2008r; Lee and Gunten, 2009s
Four unchlorinated intermediatesr; Minimal reactivity
observeds
HPUV, LC-ITMSr; HPLC-UVs
Unknown
Clofibric acid Quintana et al., 2010e
No reaction observede
MS, LC-MS/MSe
N/A
DEET None N/A NA NA
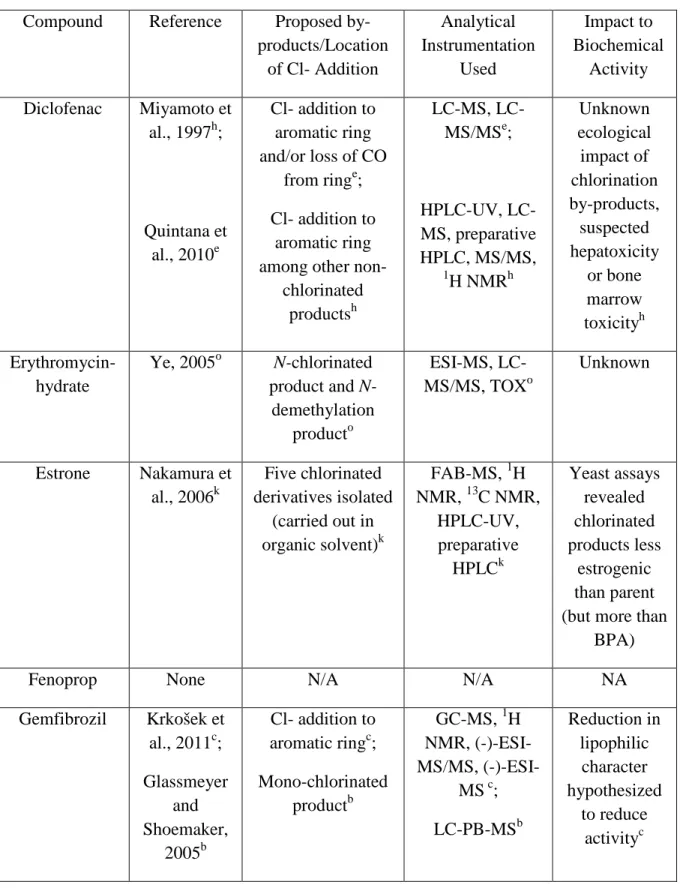
Table 1.10 (continued) Transformation of BACs in Reactions with Free Chlorine and Impact on Biological Effect
Compound Reference Proposed by-products/Location
of Cl- Addition
Analytical Instrumentation Used Impact to Biochemical Activity Diclofenac Miyamoto et
al., 1997h;
Quintana et al., 2010e
Cl- addition to aromatic ring and/or loss of CO
from ringe; Cl- addition to
aromatic ring among other
non-chlorinated productsh
MS, LC-MS/MSe;
HPUV, LC-MS, preparative HPLC, MS/MS,
1
H NMRh
Unknown ecological impact of chlorination by-products, suspected hepatoxicity or bone marrow toxicityh Erythromycin-hydrate
Ye, 2005o N-chlorinated product and N-demethylation
producto
ESI-MS, LC-MS/MS, TOXo
Unknown
Estrone Nakamura et al., 2006k
Five chlorinated derivatives isolated
(carried out in organic solvent)k
FAB-MS, 1H NMR, 13C NMR,
HPLC-UV, preparative HPLCk Yeast assays revealed chlorinated products less estrogenic than parent (but more than
BPA)
Fenoprop None N/A N/A NA
Gemfibrozil Krkošek et al., 2011c; Glassmeyer
and Shoemaker,
2005b
Cl- addition to aromatic ringc; Mono-chlorinated
productb
GC-MS, 1H NMR, MS/MS,
Table 1.10 (continued) Transformation of BACs in Reactions with Free Chlorine and Impact on Biological Effect
Compound Reference Proposed by-products/Location
of Cl- Addition
Analytical Instrumenta -tion Used Impact to Biochemical Activity Ibuprofen Pinkston and
Sedlak, 2004d; Quintana et
al., 2010e
No reaction observedd,e
LC-MS, LC-MS/MSe; HPLC-UVd
NA
Meprobamate None N/A N/A NA
Sucralose Soh et al., 2011g
No reaction observedg
LC-MSg NA
Sulfamethoxazole Dodd and Huang, 2004j
Degradation of sulfonamide moiety with excess of FAC to form 3-amino-5-methylisoxazoleand
N-chloro-p-benzoquinoneiminej
LC-MS; 1H NMR,
GC-EI-MSj
Reduction of antibiotic activity hypothesized due to alteration of antibiotic moietyj
TCEP None N/A N/A NA
Tetracycline Wang et al., 2011p; Ye, 2005o
Cl- and OH- substituted products
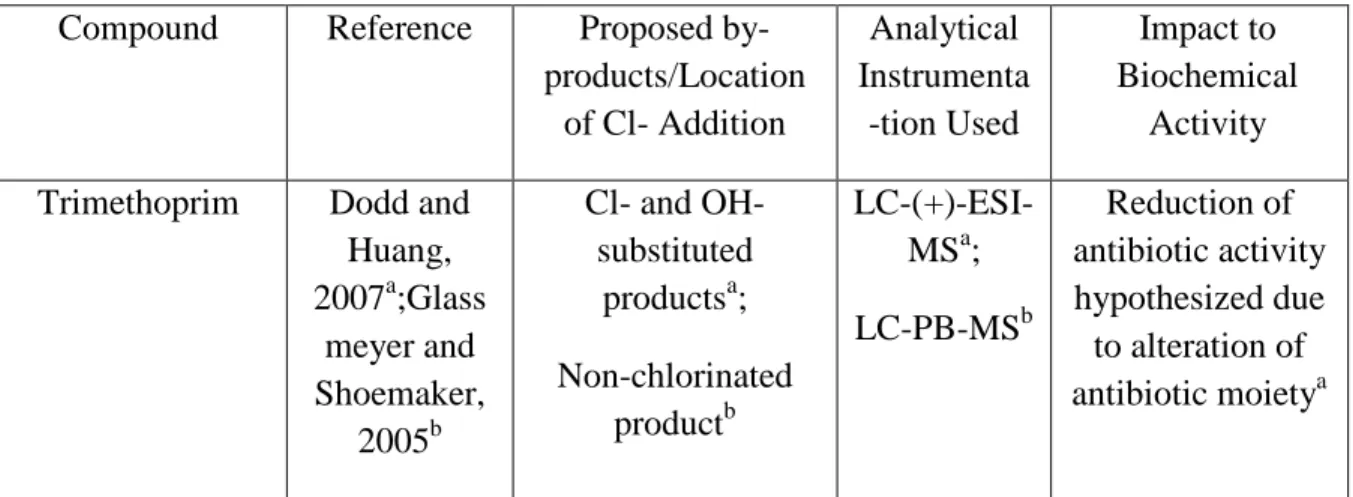
Table 1.10 (continued) Transformation of BACs in Reactions with Free Chlorine and Impact on Biological Effect
Compound Reference Proposed by-products/Location
of Cl- Addition
Analytical Instrumenta -tion Used Impact to Biochemical Activity Trimethoprim Dodd and
Huang, 2007a;Glass
meyer and Shoemaker,
2005b
Cl- and OH-substituted productsa; Non-chlorinated
productb
LC-(+)-ESI-MSa; LC-PB-MSb
Reduction of antibiotic activity hypothesized due to alteration of antibiotic moietya
(a) Dodd and Huang, 2007; (b) Glassmeyer and Shoemaker, 2005; (c) Krkošek et al., 2011; (d) Pinkston and Sedlak, 2004; (e) Quintana et al., 2010; (f) DellaGreca et al., 2009; (g) Soh et al., 2011; (h) Miyamoto et al., 1997; (i) Bedner and MacCrehan, 2006; (j) Dodd and Huang, 2004; (k) Nakamura et al., 2006; (l) Moriyama et al., 2004; (m) Wulfeck-Kleier et. al., 2010; (n) Brix et al., 2008; (o) Ye, 2005; (p) Wang et al., 2011; (q) Gould and Richards, 1984; (r) Kotcharaksa, 2008; (s) Lee and Gunten, 2009
1.1.10 Policies
(MCLG)/Maximum Contaminant Level (MCL) in drinking water of 0.003mg/L (U.S. EPA, 2009a). Also part of the SDWA are the National Secondary Drinking Water Regulations (NSDWRs) which contain a list of contaminants in water which may cause either aesthetic or taste/odor/color problems. As part of the NSDWRs these contaminants are recommended for regulation in individual states by the Federal Government.
Under the SDWA there is also a list of unregulated chemicals called the Candidate Contaminant List 3 (CCL3) (U.S. EPA, 2009b) which was created to prioritize scientific research and policy making. This daunting task is completed by screening a large set of unregulated contaminants for potential health effects and occurrence in drinking water supplies and selecting the ones with the greatest potential to pose a public health risk. The CCL3 contains a list of 116 chemical and microbial contaminants that are currently unregulated under the NPDWRs, are known to be in drinking water, and may require regulation under the SDWA. Included on this list are the steroid hormones 17-α-ethinyl estradiol and estrone (U.S. EPA, 2009b).
In March 2010 the EPA launched a new system to help protect public health and drinking water supplies called the Drinking Water Strategy (DWS). The program’s objective was to focus decision-making, increase protection of water, and promote advancement of research to determine effective treatment technologies for public water supplies (U.S. EPA, 2010). The four goals of the DWS are to: 1) address contaminants as groups 2) encourage new drinking water treatment technologies 3) link authority of other statutes to apply to drinking water, and 4) work with states to share monitoring results (U.S. EPA, 2010).
and the USGS. The FDA is responsible for the regulation of food, medicines cosmetics and other products. The USGS conducts scientific research including national occurrence sampling studies of U.S. drinking water sources (Kolpin et al., 2002; Focazio et al., 2008). Despite agency efforts to highlight the presence of BACs in the environment, opposition from industry makes regulation difficult as, for example, the regulation of spray drifts from the application of atrazine to agricultural lands. Although environmental regulators desire to set stricter regulations to protect water resources, the agricultural industry prioritizes maintaining high product yields and protecting job security (Erickson, 2011).
1.1.11 Future management strategies
It is clear that the impact of BAC residues in the environment is not an issue that can be ignored. Recent media reports, (e.g., Shah, 2010), have highlighted dramatic events linked to BAC use such as mass die-offs of vultures in Asia due to ingestion of the anti-arthritic drug diclofenac (Oaks et al., 2004), antibiotic-resistant pathogens (Khachatourians, 1998), and the feminization of fish due to estrogenic compounds (Jobling et al., 1998). Additionally, the herbicide atrazine has also been in the media spotlight due to the re-evaluation of its toxicity in order to set regulatory limits.
and policy and management experts from the US, Canada and Europe evaluated possible options (Doerr-MacEwen and Haight, 2006). The opinions from the stakeholders were that the most effective management strategies to minimize the release of BACs were advanced wastewater treatment processes, education to reduce over prescription, pharmaceutical take-back programs, and public education (Doerr-MacEwen and Haight, 2006). The stakeholders also indicated that some of the gaps in scientific research were the uncertainties associated with mixture effects, low level chronic exposure, and risk assessment methods (Doerr-MacEwen and Haight, 2006). Additional management strategies that may reduce the release of BACs into the environment are regulation of prescription drug sales over the internet, careful monitoring of sewage biosolids used for land application, and development of more effective WWTP technologies to remove BACs (Daughton and Ternes, 1999).