A Compendium of Chromatin Contact Maps Reveal Spatially
Active Regions in the Human Genome
Anthony D. Schmitt1,2,10,*, Ming Hu3,11,*,#, Inkyung Jung1,12, Zheng Xu4,13, Yunjiang Qiu1,5,
Catherine L. Tan1,10, Yun Li4, Shin Lin6, Yiing Lin7, Cathy L. Barr8, and Bing Ren1,9,#
1Ludwig Institute for Cancer Research, La Jolla, CA 92093, USA
2UCSD Biomedical Sciences Graduate Program, 9500 Gilman Drive, La Jolla, CA 92093, USA
3Department of Population Health, Division of Biostatistics, New York University School of
Medicine, 650 First Avenue, New York, NY 10016, USA
4Departments of Genetics, Biostatistics, and Computer Science, University of North Carolina,
Chapel Hill, NC 27599, USA
5USCD Bioinformatics and Systems Biology Graduate Program, 9500 Gilman Drive, La Jolla, CA
92093, USA
6Department of Medicine, Division of Cardiology, University of Washington, 850 Republican
Street, Seattle, WA 98108, USA
7Department of Surgery, Washington University School of Medicine, 660 S Euclid Ave, Campus
Box 8109, St. Louis, MO 63110, USA
8Krembil Research Institute University Health Network, the Hospital for Sick Children, and The
University of Toronto, Krembil Discovery Tower, 60 Leonard Ave. 8KD-412, Toronto, ON, M5T 2S8, Canada
9Department of Cellular and Molecular Medicine, Moores Cancer Center and Institute of Genome
Medicine, UCSD School of Medicine, 9500 Gilman Drive, La Jolla, CA 92093, USA
Summary
#Correspondence: Ming Hu ([email protected]) and Bing Ren ([email protected]).
10Current address - Arima Genomics Inc., 6404 Nancy Ridge Dr., San Diego, CA, 92121, USA
11Current address - Department of Quantitative Health Sciences, Lerner Research Institute, Cleveland Clinic Foundation, 9500 Euclid Avenue, Cleveland, OH 44195, USA
12Current address - Department of Biological Sciences, KAIST, Daejeon 34141, South Korea
13Current address - Department of Statistics, Quantitative Life Sciences Initiative, University of Nebraska, Lincoln, NE 68583, USA *These authors contributed equally
Lead Contact: Bing Ren
Accession Number: GSE87112
Author Contributions: Conceptualization, A.D.S, M.H., and B.R; Formal Analysis, M.H., A.D.S., Z.X., I.J., and Y.Q.; Investigation,
A.D.S. and C.L.T.; Resources, C.B., S.L., and Y.L.; Writing – Original Draft, A.D.S., M.H., and B.R.; Writing – Review and Editing, A.D.S., M.H., and B.R.
Supplemental Information: Please see separate supplemental materials information.
Publisher's Disclaimer: This is a PDF file of an unedited manuscript that has been accepted for publication. As a service to our
HHS Public Access
Author manuscript
Cell Rep
. Author manuscript; available in PMC 2017 June 20.Published in final edited form as:
Cell Rep. 2016 November 15; 17(8): 2042–2059. doi:10.1016/j.celrep.2016.10.061.
A
uthor Man
uscr
ipt
A
uthor Man
uscr
ipt
A
uthor Man
uscr
ipt
A
uthor Man
uscr
The three-dimensional configuration of DNA is integral to all nuclear processes in eukaryotes, yet our knowledge of the chromosome architecture is still limited. Genome-wide chromosome conformation capture studies have uncovered features of chromatin organization in cultured cells, but genome architecture in human tissues has yet to be explored. Here, we report the most comprehensive survey to date of chromatin organization in human tissues. Through integrative analysis of chromatin contact maps in 21 primary human tissues and cell types, we found
topologically associating domains highly conserved in different tissues. We also discover genomic regions that exhibit unusually high levels of local chromatin interactions. These frequently interacting regions (FIREs) are enriched for super-enhancers and are near tissue-specifically expressed genes. They display strong tissue-specificity in local chromatin interactions. Additionally, FIRE formation is partially dependent on CTCF and the Cohesin complex. We further show that FIREs can help annotate function of non-coding sequence variants.
Graphical abstract
Schmitt et al. analyze Hi-C maps in 21 human cell lines and primary tissues and uncover a class of genome organizational features termed FIREs. FIREs are local interaction hotspots, are highly tissue-specific, and correspond to active enhancers. We discuss the implications of our findings for the study of gene regulation and disease. Explore the Cell Press IHEC webportal at www.cell.com/ consortium/IHEC.
Introduction
Chromosome conformation capture (3C)-based techniques have begun to reveal molecular details of nuclear organization in eukaryotic cells (Dekker et al., 2002; Dixon et al., 2012, 2015; Dostie et al., 2006; Fraser et al., 2015; Jin et al., 2013; Lieberman-Aiden et al., 2009; Rao et al., 2014; Seitan et al., 2013; Simonis et al., 2006; Sofueva et al., 2013; Vietri Rudan et al., 2015; Zuin et al., 2014). It is now clear that each chromosome occupies a separate space in the interphase nucleus, known as “chromosome territory”, which is partitioned into
A
uthor Man
uscr
ipt
A
uthor Man
uscr
ipt
A
uthor Man
uscr
ipt
A
uthor Man
uscr
distinct neighborhoods or compartments (Lieberman-Aiden et al., 2009; Meaburn and Misteli, 2007). Within each compartment, topologically associating domains (TADs) constrain chromatin interactions (Dixon et al., 2012, 2016; Nora et al., 2012; Sexton et al., 2012). Within each TAD, chromatin interactions between distal cis regulatory elements occur in a cell type dependent manner to allow modulation of promoter activity by
enhancers (Dryden et al., 2014; Montavon and Duboule, 2013; Phillips-Cremins et al., 2013; Simonis et al., 2006; Tang et al., 2015). Previous 3D genome analyses have been largely limited to cultured cells and a small collection of primary cell types. By contrast, our knowledge of chromatin organization in human tissues is still scarce. Variation in chromatin interaction patterns among diverse tissue types remains poorly defined, and its functional relationship with gene regulation remains to be characterized. This is a critical shortcoming since diseases pertaining to specific organ systems are often not easy to recapitulate in vitro. Therefore, systematic characterization of chromosome architecture across a broad set of well-annotated primary tissues could be of great value for further study of genome function.
Recent studies of chromatin modification landscapes across a large number of human tissues and cell types have greatly improved our understanding of genome function and regulation (The ENCODE Project Consortium, 2012; The Roadmap Epigenomics Consortium, 2015). The research has revealed that over 12% of the genome possess cell type specific chromatin signatures consistent with them acting as cis-regulatory sequences. However, to better understand how these DNA sequences contribute to tissue- and cell-type specific gene expression patterns, it is necessary to characterize the chromatin architecture in each tissue. Here, we report integrative analysis of chromatin organization maps of 14 human tissues and 7 human cell lines for which complete epigenome datasets have been generated by the Epigenome Roadmap Consortium, ENCODE, or the NICHD (The ENCODE Project Consortium, 2012; The Roadmap Epigenomics Consortium, 2015). We developed a
computational method to discover the spatially active chromatin segments termed Frequently Interacting Regions (FIREs). We find FIREs are enriched for active enhancer regions, harboring super-enhancers as well as disease-associated variants in the corresponding disease-relevant tissue type. In addition, FIREs are substantially conserved between human and mouse genomes of the same cell type, and their formation depends in part on the Cohesin complex and CTCF. Finally, most FIREs exhibit promiscuous interactions in the local chromatin neighborhood. These observations improve our understanding of the role of dynamic chromatin organization in the regulation of tissue-specific gene expression programs in human cells.
Results
A compendium of chromatin organization maps across 21 human cell and tissue types
We conducted Hi-C analysis on 14 primary human tissues collected from four donors (Figure 1a) for which epigenome datasets had been produced as part of the NIH Epigenome Roadmap project (The Roadmap Epigenomics Consortium, 2015). We combined the resulting datasets with those previously generated by us for seven cultured cell types using a common experimental protocol and reported separately (Dixon et al., 2012, 2015; Jin et al., 2013; Selvaraj et al., 2013). The combined datasets were processed using a common data
A
uthor Man
uscr
ipt
A
uthor Man
uscr
ipt
A
uthor Man
uscr
ipt
A
uthor Man
uscr
processing pipeline, after merging data from biological replicates deemed as reproducible (Figure S1a-e). Collectively, we analyzed >8.6 billion unique contacts, out of which >2.5 billion were long-range (>15kb) intra-chromosomal contacts, with 809M unique contacts and 254M range cis contacts per cell line, and 214M unique contacts and 53M long-range cis contacts per tissue type (Table S1). We first analyzed compartment A/B patterns in each tissue/cell type (Table S2, Figure 1b). As previously reported for cultured human cells (Dixon et al., 2015), we observed substantial compartment A/B switching across primary tissues (Figure 1b, c), finding that 59.6% of the genome is dynamically compartmentalized in different tissues and cell types. These data also underscore the significant degree of compartment conservation across the genome, revealing that as much as 40.4% of the genome is invariant, a statistically significant degree of invariant genome
compartmentalization (Chi-square test p-value <2.2e-16) (Figure S1f).
TADs have been reported to be stable across different cell types and experimental conditions and conserved in related species (Dixon et al., 2012, 2015; Rao et al., 2014; Zuin et al., 2014). To investigate the degree of TAD boundary conservation in primary human tissues, we applied the insulation score method (Crane et al., 2015), which is robust to sequencing depth (Figure S1g-i), to identify TAD boundaries at 40kb bin resolution (Table S3). We identified a total of 3,010 distinct TAD boundaries in 21 samples (14 tissues and 7 cell lines). Upon careful inspection of a broad panel of genetic loci (Figure 1a, d) as well as systematic comparison across samples (Figure 1d, e), we find that TAD boundaries are indeed highly conserved across different cell lines and tissues. These results are highly significant, considering that by chance only 1.7% of TAD boundaries are expected to share for all (Chi-square test p-value < 2.2e-16).
Identification of Frequently Interacting Regions in the human genome
As a means to investigate conserved and tissue-specific chromatin interactions, we first used Fit-Hi-C (Ay et al., 2014) to identify significant chromatin interactions at various
significance thresholds (Table S4, Supplemental File). However, Fit-Hi-C, like other peak-calling methods (Jin et al., 2013; Rao et al., 2014; Xu et al., 2015, 2016), is sensitive to sequencing depth, and therefore we found considerable variation in total chromatin contacts between samples, precluding any statistically rigorous comparative peak-calling analysis across tissues. However, upon closer examination of the chromatin contacts near the contact matrix diagonal (+/- 200kb from the matrix diagonal), we noticed that some regions exhibit unusually high levels of local contact frequency in a tissue type dependent manner (Figure 2a). We therefore developed a computational approach to normalize and compare local interaction frequencies across all 21 tissues and cell types. Specifically, we developed a Poisson regression based normalization approach (termed as “HiCNormCis”) to normalize the total raw local (15-200kb) cis contacts for each 40kb bin genome-wide (Figure S2a, Supplemental Methods). This method removes bias from three sources known to affect Hi-C data, including effective restriction fragment lengths, GC content and sequence mappability (Hu et al., 2012; Yaffe and Tanay, 2011). Compared to other normalization approaches such as HiCNorm (Hu et al., 2012), vanilla coverage (Lieberman-Aiden et al., 2009) and ICE (Imakaev et al., 2012), HiCNormCis achieved the best performance for bias removal (Figure S2b). Lastly, we used a Gaussian distribution to approximate the normalized total local cis
A
uthor Man
uscr
ipt
A
uthor Man
uscr
ipt
A
uthor Man
uscr
ipt
A
uthor Man
uscr
contacts (Figure S2c), and converted HiCNormCis output values to –ln(p-value), which we define as the final “FIRE score”. FIREs (also termed “FIRE bins”) are therefore defined as bins with one-sided p-value less than 0.05, corresponding to –ln(p-value) greater than 3 (Figure 2a). We found that our FIRE scores were highly reproducible (Figure S2d, e), and robust to sequencing depth (Figure S2a, f), choice of restriction enzymes in Hi-C library preparation (Figure S2g, h), as well as choice of experimental protocols such as dilution Hi-C or in situ Hi-Hi-C (Figure S2i).
We first identified FIREs in GM12878 and IMR90 cells (Figure 2a, b). Global analysis of FIREs revealed a dispersed distribution along the genome (Figure 2b). We next determined FIREs in the remainder of tissues and cell lines (Table S5, S6), after removing local genomic feature biases (Figure S2j). We then explored how FIREs are positioned in relation to A or B compartments, as well as in relation to TAD boundaries (not chromatin “loops”). Careful inspecting FIRE positioning and genome-wide enrichment analyses indicated that FIREs are enriched in compartment A and depleted in compartment B (Figure 2c-d, Table S7). We also examined the FIRE distribution within TADs, and found that FIREs are depleted near TAD boundaries and enriched within TADs and toward the TAD center (Figure 2e, f).
FIREs, chromatin loops, and insulated neighborhoods
We further analyzed FIREs at 5kb resolution using previously published in situ Hi-C data in IMR90 and GM12878 (Rao et al., 2014), and compared FIRE positioning relative to the smaller (∼185kb) chromatin “loops”. As expected, FIREs are significantly enriched for chromatin loop anchors (Chi-square test p value < 2.2e-16), however, ∼90% of FIREs are within loops, and these FIREs demonstrate unique properties to be discussed in a following section. Our data indicate that FIREs are hotspots of local chromatin interactions that are distinct from compartments, TADs, and now loops (Rao et al., 2014) (Rao et al., 2014), which are generally anchored by convergent CTCF binding. By contrast, most FIREs are located within TADs and chromatin loops, indicating they represent specific loci “within the loop” at higher resolution. Similarly, FIREs are likely distinct from insulated neighborhoods, due to the high positional overlap between the CTCF-mediated “chromatin loops” and “insulated neighborhoods” (Ji et al., 2016). Our analysis of FIREs and insulated
neighborhoods at 40kb resolution in H1 cells indicates that insulated neighborhoods are also enriched for FIREs (Chi-square test p value = 5.32e-15), but >70% of insulated
neighborhoods do not contain a FIRE (Figure S3d) (also discussed more below).
FIREs are tissue-specific and located near cell identity genes
To characterize the tissue-specificity of FIREs, we combined all 21 datasets (7 cell lines and 14 tissues), and performed comparative analysis (Figure 3a, Table S6). Approximately 38.8% (8,142/20,974 bins) of FIREs were identified in only one tissue or cell type, and approximately 57.7% (12,094/20,974 bins) of FIREs were identified in two or fewer, revealing the highly tissue-specific nature of FIREs (Figure S2k). Further, hierarchical clustering analysis of genome-wide FIRE scores revealed similarities among certain cell types, such as H1 and MES, as well as MSC and IMR90 (Dixon et al., 2015) (Figure 3a). As expected, tissues from the same organ (brain: cortex and hippocampus; heart: left ventricle and right ventricle) clustered together (Figure 3a). Tissue-specific FIREs tend to be
A
uthor Man
uscr
ipt
A
uthor Man
uscr
ipt
A
uthor Man
uscr
ipt
A
uthor Man
uscr
positioned in close proximity to genes related to the cellular identity (Figure 3b, c). For example, within a GM12878-specific FIRE is the promoter for CD70, a gene well known for its role in immune cell activation and maturation (Arens et al., 2004). (Figure 3b). Moreover,
∼110kb from of a FIRE region present only in brain tissues is an alternative ROBO1 promoter – a gene involved in axon guidance during development (Leyva-Díaz et al., 2014) (Figure 3c). To extend these observations to all tissue-specific FIREs and to interpret the functional roles and disease relatedness of these FIREs, we performed GREAT analysis (McLean et al., 2010) (Tables S8-9). The results showed that genes in close proximity to tissue-specific FIREs are related to the functionality of that tissue/cell type (Figure 3d, e; Tables S8-9). Moreover, using only our 5kb resolution FIRE calls in GM12878 and IMR90, we also found abundant sample-specific FIREs (∼57% of FIREs are sample-specific), and confirmed that sample-specific FIREs are positioned near cell identity genes (Table S8-9) at higher resolution. Collectively, these results suggest that FIREs are closely associated with cell identity and tissue function.
FIREs are enriched for active enhancers and super-enhancers
Since FIREs tend to be positioned near genes related to cell identity and tissue function, we posited that FIREs may be enriched for active enhancers. To test this hypothesis, we analyzed previously generated ChIP-Seq data for six histone modifications (H3K27ac, H3K4me1, H3K4me3, H3K36me3, H3K27me3 and H3K9me3) for these tissues/cell types (The Roadmap Epigenomics Consortium, 2015). We observed that FIREs display a high density of active chromatin features (eg. H3K27ac, H3K4me1), and overlap with super-enhancers found in the same tissues (Hnisz et al., 2013) (Figure 4a). We then characterized the histone modification signatures across 1Mb regions centered at FIREs. FIREs are ubiquitously enriched for two active enhancer marks, H3K4me1 and H3K27ac, and depleted for the repressive chromatin mark H3K27me3 (Figure 4b), while enrichment of other marks did not show clear patterns (Figure S3a). FIREs also overlap with typical enhancers and super-enhancers (Hnisz et al., 2013) annotated in the cell lines and tissues where such data are available (Figure 4c, d). For example, 35.0% of typical enhancers, and 77.8% of super-enhancers annotated in GM12878 cells overlap FIREs (Fisher's exact test p-value < 2.2e-16) (Figure 4c, d). Importantly, we also found significant enrichment for FIREs at typical enhancers and super-enhancers (Chi-square test p value <2.2e-16) when analyzing FIREs at 5kb bin resolution (Table S6) using previously published high resolution Hi-C data in GM12878 and IMR90 (Rao et al., 2014) (Figure S3b). Also, with respect to previously annotated chromatin loops (Rao et al., 2014), we find that the aforementioned 90% of FIREs that do not overlap loop anchors are also significantly enriched for typical and
super-enhancers (Chi-square test p value <2.2e-16). For example, we observed GM12878-specific FIREs corresponding to a GM12878-specific super-enhancer, while the same locus in IMR90 lacks any enhancer or FIRE, despite sharing a conserved chromatin loop (Figure S3c). These FIRE analyses at 5kb resolution corroborate our findings at 40kb resolution, and indicate that FIREs represent distinct structural entities with differing biochemical properties compared to chromatin loops. As anticipated, we also find a significant overlap between FIREs and super-enhancer domains in mESCs at 40kb resolution (Chi-square test p value = 0.0052), but not polycomb domains (Dowen et al., 2014; Ji et al., 2016), further
underscoring the role of FIREs in active gene regulation (Figure S3d).
A
uthor Man
uscr
ipt
A
uthor Man
uscr
ipt
A
uthor Man
uscr
ipt
A
uthor Man
uscr
Since many FIRE bins were found in clusters, we stitched together adjacent FIRE bins and ranked them by cumulative Z-score, revealing that a small proportion of FIRE clusters (termed “super-FIREs”) contain the majority of bins with the most significant local interaction frequency (Figure S3e). Strikingly, compared to all FIREs (Figure S3f), we observed some tissues in which nearly 100% of super-FIREs contain either a super-enhancer or typical enhancer (Figure S3g), suggesting that the bins with the highest local interaction frequency almost always mark active enhancer(s). Analysis of super-FIREs not containing an enhancer revealed a moderate enrichment for H3K27me3 across most testable samples, but no other clear trends (Figure S3h-m). Given this striking relationship, we wondered to what extent FIRE analysis could be used to predict the locations of typical and super-enhancers in GM12878. By varying the significance thresholds for FIRE calling and performing a ROC AUC analysis, we find an impressive predictive power of FIRE analysis to identify typical enhancers and super-enhancers using Hi-C data alone (AUC=0.813, AUC=0.906, respectively) (Figure S3n, o). Taken together, the high overlap between super-enhancers and FIREs, as well as the enrichment of tissue identity genes near tissue-specific FIREs implicates a potential cis-regulatory role for FIREs in facilitating tissue-specific gene expression.
FIREs are near tissue-specifically expressed genes
Since super-enhancers are known to be tissue-specific and positioned near cell identity genes, we asked if FIREs are nearby genes that are more transcriptionally active in the corresponding tissue/cell types. By re-analyzing publicly available RNA-Seq data (The Roadmap Epigenomics Consortium, 2015), we indeed found a strong correlation between cell/tissue-specific FIREs and cell/tissue-specific expression of nearby genes. For example, the GRIN2A gene, which encodes an important ligand- and voltage-gated N-methyl-D-asparate (NMDA) receptor subunit implicated in epilepsy (Kingwell, 2013) and
schizophrenia (Ohi et al., 2016), is predominantly expressed in brain tissues and the TSS is
∼197kb from a brain-specific FIRE (Figure 4e). In GRIN2A, the relative gene expression in cortex (CO) is the highest among all tissues (Figure 4f, see Supplemental Methods). We also calculated the relative gene expression for each gene within 200kb of a tissue-specific FIRE across all tissues and found significant correlation between specific FIREs and tissue-specifically expressed genes (Figure S3p). For example, we found that the GM12878-specific FIRE gene set contained genes with significantly higher relative expression in GM12878, compared to any other FIRE gene set (two sample t test p-value < 9.26e-6) (Figure S3p).
Intrigued by these observations in brain tissue and lymphoblast cells, we applied a more systematic mean-rank gene set enrichment test (see Supplemental Methods) to further understand the relationship between FIREs and gene expression patterns. For example, in cortex tissue, there is a clear difference between the mean ranks of genes neighboring Brain-specific FIREs compared to random FIRE positioning (Figure 4g, h). Importantly, this type of analysis can be used to study the extent to which tissue-specific FIRE genes are expressed by testing all combinations of relative expression rank lists and tissue-specific FIRE gene sets (Figure 4g). In other words, if tissue-specific FIRE genes are primarily expressed in that same sample, the enrichment signal should track the diagonal of an all by all comparison
A
uthor Man
uscr
ipt
A
uthor Man
uscr
ipt
A
uthor Man
uscr
ipt
A
uthor Man
uscr
(Figure 4g), and generally lower enrichment off the diagonal where the sample for the rank-list and FIRE gene set are different. Indeed, we observed this trend, although the NPC-specific FIRE gene set is ranked higher in Cortex and Hippocampus, which may be expected given that they prominently consist of neuronal cells or neural progenitors. Taken together, our results suggest that tissue-specific FIREs are likely involved in tissue-specific gene expression.
FIREs are conserved in human and mouse
If FIREs play a role in gene regulation and developmental programs, one would expect that such chromatin features would be conserved evolutionarily (Dixon et al., 2012, 2015; Rudan et al., 2015). To test this hypothesis, we compared FIREs between human and mouse in three different cell types (embryonic stem cells, neural progenitor cells and cortex tissue) (Dixon et al., 2012, 2015; Fraser et al., 2015; Shen et al., 2012). We found that FIREs are significantly conserved in these comparisons (Figure 5a). Specifically, 33.0% of human cortex FIREs are also FIREs in mouse cortex, while only 8.7% is expected by chance (Fisher's exact test p-value < 2.2e-16). For example, returning to the ROBO1 locus, we found that both mouse and human cortex have only one FIRE bin in the 2Mb region around ROBO1, and the single FIRE position is conserved across species (Figure 5b). Interestingly, the degree of FIRE conservation between human and mouse is the highest in cortex tissue and less, although statistically significant, in embryonic stem cells and neural progenitor cells (ESC p value < 5.0e-16; NPC p value < 2.2e-16, Fisher's exact test) (Figure 5a). More generally, by randomly sampling syntenic bins across a range of FIRE scores, we find a modest yet significant correlation of FIRE score between human and mouse in each cell type (Pearson correlation coefficient = 0.20∼0.42, p value < 2.2e-16) (Figure S4a-f). These data indicate a tendency for the local contact frequency to be conserved in syntenic regions throughout the human and mouse genome, as well as conservation of the strongest locally interacting hotspots.
CTCF and Cohesin complex contribute to establishment of FIREs
We posited that FIREs might be mediated by the Cohesin complex, which has been
previously shown to modulate enhancer/promoter interactions in mammalian cells (Kagey et al., 2010). To test this hypothesis, we re-analyzed three previously published Hi-C datasets, in which a Cohesin subunit was experimentally depleted in human or mouse cells (Seitan et al., 2013; Sofueva et al., 2013; Zuin et al., 2014), and investigated FIRE scores upon loss of a Cohesin subunit. We began by systematically examining the Hi-C datasets generated in HEK293 cells before and after depletion of the Cohesin subunit, SMC3 (Figure 5c). Since Cohesin complex is frequently bound together with CTCF throughout the genome, we focused our analysis to CTCF-only binding sites and CTCF/SMC3 co-bound peaks. SMC3-only peaks were ignored since SMC3-only ∼0.7% of SMC3 peaks overlapping FIREs were not co-occupied with CTCF (Figure S4g). We then compared FIRE score changes at FIRE bins upon loss of SMC3. We observed significant decrease of FIRE score at CTCF/SMC3 co-bound sites (two sample t-test p-value = 6.78e-6 for TEV-HRV) (Figure 5c, d). By contrast, there is no statistically significant FIRE score decrease at FIRE bins that had CTCF binding without binding of SMC3 (Figure 5d). Quantitatively similar results were seen in mouse neural stem cells, post-mitotic astrocytes and thymocytes in the case of Rad21 deletion (two
A
uthor Man
uscr
ipt
A
uthor Man
uscr
ipt
A
uthor Man
uscr
ipt
A
uthor Man
uscr
sample t-test p-value = 0.0011 for post-mitotic astrocytes, two sample t-test p-value < 2.2e-16 for both neural stem cells and thymocytes) (Figure 5e, f) (Seitan et al., 2013; Sofueva et al., 2013). Importantly, the significant decrease of FIRE score was only observed at FIRE bins. Cohesin loss did not systemically affect FIRE scores at randomly selected and size-matched (5% of the genome) control regions (Figure S4h, i). We also re-analyzed Hi-C data in HEK293 cells in which CTCF had been experimental knocked down (Zuin et al., 2014) and again observed that FIRE score is most significantly reduced at FIRE bins occupied by CTCF/SMC co-binding in wild type cells (Figure S4j). Collectively, these results, as well as the significant enrichment of Cohesin at FIRE bins (Figure S4k), suggest that both CTCF and the Cohesin complex contribute to the formation of FIREs, and such a mechanism is likely conserved across human and mouse.
FIREs are enriched for disease-associated SNPs
Our analyses have indicated that FIREs are enriched for active enhancers and super-enhancers (Figure 4a-d, Figure S3b, c, f, g, n, o). Since typical and super-super-enhancers contain a significant proportion of disease-associated SNPs (Hnisz et al., 2013), we further
investigated the overlap between FIREs and disease-associated SNPs. First, we mapped 4,327 previously annotated disease-associated non-coding SNPs to FIREs defined in each cell line and tissue (see Supplemental Methods) (Hnisz et al., 2013). Consistent with previous results (Hnisz et al., 2013), we observed 7.06 and 3.76 SNPs per megabase, among 354 GM12878 FIREs overlapped with super-enhancers, and 2,800 GM12878 FIREs overlapped with typical enhancers, respectively (Figure S5a). Surprisingly, among 1,615 GM12878 FIREs that do not overlap an annotated enhancer, we also observed 3.33 SNPs per megabase, which is ∼2.3-fold higher than the genome-wide SNP density (1.42 SNPs per megabase) (Figure S5a). Importantly, these SNPs would not be captured by directly overlapping super-enhancers or typical enhancers with disease-associated SNPs (Hnisz et al., 2013).
Next we examined the overlap between disease-associated SNPs and FIREs for 456 diseases and quantitative traits (Hnisz et al., 2013). We defined the enrichment score for each disease as the ratio between the proportion of SNPs overlapped with FIREs and the proportion of FIRE bins in the genome. Strikingly, numerous immune-related diseases exhibit strong SNP enrichment in GM12878, but mild or weak enrichment in the other cell lines or tissues (Figure 6a). In fact, the vast majority of the top enrichment scores come from diseases previously implicated with immune pathology (Jostins et al., 2012) (Figure 6a). Motivated by these observations, we closely examined genes nearby FIREs harboring disease-associated SNPs, and found many genes disease-associated with that type of disease. For example, two SNPs associated with acute lymphoblastic leukemia (ALL), rs6683977 and rs546784, are within a GM12878-specific super-FIRE (Figure 6b) and within PDE4B, a gene associated with ALL (Yang et al., 2011).
We then conducted SNP enrichment analysis for the tissue datasets, and observed similar results for some diseases and quantitative traits, with the most striking findings in brain and liver (Figure 6c-d, Figure S5c-d). A careful examination of SNP and FIRE overlap also revealed disease candidate genes. For example, two Alzheimer's disease associated SNPs,
A
uthor Man
uscr
ipt
A
uthor Man
uscr
ipt
A
uthor Man
uscr
ipt
A
uthor Man
uscr
rs3851179 and rs536841, are within a brain FIRE (Figure S5b). Here, rs3851179 is within a brain-specific super-enhancer, while rs536841 is outside the super-enhancer. Interestingly, this brain-specific FIRE overlaps with PICALM, which contains the SNP (rs3851179) previously related to late-onset Alzheimer's disease incidence (Liu et al., 2016).
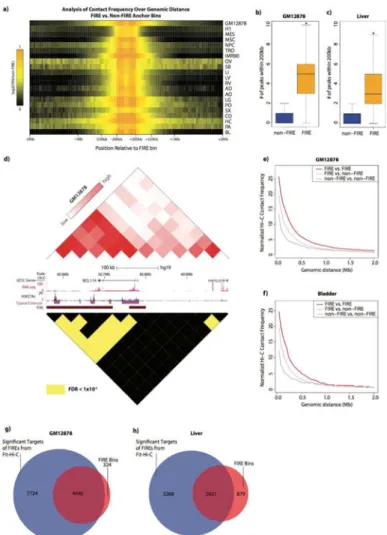
The presence of deleterious variants has been shown to mediate the expression of distal genes and confer pathology through DNA looping (Smemo et al., 2014). Therefore, we posited that significantly interacting bin-pairs (i.e. “peaks”) anchored at SNP-bearing FIREs (termed “FIRE peaks”) may be enriched for SNP-gene pairs, relative to peaks anchored at non-FIRE bins (termed “non-FIRE peaks”). To explore this, we first used Fit-Hi-C (Ay et al., 2014) (see Supplemental Methods) and a stringent statistical significance (FDR < 1e-6) cutoff to obtain the most confident peak calls within 2Mb genomic distance for all samples in our primary cohort (Supplemental File). We found that this significance cutoff
corresponds well to previously published total peak counts (Jin et al., 2013), and can also be used to link disease-associated SNPs to genes previously implicated in a particular disease. For example, Fit-Hi-C peak-calling analysis in GM12878 lymphoblasts reveals a highly significant (FDR = 6.29e-83) pair-wise Hi-C contact between a bin containing a SNP associated with acute lymphoblastic leukemia (ALL) (rs6964969) and a distal (∼130kb) TSS of IKZF1, a gene previously implicated in ALL (Mullighan et al., 2009) (Figure 6e, f). To further explore SNP-gene pair linkages in our tissue datasets, we collected statistically-associated SNP-gene pairs from the GTEx eQTL database in tissues matching our Hi-C datasets (GTEx Consortium et al., 2015; Lonsdale et al., 2013). We then selected six of our higher resolution tissue Hi-C datasets that were also present in GTEx for further analysis and found that FIRE peaks were indeed significantly enriched for SNP-gene pairs compared to non-FIRE peaks (Table S4). However, this may be expected because FIREs are enriched for disease-associated SNPs, and, FIREs are likely to have more local peaks than non-FIREs based on the definition of FIRE. Therefore, we analyzed the enrichment of GTEx SNP-gene pairs in subsets of the most significant FIRE peaks (i.e. the lowest FDR bin-pairs). We found that the most statistically significant FIRE peaks exhibited the strongest enrichment of SNP-gene pairs, and relaxing the FDR for peak-calling results in statistically significant, but less enriched SNP-gene pairs (Figure 6g-j, Table S4).
FIREs display promiscuous local chromatin interactions
Although FIREs are identified based on their cumulative local contact frequency, this could result from FIREs either having a single local target with exquisitely high contact frequency or numerous local targets with moderate to high contact frequency. Since FIREs and super-FIREs are highly enriched for active enhancers, exploring the interaction patterns of FIRE regions may provide further insight into the interaction behavior of active cis-regulatory loci. First, as expected, we find that FIREs are highly enriched for local interactions compared to non-FIREs, but unexpectedly, this contact enrichment extends in many cases to ∼500kb genomic distance (Figure 7a). Since FIREs tend to be positioned near the TAD center, it's likely that FIREs are highly interactive with all loci within the confines of their respective TADs. Next, using the most statistically confident (FDR < 1e-6) Hi-C contacts determined by Fit-Hi-C, we find that FIREs have significantly more local (<=200kb) peaks compared to non-FIREs (Figure 7b, c, Table S4) (two-sample t test p-value < 0.01 for OV and SB, <
A
uthor Man
uscr
ipt
A
uthor Man
uscr
ipt
A
uthor Man
uscr
ipt
A
uthor Man
uscr
2.2e-16 for remaining samples), with an average of 3-7 local peaks per FIRE bin depending on the sample and sequencing depth (Figure 7b, c, Table S4). One example is the BCL11A locus in GM12878 lymphoblast cells, where numerous enhancer-bearing FIRE bins
significantly interact with each other, and with the bin containing the promoter for BCL11A (Figure 7d). Interesting, BCL11A is also known to be involved in numerous lymphoid pathologies (Satterwhite et al., 2001).
To further quantify the contacts between FIREs, we examined the contact frequencies of FIREs and non-FIRE bins across a spectrum of genomic distances within 2Mb. We find significantly high contact frequency between FIREs beyond 200kb (Figure 7e, f), often up to
∼500kb and even to 2Mb in some cell lines and tissues (Figure S5e, Table S4). Furthermore, we find a significant proportion of FIREs are targets of other FIREs (Chi square test p value < 1e-5 for OV, < 2.2e-16 for rest of samples) (Figure 7e, g, h, Table S4, Figure 6e, Figure S5e). Taken together, these data support the notion that FIREs represent spatially active regions in the genome.
Discussion
3C and related technologies have been instrumental for understanding the hierarchical organization of mammalian genomes. Comparative analyses across cell types or species have thus far revealed a number of organizational features, including dynamic chromosomal compartments (Dixon et al., 2015; Lieberman-Aiden et al., 2009), TADs (Dixon et al., 2012; Nora et al., 2012; Sexton et al., 2012), sub-TADs (Phillips-Cremins et al., 2013), insulated neighborhoods (Dowen et al., 2014), and chromatin loops (Rao et al., 2014). Here, through a comprehensive survey of chromatin organization in 21 human tissues and cell types, we report the finding of a previously under-appreciated feature of chromatin organization, FIRE, defined as regions that show substantial levels of local chromatin interactions. FIREs are distinct structural features compared to the previously described 3D genome features such as TADs, chromatin loops, and compartments. FIREs are enriched in Compartment A and display strong tissue-type specificity, with nearly 60% of the FIREs found in 2 or fewer tissues/cell types out of 21 surveyed. Perhaps most surprisingly, FIREs appear to engage in promiscuous chromatin interactions within their local chromatin neighborhood. Majority of the FIREs identified interact with multiple partners, while the reported chromatin loops typically connect two genomic regions together. Thus, FIREs are hot spots of local
chromatin interactions. Finally, FIREs likely represent genomic regions actively engaged in gene regulation. Indeed, they reside near cell-identity genes, harbor significant levels of active chromatin marks, and are enriched for active enhancers, especially super-enhancers.
Further analysis reveals FIREs are closely related to previously reported super-enhancers (Hnisz et al., 2013). In GM12878 cells, where deep Hi-C data was available, nearly 100% of the super-enhancers are FIREs. Such observation sheds light on the spatial architecture of super-enhancers and other active enhancers. Specifically, our results suggest that in addition to high density of transcription factor binding and active chromatin modification, these long-range control elements also share a unique spatial feature – a high level of local chromatin interactions. Three additional properties about FIREs carry implications for the
understanding of chromatin organization of enhancers. First, FIREs are not only highly
A
uthor Man
uscr
ipt
A
uthor Man
uscr
ipt
A
uthor Man
uscr
ipt
A
uthor Man
uscr
interactive within 200kb, but also highly interactive beyond 200kb. Since FIREs are often positioned towards the TAD center, this likely means those FIREs are free to explore and interact with a substantial fraction of the TAD structure. Second, we find that FIREs often have numerous significant local interaction partners. Coupled with the observation that FIREs and super-FIREs are highly enriched for enhancers, this uncovers the promiscuously interactive behavior of active enhancer sequences. This could mean that enhancers are likely to explore and physically engage with several loci in their local neighborhood in search for compatible targets. Lastly, we find that FIREs are highly self-interactive, even beyond the local (+/- 200kb) neighborhood. This underscores the significant degree of active cis-regulatory element spatial clustering occurring within the topological framework of larger domains. These observations in conjunction with the notion that FIREs exhibit a high degree of tissue-specificity reveals the degree to which tissues contain unique chromatin folding signatures at their active cis-regulatory elements. Through their heightened local contact frequency, FIREs are likely to engage with several cis-regulatory elements in their TADs and cooperatively regulate gene expression.
By analyzing the effects of Cohesin depletion in three independent studies involving both mouse and human cells, we found that the Cohesin complex is a key mediator of FIREs, and this mechanism is conserved across species. Previous analyses of chromatin architecture in mammalian cells indicated that loss of Cohesin results in a reduction of interaction frequency within TADs (“intra-TAD”), while knockdown of CTCF results in both loss of intra-TAD contact frequency accompanied by an increase in inter-TAD contact frequency (Zuin et al., 2014). Our re-analysis of these data in the context of very local chromatin interaction frequency indicate that upon loss of Cohesin or CTCF, the most dramatic reduction in FIRE score at FIRE bins was observed at loci containing CTCF/Cohesin co-bound peaks but not CTCF-only sites. We further demonstrate the Cohesin-dependence of FIREs in murine neuronal progenitor cells, astrocytes and thymocytes, supporting a conserved mechanism of FIRE establishment.
In sum, by generating a rich resource of chromatin contact maps across 21 human tissues/ cell types and exploring with integrative analytic methods, we have catalogued 3D genome interactions at various hierarchical levels, and uncovered the highly dynamic nature of local interaction hotspots. These results provide insights into the chromatin organization in mammalian cells.
Experimental Procedures
Hi-C
Hi-C experiments on all human tissues were performed as previously described using the HindIII restriction enzyme (Lieberman-Aiden et al., 2009) with minor modifications pertaining to handling flash frozen primary tissues (Leung et al., 2015). All previously published Hi-C datasets analyzed in this study were generated using the original “dilution” Hi-C protocol (Lieberman-Aiden et al., 2009) and HindIII, unless otherwise noted (Table S1).
A
uthor Man
uscr
ipt
A
uthor Man
uscr
ipt
A
uthor Man
uscr
ipt
A
uthor Man
uscr
Hi-C data processing
Newly generated Hi-C datasets were sequenced on either Illumina HiSeq2000 or HiSeq2500 instrument. Published datasets were obtained from the SRA and converted to fastq files. Data were then processed using a custom pipeline, beginning with aligning each read end to the mm9 or hg19 reference genomes using BWA –mem. Chimeric read ends were filtered to keep only 5′ alignments with MAPQ >10, and then read-ends were paired and
de-duplicated. Raw contact matrices were constructed using in-house scripts, and then further processed using HiCNormCis (described below), or using HiCNorm (Hu et al., 2012), Vanilla Coverage (Rao et al., 2014), or ICE (Imakaev et al., 2012), where indicated.
Compartment A/B Identification
Compartment A/B analysis was performed at 1Mb resolution as previously described (Lieberman-Aiden et al., 2009), using the ‘prcomp’ function in R on the Pearson correlation matrix.
Identification of Topological Domains
Topological domains boundaries were identified at 40kb bin resolution using the previously described insulation score analysis approach, with two minor modifications (Crane et al., 2015). Since mammalian TAD have been previously identified to be ∼1Mb, a 1Mb genomic region was used rather than 500kb. Additionally, a 200kb window, rather than 100kb, was used for calculation of the delta vector.
Identifying Frequently Interacting Regions
We developed a Poisson regression based normalization approach, named as
“HiCNormCis”, to identify FIRE bins. Specifically, we first partitioned the entire genome into bins, and calculated the total number of intra-chromosomal (“cis”) interactions in the contact distance range of 15-200Kb for each bin. Bins with low mappability (<0.9) around HindIII cut sites were removed. HiCNormCis then takes into account biases from three known factors known to bias observed Hi-C contact counts, including effective fragment length, GC content and mappability (Yaffe and Tanay, 2011) (related to Figure 2, Figure S2). Let Yi represent the total cis interactions (15-200Kb) for the i th bin. Additionally, let Fi,
GCi and Mi represent the effective fragment length, GC content and mappability in the i th
bin, respectively. The detailed calculation of Fi, GCi and Mi is description in our previous
work (Hu et al, 2012). Assume Yi follow a Poisson distribution with mean θi. We fitted a
Poisson regression model as follows: logθi = β0 + βFFi + βGCGCi + βMMi, and defined the
residual Ri = Yi/exp(β̂0 + β̂FFi + β̂GCGCi + β̂MMi) as the normalized total cis interaction.
Noticeably, exp(β̂0) is proportional to the overall sequencing depth, and the residual Ri has
mean 1. Therefore, the normalized total cis interactions are robust to different sequencing depths, and are directly comparable among different samples. Visual inspection revealed that Ri follows a Gaussian distribution (related to Figure S2). Therefore, we converted Ri to the
corresponding z-score and –ln(p-value). The same approach can theoretically be applied to any Hi-C dataset generated using a restriction enzyme, and at any bin size.
A
uthor Man
uscr
ipt
A
uthor Man
uscr
ipt
A
uthor Man
uscr
ipt
A
uthor Man
uscr
Identification of significant Hi-C contacts
Statistically significant contacts in Hi-C data were identified at 40kb resolution using Fit-Hi-C, as previously described (Ay et al., 2014) (see Supplemental Methods). We used the default Fit-Hi-C code to calculate a p value and q value for each bin-pair within 2Mb genomic distance. For all analyses in this study we used a conservative peak-calling threshold of FDR<1e-6.
Supplementary Material
Refer to Web version on PubMed Central for supplementary material.
Acknowledgments
We would like to dedicate this manuscript in loving memory of Joseph Schmitt. We would like to give special thanks to Samantha Kuan and Bin Li for operating of sequencing instruments and data processing. We'd like to acknowledge the help of Michael Yu from Trey Ideker's lab (UCSD), Doug Chapski from Tom Vondriska's lab (UCLA) and Jesse Dixon (Salk Institute) for sharing helpful files or codes to facilitate this study. We would also like to give special thanks to David Gorkin, for numerous helpful discussions throughout the project, as well as the additional members of the Ren laboratory. This work is supported by the Ludwig Institute for Cancer Research and grants from NIH (U54DK107977 to B.R. and M.H., and R01 ES024984 to B.R.). A.D.S. is supported by NIH genetics training grant, T32 GM008666. C.L.B. is supported by funding from The Ontario Mental Health Foundation, The Krembil Foundation and The Hospital for Sick Children Psychiatric Endowment Fund. Y.L. and Z.X. are partially supported by NIH R01HG006292 and R01HL129132 (awarded to Y.L.).
References
Arens R, Nolte MA, Tesselaar K, Heemskerk B, Reedquist KA, van Lier RAW, van Oers MHJ. Signaling through CD70 Regulates B Cell Activation and IgG Production. J Immunol. 2004; 173:3901–3908. [PubMed: 15356138]
Ay F, Bailey TL, Noble WS. Statistical confidence estimation for Hi-C data reveals regulatory chromatin contacts. Genome Res. 2014; 24:999–1011. [PubMed: 24501021]
Crane E, Bian Q, McCord RP, Lajoie BR, Wheeler BS, Ralston EJ, Uzawa S, Dekker J, Meyer BJ. Condensin-driven remodelling of X chromosome topology during dosage compensation. Nature. 2015; 523:240–244. [PubMed: 26030525]
Dekker J, Rippe K, Dekker M, Kleckner N. Capturing chromosome conformation. Science. 2002; 295:1306–1311. (80-). [PubMed: 11847345]
Dixon JR, Selvaraj S, Yue F, Kim A, Li Y, Shen Y, Hu M, Liu JS, Ren B. Topological domains in mammalian genomes identified by analysis of chromatin interactions. Nature. 2012; 485:376–380. [PubMed: 22495300]
Dixon JR, Jung I, Selvaraj S, Shen Y, Antosiewicz-bourget JE, Lee AY, Ye Z, Kim A, Rajagopal N, Xie W, et al. Chromatin architecture reorganization during stem cell differentiation. Nature. 2015; 518:331–336. [PubMed: 25693564]
Dixon JR, Gorkin DU, Ren B, Alipour E, Marko JF, Austenaa LM, Barozzi I, Simonatto M, Masella S, Della Chiara G, et al. Chromatin Domains: The Unit of Chromosome Organization. Mol Cell. 2016; 62:668–680. [PubMed: 27259200]
Dostie J, Richmond TA, Arnaout RA, Selzer RR, Lee WL, Honan TA, Rubio ED, Krumm A, Lamb J, Nusbaum C, et al. Chromosome Conformation Capture Carbon Copy (5C): a massively parallel solution for mapping interactions between genomic elements. Genome Res. 2006; 16:1299–1309. [PubMed: 16954542]
Dowen JM, Fan ZP, Hnisz D, Ren G, Abraham BJ, Zhang LN, Weintraub AS, Schuijers J, Lee TI, Zhao K, et al. Control of cell identity genes occurs in insulated neighborhoods in mammalian chromosomes. Cell. 2014; 159:374–387. [PubMed: 25303531]
A
uthor Man
uscr
ipt
A
uthor Man
uscr
ipt
A
uthor Man
uscr
ipt
A
uthor Man
uscr
Dryden NH, Broome LR, Dudbridge F, Johnson N, Orr N, Schoenfelder S, Nagano T, Andrews S, Wingett S, Kozarewa I, et al. Unbiased analysis of potential targets of breast cancer susceptibility loci by Capture Hi-C. Genome Res. 2014:1854–1868. [PubMed: 25122612]
Fraser J, Ferrai C, Chiariello AM, Schueler M, Rito T, Laudanno G, Barbieri M, Moore BL, Kraemer DC, Aitken S, et al. Hierarchical folding and reorganization of chromosomes are linked to transcriptional changes in cellular differentiation. Mol Syst Biol. 2015; 11:852. [PubMed: 26700852]
Welter D, MacArthur J, Morales J, Burdett T, Hall P, Junkins H, Klemm A, Flicek P, Manolio T, et al. GTEx Consortium, T.Gte. Human genomics. The Genotype-Tissue Expression (GTEx) pilot analysis: multitissue gene regulation in humans. Science. 2015; 348:648–660. [PubMed: 25954001]
Hnisz D, Abraham BJ, Lee TI, Lau A, Saint-André V, Sigova AA, Hoke HA, Young RA. Super-enhancers in the control of cell identity and disease. Cell. 2013; 155:934–947. [PubMed: 24119843]
Hu M, Deng K, Selvaraj S, Qin Z, Ren B, Liu JS. HiCNorm: removing biases in Hi-C data via Poisson regression. Bioinformatics. 2012; 28:3131–3133. [PubMed: 23023982]
Imakaev M, Fudenberg G, McCord RP, Naumova N, Goloborodko A, Lajoie BR, Dekker J, Mirny LA. Iterative correction of Hi-C data reveals hallmarks of chromosome organization. Nat Methods. 2012; 9:999–1003. [PubMed: 22941365]
Ji X, Dadon DB, Powell BE, Fan ZP, Borges-Rivera D, Shachar S, Weintraub AS, Hnisz D, Pegoraro G, Lee TI, et al. 3D Chromosome Regulatory Landscape of Human Pluripotent Cells. Cell Stem Cell. 2016; 18:262–275. [PubMed: 26686465]
Jin F, Li Y, Dixon JR, Selvaraj S, Ye Z, Lee AY, Yen CA, Schmitt AD, Espinoza CA, Ren B. A high-resolution map of the three-dimensional chromatin interactome in human cells. Nature. 2013; 503:290–294. [PubMed: 24141950]
Jostins L, Ripke S, Weersma RK, Duerr RH, McGovern DP, Hui KY, Lee JC, Philip Schumm L, Sharma Y, Anderson CA, et al. Host–microbe interactions have shaped the genetic architecture of inflammatory bowel disease. Nature. 2012; 491:119–124. [PubMed: 23128233]
Kagey MH, Newman JJ, Bilodeau S, Zhan Y, Orlando DA, van Berkum NL, Ebmeier CC, Goossens J, Rahl PB, Levine SS, et al. Mediator and cohesin connect gene expression and chromatin
architecture. Nature. 2010; 467:430–435. [PubMed: 20720539]
Kingwell K. Epilepsy: GRIN2A mutations identified as key genetic drivers of epilepsy–aphasia spectrum disorders. Nat Rev Neurol. 2013; 9:541–541. [PubMed: 23999465]
Leung D, Jung I, Rajagopal N, Schmitt A, Selvaraj S, Lee AY, Yen C. Integrative analysis of haplotype-resolved epigenomes across human tissues. Nature. 2015; 518:350–354. [PubMed: 25693566]
Leyva-Díaz E, del Toro D, Menal MJ, Cambray S, Susín R, Tessier-Lavigne M, Klein R, Egea J, López-Bendito G. FLRT3 is a Robo1-interacting protein that determines Netrin-1 attraction in developing axons. Curr Biol. 2014; 24:494–508. [PubMed: 24560577]
Lieberman-Aiden E, van Berkum NL, Williams L, Imakaev M, Ragoczy T, Telling A, Amit I, Lajoie BR, Sabo PJ, Dorschner MO, et al. Comprehensive mapping of long-range interactions reveals folding principles of the human genome. Science. 2009; 326:289–293. (80-). [PubMed: 19815776] Liu G, Xu Y, Jiang Y, Zhang L, Feng R, Jiang Q. PICALM rs3851179 Variant Confers Susceptibility
to Alzheimer's Disease in Chinese Population. Mol Neurobiol. 2016
Lonsdale J, Thomas J, Salvatore M, Phillips R, Lo E, Shad S, Hasz R, Walters G, Garcia F, Young N, et al. The Genotype-Tissue Expression (GTEx) project. Nat Genet. 2013; 45:580–585. [PubMed: 23715323]
McLean CY, Bristor D, Hiller M, Clarke SL, Schaar BT, Lowe CB, Wenger AM, Bejerano G. GREAT improves functional interpretation of cis-regulatory regions. Nat Biotechnol. 2010; 28:495–501. [PubMed: 20436461]
Meaburn KJ, Misteli T. Cell biology: Chromosome territories. Nature. 2007; 445:379–781. [PubMed: 17251970]
Montavon T, Duboule D. Chromatin organization and global regulation of Hox gene clusters. Philos Trans R Soc Lond B Biol Sci. 2013; 368:20120367. [PubMed: 23650639]
Mullighan, CG., Su, X., Zhang, J., Radtke, I., Phillips, LAA., Miller, CB., Ma, J., Liu, W., Cheng, C., Schulman, BA., et al. Deletion of IKZF1 and Prognosis in Acute Lymphoblastic Leukemia. 2009.
http://dx.doi.org/10.1056/NEJMoa0808253
Nora EP, Lajoie BR, Schulz EG, Giorgetti L, Okamoto I, Servant N, Piolot T, van Berkum NL, Meisig J, Sedat J, et al. Spatial partitioning of the regulatory landscape of the X-inactivation centre. Nature. 2012; 485:381–385. [PubMed: 22495304]
Ohi K, Shimada T, Nitta Y, Kihara H, Okubo H, Uehara T, Kawasaki Y, Adriano F, Caltagirone C, Spalletta G, et al. Specific gene expression patterns of 108 schizophrenia-associated loci in cortex. Schizophr Res. 2016; 174:35–38. [PubMed: 27061659]
Phillips-Cremins JE, Sauria MEG, Sanyal A, Gerasimova TI, Lajoie BR, Bell JSK, Ong CT, Hookway TA, Guo C, Sun Y, et al. Architectural protein subclasses shape 3D organization of genomes during lineage commitment. Cell. 2013; 153:1281–1295. [PubMed: 23706625]
Rao SSP, Huntley MH, Durand NC, Stamenova EK. A 3D Map of the Human Genome at Kilobase Resolution Reveals Principles of Chromatin Looping. Cell. 2014:1–16. [PubMed: 24679520] Rudan MV, Barrington C, Tanay A, Rudan MV, Barrington C, Henderson S, Ernst C, Odom DT, Tanay
A. Comparative Hi-C Reveals that CTCF Underlies Evolution of Chromosomal Domain Architecture. Cell Rep. 2015; 10:1–13. [PubMed: 25543138]
Satterwhite E, Sonoki T, Willis TG, Harder L, Nowak R, Arriola EL, Liu H, Price HP, Gesk S, Steinemann D, et al. The BCL11 gene family: involvement of BCL11A in lymphoid malignancies. Blood. 2001; 98:3413–3420. [PubMed: 11719382]
Seitan VC, Faure AJ, Zhan Y, McCord RP, Lajoie BR, Ing-Simmons E, Lenhard B, Giorgetti L, Heard E, Fisher AG, et al. Cohesin-based chromatin interactions enable regulated gene expression within preexisting architectural compartments. Genome Res. 2013; 23:2066–2077. [PubMed: 24002784] Selvaraj S, R Dixon J, Bansal V, Ren B. Whole-genome haplotype reconstruction using
proximity-ligation and shotgun sequencing. Nat Biotechnol. 2013; 31:1111–1118. [PubMed: 24185094] Sexton T, Yaffe E, Kenigsberg E, Bantignies F, Leblanc B, Hoichman M, Parrinello H, Tanay A,
Cavalli G. Three-dimensional folding and functional organization principles of the Drosophila genome. Cell. 2012; 148:458–472. [PubMed: 22265598]
Shen Y, Yue F, McCleary DF, Ye Z, Edsall L, Kuan S, Wagner U, Dixon J, Lee L, Lobanenkov VV, et al. A map of the cis-regulatory sequences in the mouse genome. Nature. 2012; 488:116–120. [PubMed: 22763441]
Simonis M, Klous P, Splinter E, Moshkin Y, Willemsen R, de Wit E, van Steensel B, de Laat W. Nuclear organization of active and inactive chromatin domains uncovered by chromosome conformation capture-on-chip (4C). Nat Genet. 2006; 38:1348–1354. [PubMed: 17033623] Smemo S, Tena JJ, Kim KH, Gamazon ER, Sakabe NJ, Gómez-Marín C, Aneas I, Credidio FL, Sobreira DR, Wasserman NF, et al. Obesity-associated variants within FTO form long-range functional connections with IRX3. Nature. 2014; 507:371–375. [PubMed: 24646999] Sofueva S, Yaffe E, Chan WC, Georgopoulou D, Vietri Rudan M, Mira-Bontenbal H, Pollard SM,
Schroth GP, Tanay A, Hadjur S. Cohesin-mediated interactions organize chromosomal domain architecture. EMBO J. 2013; 32:3119–3129. [PubMed: 24185899]
Tang Z, Luo OJ, Li X, Zheng M, Zhu JJ, Szalaj P, Trzaskoma P, Magalska A, Wlodarczyk J, Ruszczycki B, et al. CTCF-Mediated Human 3D Genome Architecture Reveals Chromatin Topology for Transcription. Cell. 2015; 163:1611–1627. [PubMed: 26686651]
The ENCODE Project Consortium. An integrated encyclopedia of DNA elements in the human genome. Nature. 2012; 489:57–74. [PubMed: 22955616]
The Roadmap Epigenomics Consortium. Integrative analysis of 111 reference human epigenomes. 2015
Vietri Rudan M, Barrington C, Henderson S, Ernst C, Odom DT, Tanay A, Hadjur S. Comparative Hi-C Reveals that Hi-CTHi-CF Underlies Evolution of Hi-Chromosomal Domain Architecture. Hi-Cell Rep. 2015; 10:1297–1309. [PubMed: 25732821]
Xu Z, Zhang G, Jin F, Chen M, Furey TS, Sullivan PF, Qin Z, Hu M, Li Y. A hidden Markov random field based Bayesian method for the detection of long-range chromosomal interactions in Hi-C Data. Bioinformatics. 2015 btv650-
Xu Z, Zhang G, Wu C, Li Y, Hu M. FastHiC: a fast and accurate algorithm to detect long-range chromosomal interactions from Hi-C data. Bioinformatics. 2016 btw240.
Yaffe E, Tanay A. Probabilistic modeling of Hi-C contact maps eliminates systematic biases to characterize global chromosomal architecture. Nat Genet. 2011; 43:1059–1065. [PubMed: 22001755]
Yang JJ, Cheng C, Devidas M, Cao X, Fan Y, Campana D, Yang W, Neale G, Cox NJ, Scheet P, et al. Ancestry and pharmacogenomics of relapse in acute lymphoblastic leukemia. Nat Genet. 2011; 43:237–241. [PubMed: 21297632]
Zuin J, Dixon JR, van der Reijden MIJa, Ye Z, Kolovos P, Brouwer RWW, van de Corput MPC, van de Werken HJG, Knoch Ta, van IJcken WFJ, et al. Cohesin and CTCF differentially affect chromatin architecture and gene expression in human cells. Proc Natl Acad Sci U S A. 2014; 111:996–1001. [PubMed: 24335803]
A
uthor Man
uscr
ipt
A
uthor Man
uscr
ipt
A
uthor Man
uscr
ipt
A
uthor Man
uscr
Highlights
- Integrative analysis of chromatin architecture in a broad set of human tissues
- FIREs are an architectural feature of chromatin organization
- FIREs are enriched for super-enhancers and show tissue-specific chromatin interactions
- FIRE formation is partially dependent on CTCF and the Cohesin complex
A
uthor Man
uscr
ipt
A
uthor Man
uscr
ipt
A
uthor Man
uscr
ipt
A
uthor Man
uscr
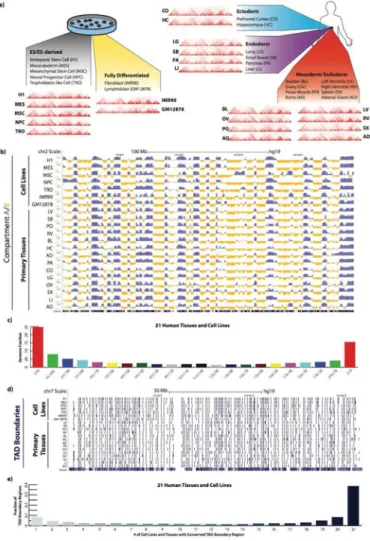
Figure 1. Global features of 3D genome organization in 7 cell lines and 14 adult tissues
a) Illustration of the primary 21 Hi-C datasets analyzed, depicting the cell (left panel) or tissue (right panel) origin of the samples, as well as the germ layer origin for tissues (right panel). Hi-C interaction patterns across an 11.68Mb region (chr12:82,840,000-94,520,000) are shown for all 7 cell lines and 14 tissues at 40kb bin resolution.
b) Genome browser snapshot showing compartment A/B patterns (PC1 value) across chromosome 2 in 21 samples, with 7 cell lines at the top and 14 primary adult tissues on the bottom. Compartment A/B patterns are at 1Mb bin resolution. Positive PC1 in blue
corresponds to A compartment, negative PC2 in yellow corresponds to B compartment. c) Bar plots showing the degree of conservation of A/B compartment labels 21 human cell lines and adult tissues. The Y-axis is the fraction of the genome conserved by the 22 possible combinations of compartment A/B designations. The label below each bar represents the composition of compartment designations. For example, ‘16A/5B’ represents the genomic region where 16 samples exhibit a compartment A label and the other 5 samples exhibit compartment B label.
d) Genome browser snapshot showing topological domain boundaries across chromosome 7 in 21 samples, with 7 cell lines at the top and 14 primary adult tissues on the bottom. Boundaries are identified at 40kb bin resolution.
A
uthor Man
uscr
ipt
A
uthor Man
uscr
ipt
A
uthor Man
uscr
ipt
A
uthor Man
uscr
e) Bar plots showing the degree of topological domain boundary conservation across 21 human cell lines and tissues. For each putative boundary region, we tallied how many cell lines have a boundary within that region (see Supplemental Methods). Shown here is a total fraction of TAD boundary regions, whereby the Y-axis is the fraction of TAD boundaries conserved at least a certain number of samples, as categorized along the x-axis.
A
uthor Man
uscr
ipt
A
uthor Man
uscr
ipt
A
uthor Man
uscr
ipt
A
uthor Man
uscr
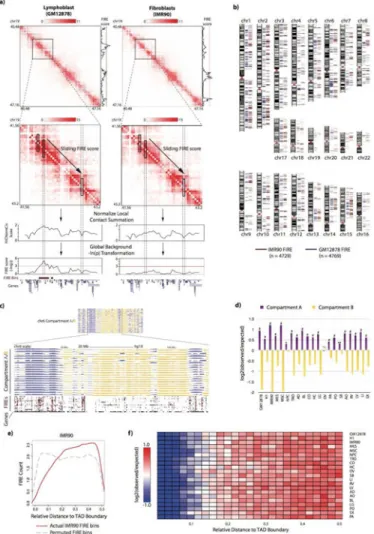
Figure 2. Identification and positional enrichment of frequently interacting regions
a) Illustrative examples showing the FIRE score methodology. Hi-C contact maps from a 6.68Mb region (chr19:40,480,000-47,160,000) are shown for GM12878 and IMR90 cells at 40kb bin resolution (top). To the right of the contact maps are line plots showing the fully processed FIRE score for each 40kb bin. A red line is drawn at the significance cutoff. The second row of contact maps illustrates FIRE scores in a sub-matrix
(chr19:41,560,000-43,200,000) of the above contact maps (black box). Line plots directly below show the intermediate stage in the FIRE score calculation, which is the output from HiCNormCis (see Supplemental Methods). Genome-wide HiCNormCis normalized counts are then z-score transformed and converted to a –ln(p-value) scale to obtain the final FIRE score (bottom line plots). Dashed columns highlight two 40kb bins, one showing a FIRE peak in GM12878 cells but not in IMR90 cells, and the other showing low FIRE score in both cell types.
b) Chromosome ideograms showing the genome-wide positional distribution of FIRE bins in GM12878 (blue, n=4,769) and IMR90 (maroon, n=4,729). Genome-wide visualization captures both conserved and specific FIRE bins. Only autosomes are depicted.
c) Genome browser snapshot of compartment A/B patterns in 21 samples across
chromosome 6 (top), and a genome browser snapshot of a 90Mb subset of chromosome 6
A
uthor Man
uscr
ipt
A
uthor Man
uscr
ipt
A
uthor Man
uscr
ipt
A
uthor Man
uscr
(chr6:25,000,000-115,000,000) showing compartment A/B patterns for 21 samples (top set, blue/yellow) and FIRE calls (bottom set, maroon).
d) Barplots showing an enrichment analysis of FIRE positioning within either compartment A or B, illustrating FIREs are enriched in compartment A and depleted in compartment B compared to random permutation of FIRE bin location within each sample (* p < 5.0e-7; ** p < 7.0e-13; # p < 2.2e-16; chi-square test). Statistical tests correspond to the significance of FIRE enrichment in compartment A.
e) Line plot showing an example of IMR90 FIRE bin positioning relative to TADs (see Supplemental Methods). The red lines depicts the observed counts (y-axis) of actual IMR90 FIRE bins, while gray dashed line shows the counts of permuted FIRE bin locations. The x-axis ranges from 0 to 0.5, where 0 represents TAD boundaries, and 0.5 represents TAD center points.
f) Heatmap showing the TAD position enrichment analysis across all 21 samples. Shown are the log2(observed/expected) values for each distance increment, as computed in Panel e.
A
uthor Man
uscr
ipt
A
uthor Man
uscr
ipt
A
uthor Man
uscr
ipt
A
uthor Man
uscr
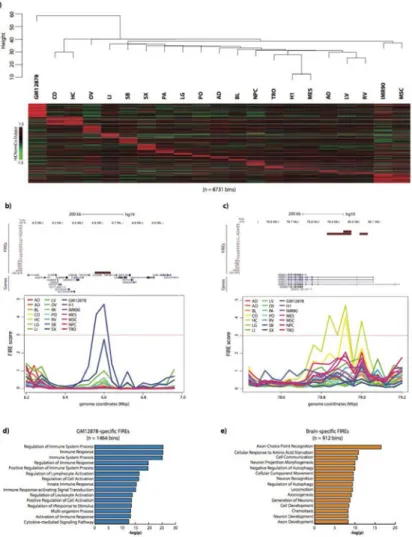
Figure 3. FIREs are tissue-type specific and enriched near genes involved in tissue function
a) At the top, a dendrogram resulting from hierarchical clustering analysis using genome-wide FIRE scores for each sample. The y-axis is the Euclidean distance between FIRE scores from any two samples. The heatmap below shows a subset of FIRE bins (n=8,371), corresponding to FIRE bins that are called as FIRE in only one or two samples. For ventricle tissues, brain tissues, IMR90/MSC, and H1/MES, FIREs specific to two samples are allowed in the definition of sample-specific.
b) Genome browser snapshot showing a GM12878-specific FIRE region (chr19:6,560,000-6,640,000) (top, maroon) in an 800kb region around CD70
(chr19:6,583,193-6,604,114). Below is a line plot of FIRE scores for each sample, showing the GM12878-specific FIRE peak (blue).
c) Genome browser snapshot showing a brain-specific FIRE region
(chr3:78,920,000-78,960,000), shared by CO and HC, in a 760kb region within the ROBO1 gene (chr3:78,646,338-79,068,609). Below is a line plot of FIRE scores for each tissue, showing CO (yellow) and HC (pea green) FIRE peaks.
d) GREAT biological process analysis of genes surrounding GM12878-specific FIRE bins (n=1,464 bins) showing biological processes highly related to immune functions. Plotted values are the – log10 of the Bonferroni-corrected binomial p values.
A
uthor Man
uscr
ipt
A
uthor Man
uscr
ipt
A
uthor Man
uscr
ipt
A
uthor Man
uscr
e) Same as Panel e, except using genes surrounding brain (CO and HC) specific FIRE bins (n=912 FIRE bins) showing several significant processes highly related to brain
functionality. Plotted values are the –log10 of the Bonferroni-corrected binomial p values.
A
uthor Man
uscr
ipt
A
uthor Man
uscr
ipt
A
uthor Man
uscr
ipt
A
uthor Man
uscr
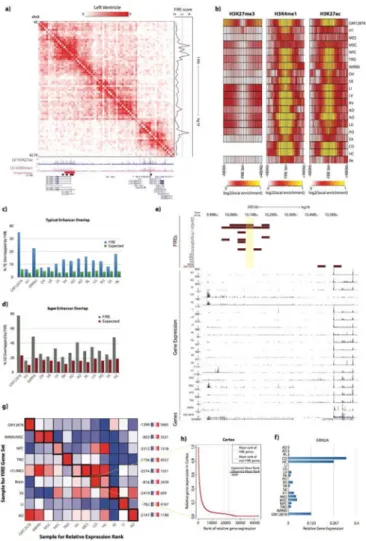
Figure 4. FIREs are enriched for active enhancers and positioned near sample-specific gene expression
a) Normalized Hi-C contact matrix in Left Ventricle tissue showing a 2.76Mb locus (chr2:40,000,000-42,760,000). Below are genome browser tracks for previously published (Hnisz et al, 2013) LV super-enhancers (red), LV FIRE bins (brown), and UCSC genes, including isoforms (blue). To the right is the continuous LV FIRE score along this locus. b) Heatmaps showing the local enrichment (see Supplemental Methods) of H3K27me3 (left), H3K4me1 (middle), and H3K27ac (right), centered on FIRE bins for each cell line or adult tissue. H3K27me3 data was not available for CO or HC.
c) Bar plot showing the observed overlap between actual FIRE bins and previously characterized typical enhancers (blue) (Hnisz et al., 2013) for each available cell line or tissue that has both Hi-C data and typical enhancer calls. Expected values are also shown (green), which are calculated by permuting the location of FIRE bins within each tissue and calculating the overlap with typical enhancers. The y-axis shows the percentage of typical enhancers overlapped by FIREs.
d) Same as Panel c, except showing the percentage of super-enhancers overlapped by FIRE bins for each testable cell line or tissue.
e) Genome browser snapshot showing an example of sample-specific gene expression near sample-specific FIREs. Shown here is a 780kb locus (chr16:9,820,000-10,600,000) around
A
uthor Man
uscr
ipt
A
uthor Man
uscr
ipt
A
uthor Man
uscr
ipt
A
uthor Man
uscr
GRIN2A (chr16:9,852,375-10,276,611). At the top, FIRE tracks (maroon) for each sample, showing the Brain-specific FIRE (chr16:10,040,000-10,080,000, highlighted in yellow)
∼197kb away from GRIN2A TSS. Below, RNA-Seq data (Roadmap Epigenomics Consortium et al, 2015) for all samples except OV (blue) showing GRIN2A is mainly expressed in brain tissues.
f) Bar plot indicating the relative gene expression (see Supplemental Methods) of GRIN2A across 20 samples.
g) All-by-all mean-rank enrichment analysis result showing gene expression specificity of genes within 200kb of sample-specific FIRE bins (see Supplemental Methods). Each row is a different sample type for which the sample-specific FIRE gene set is collected, and columns are the sample type used to calculate the relative expression rank of each gene. IMR90/MSC, M1/MES, and brain tissues were previously shown to have highly overlapped FIRE bins (Figure 3a) and are therefore grouped. Color for each row of the heatmap indicates the enrichment. Outlined in thick black boxes along the diagonal are the matrix entries for which the sample for the sample-specific FIRE gene set and expression rank list are the same. Highlighted in a thin yellow box is the analysis portrayed in Panel h.
h) Line plot illustrating a single mean-rank enrichment analysis. The plot shows the relative gene expression values (y-axis) in Cortex as a function of their numeric ranking (x-axis) in Cortex. Vertical dashed lines show the position of the observed mean-rank of Cortex-specific FIRE genes (red dash), and the expected mean-rank based on size-matched randomly selected non-FIRE bins in Cortex (gray dash). Inset is the calculation of enrichment score.