ESTIMATION OF THE DELIVERED DOSE IN PROSTATE CANCER PATIENTS TREATED WITH IMRT/VMAT USING DEFORMABLE IMAGE REGISTRATION:
DOSIMETRIC AND CLINICAL CONSIDERATIONS
Jacob Elliott Hammers
A dissertation submitted to the faculty at the University of North Carolina at Chapel Hill in partial fulfillment of the requirements for the degree of Doctor of Philosophy in the Joint
Department of Biomedical Engineering in the School of Medicine.
Chapel Hill 2019
Approved by:
Panayiotis Mavroidis David Lalush
ii
© 2019
iii
ABSTRACT
Jacob Elliott Hammers: Estimation of the Delivered Dose in Prostate Cancer Patients Treated with IMRT/VMAT Using Deformable Image Registration: Dosimetric and Clinical
Considerations
(Under the direction of Panayiotis Mavroidis)
Development in supporting technologies for external beam radiation therapy such as adoption of 3D-computed tomography (CT) imaging, multileaf collimators, and advanced planning software has allowed for the clinical implementation of intensity-modulated radiotherapy and volumetric-modulated arc therapy for the treatment of prostate cancer. Adaptive radiotherapy utilizes fractional image guidance to improve conformity between the dose delivery projected from the planning CT and the actually delivered dose throughout
treatment. Due to the steep fall-off of the dose distribution around the target, which is created to spare the organs-at-risk, a robust verification of dose delivery and quality assurance of the inverse treatment planning process is required.
iv
This dissertation examines the effects of anatomical deformations of the bladder and rectum on the accumulated dose and evaluates potential correlation of dose accumulated in the bladder and rectum throughout treatment with patient reported outcome data. Estimations of accumulated dose incorporated fractional image guidance through one of multiple deformable image registration algorithms, validated against physician delineated contours, for comparison to the planning CT dose. Correlation of the deviations estimated during treatment via accumulated dose with factors associated with disease-specific patient reported outcome informs an
v
This dissertation is dedicated to my family and friends, without whom I would never have been capable of the pursuit of this degree. Thank you all for providing me with the support that
vi
ACKNOWLEDGEMENTS
I would like to thank my advisor, Dr. Panayiotis Mavroidis, for his kindness and patient tutelage that guided me through this investigation. I learned so much through his understanding and wisdom. I would also like to thank the other members of my committee, Dr. David Lalush, Dr. Xianming Tan, Dr. Ronald Chen, and Dr. Sha Chang, for the stimulating support they provided me. Furthermore, I would like to thank:
My co-authors, Ms. Sara Pirozzi, Dr. Daniel Lindsay, Dr. Kaidar-Person, Dr. Xianming Tan, Dr. Ronald Chen, Dr. Shiva Das, Mr. John Dooley, Dr. Sotiris Stathakis, Dr. Nikos Papanikolaou, Dr. Lawrence Marks, and Dr. Andrew Wang, for all their important contributions to this investigation.
Ms. Vilma Berg, for all the administrative guidance and direction she provided me throughout my studies.
The staff of the Department of Radiation Oncology, Chapel Hill, North Carolina Cancer Hospital, for providing me with the resources I required to complete this degree.
My parents, for their unconditional love and support throughout my life.
My grandfather, to whom I owe my middle name, for his support and the remarkable influence he had on instilling me with the curiosity and ambition I required to achieve success in my life.
vii
TABLE OF CONTENTS
LIST OF TABLES ...x
LIST OF FIGURES ... xi
LIST OF ABBREVIATIONS ... xiii
CHAPTER 1: INTRODUCTION ...1
References ...4
CHAPTER 2: INTERNAL ORGAN DEFORMATION AND DEFORMABLE IMAGE REGISTRATION ...6
Introduction ...6
Section 2.1 Deformable Image Registration Model ...7
Section 2.2 Deformable Image Registration Objective Functions...9
Intensity-based Deformable Image Registration Objective Functions ...9
Contour-based Deformable Image Registration Objective Functions ...9
Hybrid Deformable Image Registration Objective Functions ...10
Section 2.3 Deformable Image Registration Transformation Models ...10
Transformation Models Based on Physical Phenomena ...11
viii
Transformation Models Based on Biomechanical Properties ...12
Section 2.4 Impact of Internal Organ Deformation on Daily Delivered Dose ...12
References ...15
CHAPTER 3: TARGET DELINEATION METRICS ...18
Introduction ...18
Section 3.1 Materials and Methods ...20
Dataset Characterization ...20
Manual Fractional Contour Delineation ...20
Automated Registration and Contour Propagation ...20
Shadowed NIB Contour Propagation...21
Contour Set Comparison ...23
Statistical Analysis ...26
Section 3.2 Results ...26
Section 3.3 Discussion ...34
References ...38
CHAPTER 4: DOSE DELIVERY ACCURACY AND ITS DEPENDENCE ON DEFORMABLE IMAGE REGISTRATION ...40
Introduction ...40
Section 4.1 Materials and Methods ...41
ix
Manual Fractional Contour Delineation ...42
Contour Propagation and Image Registration ...42
Dose Accumulation and Dosimetrics Calculation ...43
Statistical Analysis ...46
Section 4.2 Results ...47
Section 4.3 Discussion ...57
References ...61
CHAPTER 5: CLINICAL IMPACT OF ACCUMULATED DOSE DEVIATION ...63
Introduction ...63
Section 5.1 Materials and Methods ...65
Data Collection and Processing Procedure ...65
Relative Seriality Model (s model) ...66
Statistical Analysis ...68
Section 5.2 Results ...69
Section 5.3 Discussion ...80
References ...83
CHAPTER 6: CONCLUSION ...88
APPENDIX 1: TARGET DELINEATION STATISTICAL MODEL AND PATIENT PARAMETER TABLES ...91
APPENDIX 2: PLAN AND WEEKLY ACCUMULATED DOSIMETRICS AGAINST DOSE CONSTRAINTS ...94
x
LIST OF TABLES
Table 3.1 – Average contour comparison metrics for the propagated contours
against the manual contours per imaging modality for all patients ...29
Table 3.2 – Subfactor analysis in Linear Mixed Effect model ...30
Table 4.1 – CTOR Dosimetrics Summary ...52
Table 4.2 – CBCT Dosimetrics Summary ...53
Table 4.3 – Similarity Summary ...56
Table 5.1 – Radiobiological Dosimetrics Summary ...69
Table 5.2 – 6 months Urinary PCSI Covariance Summary ...71
Table 5.3 – 12 months Urinary PCSI Covariance Summary ...72
Table 5.4 – 6 months Rectal PCSI Covariance Summary ...73
Table 5.5 – 12 months Rectal PCSI Covariance Summary ...74
Table 5.6 – 6 months Urinary Fixed Effect Solutions ...75
Table 5.7 – 12 months Urinary Fixed Effect Solutions ...76
Table 5.8 – 6 months Rectal Fixed Effect Solutions ...78
xi
LIST OF FIGURES
Figure 2.1 – Comparison of Dose Distribution for 3D-CRT, IMRT, and VMAT ...7
Figure 2.2 – Model of Optimization-based DIR Algorithm Functional Structure ...8
Figure 2.3 – Intensity-based DIR Bladder Daily Delivered Dose ...13
Figure 2.4 – Shadowed NIB DIR Bladder Daily Delivered Dose ...14
Figure 3.1 – Delineation Metric Data Processing Procedure ...22
Figure 3.2 – DIR Profile Propagated Contours against Manual Delineation ...22
Figure 3.3 – Contour Propagation Model Example ...23
Figure 3.4 – Point Estimates and Confidence Intervals for All Delineation Metrics and Comparisons ...27
Figure 3.5 – Point Estimates and Confidence Intervals for CTOR Delineation Metrics and Comparisons ...28
Figure 3.6 – Point Estimates and Confidence Intervals for CBCT Delineation Metrics and Comparisons ...29
Figure 3.7 – Metric evaluations for the Largest-Disparity CTOR Patient using the DIR Profile Propagation ...31
Figure 3.8 – Metric evaluations for the Smallest-Disparity CTOR Patient using the Shadowed NIB DIR Propagation ...32
Figure 3.9 – Metric evaluations for the Largest-Disparity CBCT Patient with DIR Profile Propagation ...33
Figure 3.10 – Metric evaluations for the Smallest-Disparity CBCT Patient with Shadowed NIB DIR ...34
Figure 4.1 – Dose Accumulation Data Processing Procedure ...43
Figure 4.2 – Contour Propagation Model ...44
Figure 4.3 – Contour Propagation Comparison ...45
xii
Figure 4.5 – Isodose Overlay ...48
Figure 4.6 – Accumulated Dose Volume Histograms by Modality ...49
Figure 4.7 – Contour-based Dose Volume Histograms by Accumulation Interval ...49
Figure 4.8 – Intensity-based Dose Volume Histograms by Accumulation Interval ...50
Figure 4.9 – Weekly Accumulated Dose Volume Histograms ...51
Figure 4.10 – Accumulation Algorithm CT Dosimetrics 95% Confidence Intervals...54
Figure 4.11 – Accumulation Algorithm CBCT Dosimetrics 95% Confidence Intervals ...55
Figure 4.12 – Accumulation Interval Dosimetrics 95% Confidence Intervals ...55
Figure 4.13 – Accumulation Interval Metric Differences 95% Confidence Intervals ...56
xiii
LIST OF ABBREVIATIONS
3D – CRT Three dimensional – conformal radiotherapy 3DCT Three dimensional computed tomography
ART Adaptive radiotherapy
CA California
CBCT Cone beam computed tomography
CI Confidence interval
CT Computed tomography
CTOR Computed tomography-on-rails
DBB Biologically effective uniform dose
DIR Deformable image registration
DSC Dice similarity coefficient
DVF Deformation vector field
DVH Dose volume histogram
FOV Field of view
FSU Functional sub-unit
HD Hausdorff distance
HU Hounsfield unit
IGRT Image-guided radiotherapy
IMRT Intensity-modulated radiotherapy IRCU Intermediate respiratory care unit
xiv
LME Linear mixed effect
MDA Mean distance-to-agreement
MIM Medical image management
NC North Carolina
NIB Normalized intensity-based
NTCP Normal tissue complication probability
OAR Organ-at-risk
OH Ohio
PCSI Prostate cancer symptom indices
pCT Planning computed tomography
PRO Patient-reported outcome
REML Restricted/residual maximum likelihood
RIR Rigid image registration
RT Radiotherapy treatment
UK United Kingdom
1
CHAPTER 1: INTRODUCTION
Recent technological advancements and improved computational capacity have made possible improved capabilities regarding the treatment of prostate cancer with adaptive
radiotherapy (ART). While recent advancements in detection and treatment methods have been made that have improved survival rates, prostate cancer remains the second most common cause of cancer-related deaths for men in the United States.1-3 Of 11,892 men analyzed over 36 clinical sites in a 2010 study, selection of primary treatment recorded approximately 50 percent
prostatectomy, 12 percent external beam radiation, 13 percent brachytherapy, and 14 percent androgen deprivation monotherapy.4 While these treatment options have similar survival rates, the side effects experienced differ significantly across treatments.2,5-8 Over half of the men diagnosed with prostate cancer recently were over the age of 60.1,4 External beam radiotherapy was more frequently chosen for older patients.4
ART utilizes fractional image guidance to improve conformity between the dose delivery projected from the planning CT (pCT) and the actually delivered dose throughout treatment. Due to the steep fall-off of the dose distribution around the target, which is created to spare the
organs-at-risk (OAR), a robust verification of dose delivery and quality assurance of the inverse treatment planning process is required. This demand for accurate delineation highlights the need for consideration of inter-fractional changes in organ position, alignment, and deformation.
2
size and shape of these organs. While rigid image registration (RIR) algorithms can provide translational and rotational correction between patient alignment during planning CT and daily treatments, deformable image registration (DIR) algorithms are needed to account for inter-fractional changes in organ deformation. Though current treatment protocols currently do not explicitly consider internal organ deformation throughout the course of treatment, estimation of the daily delivered dose has been predicated on the availability of accurate daily 3D patient geometry. The greatest challenge in reducing uncertainty in the delivery of radiation in the future remains correction for organ deformation throughout treatment.9
DIR has recently been used to remap each day’s dose from the fractional image guidance to the pCT, enabling algorithms to warp doses to a reference geometry and allowing comparison of dose volume histograms (DVH).10-13 The most reliable DIR algorithms currently in use rely on automated intensity-based spatial information of a reference and target image, manual geometric contour-based segmentation information from physician guidance, or a hybrid semi-automated model incorporating both intensity-based spatial information and geometric contour-based segmentation information. In order for ART to be most effective, consideration must be given to the specific anatomy for which each fraction of treatment was administered.
3
functions and the s model as an indicator for organ seriality enables calculation of the normal tissue complication probability (NTCP), a parameter indicative of the degree of healthy tissue toxicity induced by radiotherapy.14
While it is well established that intensity-modulated radiation therapy (IMRT) and volumetric modulated arc therapy (VMAT) impact patient-reported outcomes (PRO), the association of dose accumulated in the bladder and rectum in a manner that explicitly considers inter-fractional organ deformation and PRO is not well-studied. The potential relationship of deviation in accumulated dose from the planned dose with PRO and NTCP has not been quantified.
This dissertation examines the effects of anatomical deformations of the bladder and rectum on the accumulated dose and investigates the association between PRO and accumulated dose characterized by the DVH and s model dosimetric parameters. Chapter 2 characterizes organ deformation throughout treatment and DIR. Chapter 3 assesses the performance and limitations of contour propagation with three commercial DIR algorithms using daily scans of CT-on-rails (CTOR) and CBCT in image guided prostate therapy patients treated with
4
REFERENCES
[1] S. M. Alibhai et al., "30-day mortality and major complications after radical
prostatectomy: influence of age and comorbidity," (in ENG), J Natl Cancer Inst, vol. 97, no. 20, pp. 1525-32, Oct 2005.
[2] American Cancer Society, "Cancer Facts and Figures 2014," Atlanta 2018.
[3] J. H. Mydlo and C. J. Godec, M. Conner, Ed. Prostate Cancer Science and Clinical Practice, Second ed. Oxford, UK: Mica Haley, 2016.
[4] M. R. Cooperberg, J. M. Broering, and P. R. Carroll, "Time trends and local variation in primary treatment of localized prostate cancer," (in ENG), J Clin Oncol, vol. 28, no. 7, pp. 1117-23, Mar 2010.
[5] M. Alemozaffar et al., "Prediction of erectile function following treatment for prostate cancer," (in ENG), JAMA, vol. 306, no. 11, pp. 1205-14, Sep 2011.
[6] R. C. Chen, J. A. Clark, and J. A. Talcott, "Individualizing quality-of-life outcomes reporting: how localized prostate cancer treatments affect patients with different levels of baseline urinary, bowel, and sexual function," (in ENG), J Clin Oncol, vol. 27, no. 24, pp. 3916-22, Aug 2009.
[7] L. Murray, A. Henry, P. Hoskin, F. A. Siebert, J. Venselaar, and P. g. o. G. ESTRO, "Second primary cancers after radiation for prostate cancer: a systematic review of the clinical data and impact of treatment technique," (in ENG), Radiother Oncol, vol. 110, no. 2, pp. 213-28, Feb 2014.
[8] S. Quint, H. C. de Boer, J. R. van Sörnsen de Koste, B. J. Heijmen, and M. J. Olofsen-van Acht, "Set-up verification of cervix cancer patients treated with long treatment fields; implications of a non-rigid bony anatomy," (in ENG), Radiother Oncol, vol. 60, no. 1, pp. 25-9, Jul 2001.
[9] C. S. Hamilton and M. A. Ebert, "Volumetric uncertainty in radiotherapy," (in ENG),
Clin Oncol (R Coll Radiol), vol. 17, no. 6, pp. 456-64, Sep 2005.
[10] P. Castadot, J. A. Lee, X. Geets, and V. Grégoire, "Adaptive radiotherapy of head and neck cancer," (in ENG), Semin Radiat Oncol, vol. 20, no. 2, pp. 84-93, Apr 2010. [11] D. L. Schwartz and L. Dong, "Adaptive radiation therapy for head and neck cancer-can
an old goal evolve into a new standard?," (in ENG), J Oncol, vol. 2011, 2011.
5
[13] C. Veiga et al., "Toward adaptive radiotherapy for head and neck patients: Feasibility study on using CT-to-CBCT deformable registration for "dose of the day" calculations," (in ENG), Med Phys, vol. 41, no. 3, p. 031703, Mar 2014.
6
CHAPTER 2: INTERNAL ORGAN DEFORMATION AND DEFORMABLE IMAGE REGISTRATION
Introduction
7
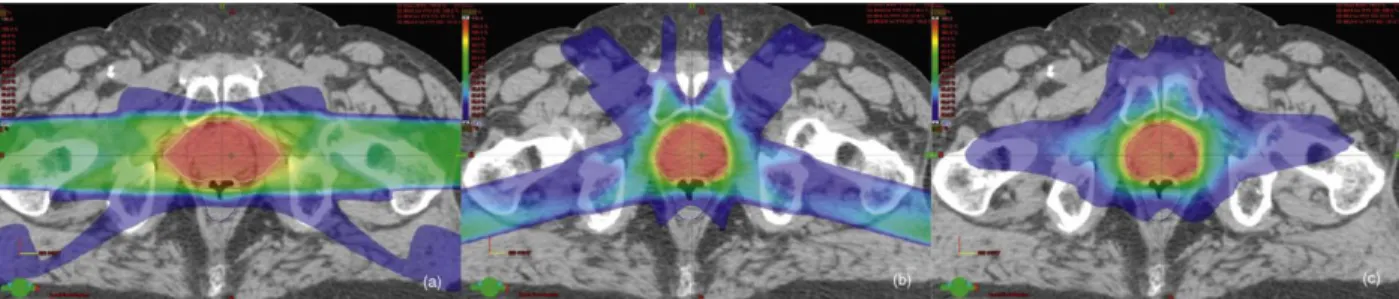
Fig. 2.1. Comparison of Dose Distribution for 3D-CRT, IMRT, and VMAT. The images represent the dose distribution at the same axial slice of a patient receiving prostate only therapy utilizing (left) 3D-CRT, (middle) static beam IMRT, and (right) VMAT. Doses are represented by color wash with the lowest dose shown at 30% isodose in blue, and maximum dose in red. The white line contoured in each image represents the 100% isodose line. The red lines are the prostate PTV and the blue lines the rectal contour. The conformality index (volume receiving 100% dose/volume of PTV) was calculated for each; 3D-CRT – 1.63, IMRT – 0.97, VMAT – 1.06. Adapted from Prostate Cancer Science and Clinical Practice.3
Section 2.1 Deformable Image Registration Model
DIR is a mature field that has utilized many approaches to transformation and criteria matching in previous work during registration of a reference and target (review articles).13,14 Fig. 2.2 shows a model of optimization-based DIR algorithm functional structure.13 Objective
8
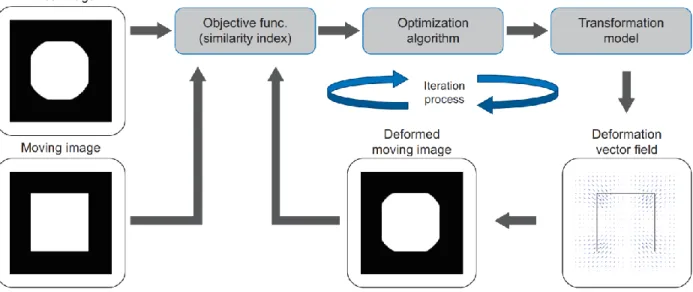
Fig. 2.2. Model of Optimization-based DIR Algorithm Functional Structure. The similarity index is calculated given a fixed (reference) image and a moving (target) image. The optimization algorithm tries to maximize the similarity index by changing DVF and the moving image is deformed based on the DVF. The similarity index is recalculated with the deformed moving image and the fixed image. This optimization process is done iteratively until the improvement of the similarity index reaches its target.Adapted from Oh & Kim (2017).13
Transformation models in DIR algorithms can utilize a parametric approach, in which linear combinations of their basis functions are utilized to generate the DVF, or a nonparametric approach, in which the deformation vector field is generated from transformation vectors
calculated for each voxel.13,14,17 Multi-resolution transformation models that approach registration with a coarse-to-fine refinement of the DVF are common.13,19 Transformation models generate the DVF based on information derived from physical models, interpolation theory, biomechanical models, and task-specific constraints.14,19-29 Other approaches utilize statistical modeling in fast registration procedures that do not rely on parametric
9
Section 2.2 Deformable Image Registration Objective Functions
Objective functions utilized in DIR rely on information obtained from image intensity, feature extraction, or some aggregate thereof.13
Intensity-based Deformable Image Registration Objective Functions
Categorically, intensity-based DIR models consider the intensity gradients of the pixels or voxels in the reference and target images in order to match criteria and drive optimization of the transformation model. Mutual information, a concept from information theory, is the typical basis for modern intensity-based objective functions.13,32,33 Other criteria include normalized mutual information, sum of squared differences, and cross-correlation.13,14 Intensity-based DIR approaches are typically fast, objective, fully automated, and reliable for small discrepancies, but often struggle to accurately accommodate large geometric deformations, as frequently occurs with the bladder and rectum during treatment.
Contour-based Deformable Image Registration Objective Functions
10
approaches also ignore intensity-based spatial information, rendering them less reliable when incorporating inter-related organ movements in intra-modality settings.29
Hybrid Deformable Image Registration Objective Functions
Hybrid DIR algorithms mathematically incorporate multiple sources of information described above to calculate a deformation vector field that is influenced by more than one such approach.13,14,16,18 Information from feature-based objective functions are typically introduced in order to regularize and constrain an intensity-based approach and prevent physically
unreasonable deformations.13,16 The resulting hybridized objective function is a linear
combination of image similarity and regularization terms that incorporates image intensity-based and feature extraction through manual or automated means.13-27 Hybrid DIR objective functions are capable of mitigating the drawbacks of individual approaches described above, but in doing say may also impact some of the advantages or introduce additional drawbacks. The nature of a hybrid DIR approach from the perspective of advantages and disadvantages depends upon the individual algorithms from which it is derived as well as the combinatorial method implemented.
Section 2.3 Deformable Image Registration Transformation Models
11
Transformation Models Based on Physical Phenomena
Transformation models that are inspired from physical phenomena may be divided into those that consider elastic body models, viscous fluid flow models, diffusion models, curvature registration, and flows of diffeomorphisms.14,34 Elastic body models utilize the Navier-Cauchy partial differential equation to describe the deformation between reference and target.20 While transformation models are not necessarily symmetric, constraints may be implemented with elastic body models to enforce symmetric criteria in which the reverse deformation closely approximates the inverse DVF.14
Viscous fluid flow models consider the Navier-Stokes equation under laminar flow conditions in order to recover large deformations between reference and target image.14,34,35 Viscous fluid flow transformation models employ constraints on the Jacobian to ensure that the registration between reference and target is physically reasonable.
A commonly employed transformation model based on a diffusion model, inspired by Maxwell’s demons, is the well-known “demons” algorithm.28,29
The demons algorithm is characterized as an optical flow method in which the deformation vector field may be modeled by an analogous diffusion process whereby the target image “diffuses” through the boundaries of the reference image. Curvature registration and flows of diffeomorphism models are
regularization techniques employed to accommodate large-scale affine transformations simultaneously with deformations.14
Transformation Models Based on Interpolation Theory
free-12
form deformation models.13-15,17,19 Radial basis functions are effective when employed in situations containing irregularly placed, sparsely populated known values. Elastic body splines incorporating constraints from the Navier-Cauchy equation are commonly implemented for situations in which a homogeneous, isotropic, and elastic structure is deformed under mechanical load.14 Free-form deformation models are a parametric approach that utilize a dense deformation in which the reference and target images are superimposed.14,19 While free-form deformation models usually do not guarantee a positive Jacobian, they are often implemented with elastic body spline or diffusion-based constraints intended to limit folds and tears in the DVF.19 Transformation Models Based on Biomechanical Properties
Biomechanical model-based DIR approaches have been validated for calculation of accumulated dose and are commercially available on platforms such as RayStation.36 They utilize knowledge of tissue mechanical properties to generate robust, informed deformation vector fields. However, biomechanical model-based DIR approaches cannot be implemented without specifying tissue mechanical properties which may introduce a source of inaccuracy. Though implementation of automated approaches are possible that reduce radiation oncologist demand, biomechanical model-based DIR algorithms are computationally demanding, requiring more robust processing hardware and longer processing delays, making them impractical for widespread clinical use.21,29,36
Section 2.4 Impact of Internal Organ Deformation on Daily Delivered Dose
13
developed to estimate daily delivered dose by using the DIR algorithms to register the pCT with daily CBCT image guidance for patients treated with VMAT. Fig. 2.3 displays the DVHs obtained for the bladder for two example patients using the fully automated workflow,
illustrating the variation in daily delivered dose from the scaled planned dose that accompanies large internal organ deformations. Fig. 2.4 displays DVHs for daily delivered dose for weekly selected image guidance, upon which a physician delineated the OARs, using the hybrid DIR algorithm. Fig. 2.4 verifies the inter-fraction variation in daily delivered dose reported by the fully automated, intensity-based DIR algorithm in Fig. 2.3.
Fig. 2.3 Intensity-based DIR Bladder Daily Delivered Dose. Left) Dose Volume Histogram plots for daily delivered dose for patient 1 and Right) Dose Volume Histogram plots for daily delivered dose for patient 2. The Dose Volume Histogram calculated from the planning CT is shown for each patient is shown as the dashed line.
14
deformation on daily delivered dose. Chapter 3 investigates metrics for validation of the employed DIR algorithms, while Chapter 4 demonstrates the impact of internal organ deformation on accumulated delivered dose compared to plan dose. Chapter 5 examines the effect of accumulated delivered dose on patient reported outcome.
15
REFERENCES
[1] P. Mavroidis et al., "Assessing the difference between planned and delivered intensity-modulated radiotherapy dose distributions based on radiobiological measures," (in ENG),
Clin Oncol (R Coll Radiol), vol. 18, no. 7, pp. 529-38, Sep 2006.
[2] C. Veiga et al., "Toward adaptive radiotherapy for head and neck patients: Feasibility study on using CT-to-CBCT deformable registration for "dose of the day" calculations," (in ENG), Med Phys, vol. 41, no. 3, p. 031703, Mar 2014.
[3] J. H. Mydlo and C. J. Godec, M. Conner, Ed. Prostate Cancer Science and Clinical Practice, Second ed. Oxford, UK: Mica Haley, 2016.
[4] J. Boda-Heggemann, F. Lohr, F. Wenz, M. Flentje, and M. Guckenberger, "kV cone-beam CT-based IGRT: a clinical review," (in ENG), Strahlenther Onkol, vol. 187, no. 5, pp. 284-91, May 2011.
[5] C. S. Hamilton and M. A. Ebert, "Volumetric uncertainty in radiotherapy," (in ENG),
Clin Oncol (R Coll Radiol), vol. 17, no. 6, pp. 456-64, Sep 2005.
[6] J. M. Kapatoes, G. H. Olivera, K. J. Ruchala, and T. R. Mackie, "On the verification of the incident energy fluence in tomotherapy IMRT," (in ENG), Phys Med Biol, vol. 46, no. 11, pp. 2953-65, Nov 2001.
[7] J. M. Kapatoes, G. H. Olivera, K. J. Ruchala, J. B. Smilowitz, P. J. Reckwerdt, and T. R. Mackie, "A feasible method for clinical delivery verification and dose reconstruction in tomotherapy," (in ENG), Med Phys, vol. 28, no. 4, pp. 528-42, Apr 2001.
[8] D. A. Low et al., "Quantitative dosimetric verification of an IMRT planning and delivery system," (in ENG), Radiother Oncol, vol. 49, no. 3, pp. 305-16, Dec 1998.
[9] A. E. Lujan, J. M. Balter, and R. K. Ten Haken, "A method for incorporating organ motion due to breathing into 3D dose calculations in the liver: sensitivity to variations in motion," (in ENG), Med Phys, vol. 30, no. 10, pp. 2643-9, Oct 2003.
[10] N. Papanikolaou, Y. Yan, J. Penagaricano, and R. V, "The impact of daily patient setup errorand tissue inhomogeneity on PTV coverage and OAR avoidance using IMRT,"
Medical Physics, vol. 29, p. 1286, 2002.
[11] W. S, Intensity-modulated radiation therapy. Bristol: IOP Publishing, 2000.
16
[13] S. Oh and S. Kim, "Deformable image registration in radiation therapy," Radiat Oncol J,
vol. 35, no. 2, pp. 101-111, Jun 2017, doi: 10.3857/roj.2017.00325.
[14] A. Sotiras, C. Davatzikos, and N. Paragios, "Deformable medical image registration: a survey," IEEE Trans Med Imaging, vol. 32, no. 7, pp. 1153-90, Jul 2013, doi:
10.1109/TMI.2013.2265603.
[15] A. Godley, E. Ahunbay, C. Peng, and X. A. Li, "Automated registration of large
deformations for adaptive radiation therapy of prostate cancer," Med Phys, vol. 36, no. 4, pp. 1433-41, Apr 2009, doi: 10.1118/1.3095777.
[16] O. Weistrand and S. Svensson, "The ANACONDA algorithm for deformable image registration in radiotherapy," Med Phys, vol. 42, no. 1, pp. 40-53, Jan 2015, doi: 10.1118/1.4894702.
[17] P. Castadot, J. A. Lee, A. Parraga, X. Geets, B. Macq, and V. Grégoire, "Comparison of 12 deformable registration strategies in adaptive radiation therapy for the treatment of head and neck tumors," Radiother Oncol, vol. 89, no. 1, pp. 1-12, Oct 2008, doi: 10.1016/j.radonc.2008.04.010.
[18] Y. Takayama et al., "Evaluation of the performance of deformable image registration between planning CT and CBCT images for the pelvic region: comparison between hybrid and intensity-based DIR," J Radiat Res, vol. 58, no. 4, pp. 567-571, Jul 2017, doi: 10.1093/jrr/rrw123.
[19] P. B. Johnson, K. R. Padgett, K. L. Chen, and N. Dogan, "Evaluation of the tool "Reg Refine" for user-guided deformable image registration," J Appl Clin Med Phys, vol. 17, no. 3, pp. 158-170, 05 2016, doi: 10.1120/jacmp.v17i3.6025.
[20] C. Broit. “Optimal registration of deformed images,” University of Pennsylvania, 1981. [21] J. R. Crouch, S. M. Pizer, E. L. Chaney, Y. C. Hu, G. S. Mageras, and M. Zaider,
"Automated finite-element analysis for deformable registration of prostate images," IEEE Trans Med Imaging, vol. 26, no. 10, pp. 1379-90, Oct 2007, doi:
10.1109/TMI.2007.898810.
[22] M. H. Davis, A. Khotanzad, D. P. Flamig, and S. E. Harms, "A physics-based coordinate transformation for 3-D image matching," IEEE Trans Med Imaging, vol. 16, no. 3, pp. 317-28, Jun 1997, doi: 10.1109/42.585766.
[23] M. Foskey et al., "Large deformation three-dimensional image registration in image-guided radiation therapy," Phys Med Biol, vol. 50, no. 24, pp. 5869-92, Dec 2005, doi: 10.1088/0031-9155/50/24/008.
17
a statistical regularization framework for non-linear registration," Med Image Comput Comput Assist Interv, vol. 8, no. Pt 2, pp. 943-50, 2005.
[25] D. Rueckert, P. Aljabar, R. A. Heckemann, J. V. Hajnal, and A. Hammers,
"Diffeomorphic registration using B-splines," Med Image Comput Comput Assist Interv,
vol. 9, no. Pt 2, pp. 702-9, 2006.
[26] Z. Xu et al., "Comparison of User-Directed and Automatic Mapping of the Planned Isocenter to Treatment Space for Prostate IGRT," Int J Biomed Imaging, vol. 2013, p. 892152, 2013, doi: 10.1155/2013/892152.
[27] L. Zagorchev and A. Goshtasby, "A comparative study of transformation functions for nonrigid image registration," IEEE Trans Image Process, vol. 15, no. 3, pp. 529-38, Mar 2006.
[28] J. P. Thirion, "Image matching as a diffusion process: an analogy with Maxwell's demons," Med Image Anal, vol. 2, no. 3, pp. 243-60, Sep 1998.
[29] H. Wang et al., "Validation of an accelerated 'demons' algorithm for deformable image registration in radiation therapy," Phys Med Biol, vol. 50, no. 12, pp. 2887-905, Jun 2005, doi: 10.1088/0031-9155/50/12/011.
[30] C. R. Chou, B. Frederick, G. Mageras, S. Chang, and S. Pizer, "2D/3D Image
Registration using Regression Learning," Comput Vis Image Underst, vol. 117, no. 9, pp. 1095-1106, Sep 2013, doi: 10.1016/j.cviu.2013.02.009.
[31] Y. Shi, S. Liao, and D. Shen, "Learning statistical correlation for fast prostate registration in image-guided radiotherapy," Med Phys, vol. 38, no. 11, pp. 5980-91, Nov 2011, doi: 10.1118/1.3641645.
[32] G. Dougherty, Digital image processing for medical applications. Cambridge ; New York: Cambridge University Press, 2009, pp. xii, 447 p., 21 p. of plates.
[33] D. L. Hill, P. G. Batchelor, M. Holden, and D. J. Hawkes, "Medical image registration,"
Phys Med Biol, vol. 46, no. 3, pp. R1-45, Mar 2001.
[34] J Modersitzki. Numerical methods for image registration. Oxford University Press, New York, USA: 2004.
[35] G. E. Christensen, R. D. Rabbitt, and M. I. Miller, "Deformable templates using large deformation kinematics," IEEE Trans Image Process, vol. 5, no. 10, pp. 1435-47, 1996, doi: 10.1109/83.536892.
18
CHAPTER 3: TARGET DELINEATION METRICS
Introduction
Since 1983, only lung and bronchus cancer has caused more cancer deaths in men than prostate cancer.1 Recently, survival rates have increased due to advancements in detection and treatment methods.2,3 Development in supporting technologies for external beam radiation therapy such as adoption of 3D-CT imaging, multileaf collimators, and advanced planning software has allowed for the clinical implementation of IMRT for the treatment of prostate cancer.2 The standard of care now incorporates daily image guidance for external beam radiation therapy in the form of CT, CBCT, radiofrequency waves with fiducial markers, or ultrasound.2,4 Daily image guidance allows for precise translational corrections of patient position and
alignment prior to each fractional treatment.4-9
ART utilizes fractional image guidance to improve conformity between the planned dose, as projected from the pCT, and the actually delivered dose throughout the course of the
19
most effective, consideration must be given to the specific anatomy for which each fraction of treatment was administered.
IMRT utilizes fractional alignment images and fiducial markers to ensure accurate localization and alignment of the patient prior to treatment. Rigid registration algorithms can provide translational and rotational corrections in patient alignment between planning CT and daily treatments. DIR algorithms provide superior agreement between two registered images compared to rigid registration, allowing for accurate transfer of contours of interest on one image set to another by accounting for internal organ deformations and specific daily anatomy in a manner that rigid registration alone cannot.
Recent studies have assessed the delineation of OARs in prostate cancer for
20
Section 3.1 Materials and Methods
Dataset Characterization
20 prostate cancer patients treated with IMRT and VMAT were selected for analysis. Image guidance was applied at every fraction for all patients. For the 10 IMRT patients, the CTOR system was used for image guidance, whereas the remaining 10 VMAT patients were treated using the kV-CBCT modality of the Elekta Versa system. Each patient’s initial data included the pCT with contours for the targets and OARs and fractional CT or CBCT scans. The image resolution of the fractional CTs was 0.98 mm x 0.98 mm with 3 mm slice thickness, while the fractional CBCTs were acquired at 1 mm x 1 mm resolution with 3 mm slice thickness. A total of 453 fractions across those 20 patients were analyzed using bladder and rectum as OARs. Manual Fractional Contour Delineation
Image data were imported to MIM version 6.8 beta (MIM Software, Inc., Cleveland, OH). For 10 of the patients (5 CTOR and 5 CBCT), the contours for the bladder and the rectum were manually delineated on each fraction by a radiation oncologist. The remaining 10 patients had manually delineated contours on the initial five fractions and weekly thereafter.
Automated Registration and Contour Propagation
21
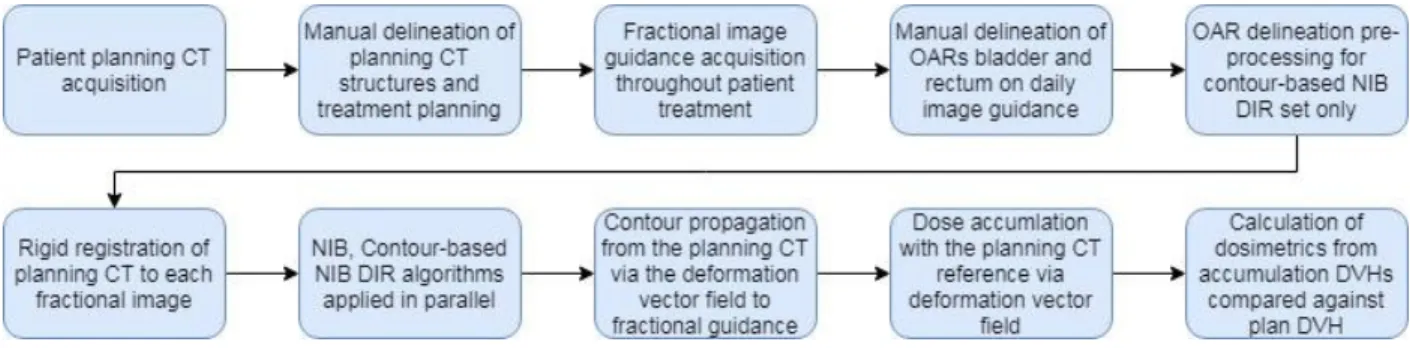
approach when determining appropriate corresponding locations in the target volume. NIB DIR algorithm applies normalization of intensity values to each target volume before implementing a nonaffine intensity-based objective function defining the registration. The workflow registers each fraction for which manually delineated contours were generated with the pCT as reference. The resulting deformation vector field for each registration was applied to propagate the contours for the OARs bladder and rectum from the pCT to each fractional image. A flowchart depicting a graphical representation of the data processing procedure is shown in Fig. 3.1. Fig. 3.2 provides examples of typical manually drawn contours and propagated contours from the DIR Profile and NIB algorithms.
Shadowed NIB Contour Propagation
This algorithm employs contour-based approaches as well as NIB DIR. After the manual delineation of bladder and rectum on the IGRT scans, a contrast enhancement of the interior regions of the defined volumes was applied. A scalar addition of +800 Hounsfield Units (HU) was applied to all voxels within physician-defined bladder contours, establishing a contrast gradient similar to bone surrounded by soft tissue while preserving intensity fluctuations among the voxels. Because the presence of bowel gas causes intensity values of voxels within the rectum to have a very high range relative to the soft tissue surrounding it, a flat value mask was applied at +500 HU within the contours specified by radiation oncologists. Rigid registration and NIB DIR were subsequently applied between each fractional scan and the respective pCT and the contours of bladder and rectum were propagated to each fractional image via the resulting
22
Fig. 3.1. Delineation Metric Data Processing Procedure. Graphical representation of the data processing undergone for each patient outlining the stages necessary to compare delineation methods.
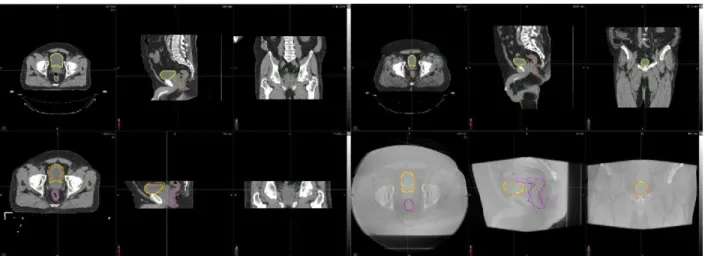
Fig. 3.2. DIR Profile Propagated Contours against Manual Delineation. Top left: Planning CT for a CTOR patient with delineations for the bladder (yellow) and rectum (brown) in the axial (left), sagittal (center), and coronal (right) planes. Bottom left: Fractional image guidance CT for the CTOR patient’s fifth fraction with propagated contours for
bladder (yellow) and rectum (brown) shown against manually delineated contours for bladder (orange) and rectum (purple) in the axial (left), sagittal (center), and coronal (right) planes. Top right: Planning CT for CBCT patient with delineations for bladder (yellow) and rectum (brown) in the axial (left), sagittal (center), and coronal (right) planes. Bottom right: Fractional image guidance CBCT for the patient’s twelfth fraction with propagated contours
23
Contour Set Comparison
Manual delineation and the three contour propagation DIR algorithms applied (DIR Profile, Normalized Intensity-Based, and Shadowed Normalized Intensity-Based) for the OARs bladder and rectum yielded six sets of comparisons for each OAR outlined below:
1) Manual vs. DIR Profile Bladder 2) Manual vs. NIB Bladder
3) Manual vs. Shadowed NIB Bladder 4) Manual vs. DIR Profile Rectum 5) Manual vs. NIB Rectum
6) Manual vs. Shadowed NIB Rectum
Fig. 3.3. Contour Propagation Model Example. Left: Original CBCT image data for the first fractional treatment of a prostate cancer patient treated with the Versa system. Contours of the bladder and rectum shown in red are the contours manually delineated on the CBCT. Contours in yellow are NIB contours propagated from the planning CT structures. Right: The same CBCT image data following contrast enhancement via the manually drawn contours (red) that enables the shadowed NIB contour propagation (yellow).
24
1) Hausdorff Distance (HD): The greatest distance of a point in one set to the closest point in another set, defined for single-sided comparisons as
HDS max (A,B) = maxaϵA { d (a, B) } (3.1)
where A and B are sets of points, a is a single point in set A, d(a, B) denotes the minimal distance between point a and any point in set B, and HDS max is the single-sided Hausdorff distance. Symmetric Hausdorff distance is calculated by:
HD max (A,B) = max { HDS max (A,B), HDS max (B,A) } (3.2)
A higher HD between two sets A and B indicates the existence of pockets of dissimilarity between the two sets, whereas a HD of zero indicates that the sets A and B are identical.
2) Mean Distance-to-Agreement (MDA): Mean voxelwise comparison of distance between two associative points in the contour sets A and B, defined by
MDA (A,B) = meanaϵA, bϵB { d (a, B) ᴜ d (b,A) } (3.3)
25
across all points in the sets A and B, MDA is less sensitive than HD to small pockets of high dissimilarity.
3) Dice Similarity Coefficient (DSC): Coefficient describing similarity of two regions by relating the non-overlapping volume and the volumetric sum of the regions of interest, defined for volumes V1 and V2 by
DSC = (V1, V2) = 2 |V1 ∩ V2| / |V1| + |V2| (3.4)
where a DSC of zero indicates two volumes that do not overlap and a DSC of one indicates that the volumes V1and V2 are identical.
4) Jaccard Index (JI): Ratio of the volume of overlap and the combined volume of two volumes V1 and V2, defined by
JI = |V1 ∩ V2| / |V1∪ V2| (3.5)
where a JI of zero indicates two volumes that do not overlap and a JI of one indicates that the volumes V1and V2 are identical.
26
Statistical Analysis
We analyzed the difference of contour similarity metrics (HD, MDA, DSC, JI) between different algorithms (DIR, NIB, shadowed NIB) against manual contouring, using linear mixed effect (LME) models. Given an algorithm (e.g., DIR) and a metric (e.g., HD), there was one observed subfactor metric value per subject per fraction (of radiotherapy). The observed metric values were clustered within subjects (patients) and were thus correlated. The LME model was used to account for such correlated data. Specifically, in the LME model, the metric value (e.g., HD) was the response variable, and the fixed effect was the algorithm, DIR or manual if we compared DIR with manual, and the random effect was the subject. In addition, in the LME model, we added fraction as a covariate to adjust its effect, and we assumed the random errors over fractions (within a subject) followed an auto-correlation structure, AR(1). The difference between an algorithm and the manual method was claimed as significant if the corresponding estimated regression coefficient was significantly different from 0, based on the Wald-type test at 2-sided alpha level 0.05. The LME model analysis was conducted using SAS 9.4 (SAS Institute Cary, NC).
Section 3.2 Results
27
(i.e., DIR Profile, NIB-DIR, shadowed NIB-DIR) is consistent across both OAR (bladder or rectum) and comparison metrics (e.g., distances).
Table 3.1 displays the average comparison metrics for all the propagated contours against the manual contours for all patients for the two imaging modalities. The shadowed NIB
propagated contours were substantially more similar to the manual contours than the DIR Profile or NIB contours for the both CTOR and CBCT imaging modalities (Figs. 3.4-3.6).
28
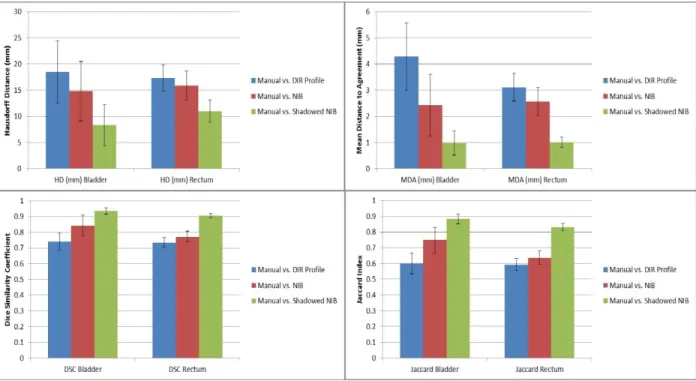
Fig. 3.5. Point Estimates and Confidence Intervals for CTOR Delineation Metrics and Comparisons. Point estimates are shown as bars, where the 95% Confidence Intervals are shown as error bars for each point estimate. In each subplot, the results for the bladder (left) and rectum (right) for each contour set comparison are shown. Top left: Hausdorff estimates. Top right: Mean Distance to Agreement estimates. Bottom left: Dice Similarity Coefficient estimates. Bottom right: Jaccard estimates. This analysis includes all the CTOR patients.
29
Fig. 3.6. Point Estimates and Confidence Intervals for CBCT Delineation Metrics and Comparisons. Point estimates are shown as bars, where the 95% Confidence Intervals are shown as error bars for each point estimate. In each subplot, the results for the bladder (left) and rectum (right) for each contour set comparison are shown. Top left: Hausdorff estimates. Top right: Mean Distance to Agreement estimates. Bottom left: Dice Similarity Coefficient estimates. Bottom right: Jaccard estimates. This analysis includes all the CBCT patients.
Table 3.1. Average contour comparison metrics for the propagated contours against the manual contours per imaging modality for all patients. The unit for the metrics HD and MDA is mm.
Comparison Modality HD Bladder
MDA Bladder
DSC Bladder
Jaccard Bladder
HD Rectum
MDA Rectum
DSC Rectum
Jaccard Rectum Manual vs.
DIR Profile
CT 18.40 4.47 0.729 0.589 16.37 2.96 0.737 0.593 CBCT 20.81 4.66 0.737 0.598 16.87 3.10 0.726 0.575 Manual vs.
NIB
CT 15.32 2.58 0.833 0.730 15.23 2.44 0.777 0.643 CBCT 22.57 4.68 0.713 0.573 18.49 3.29 0.710 0.557 Manual vs.
Shadowed NIB
30
Table 3.2 displays the p-values associated with the subfactor analysis for CBCT and fraction dependency based on the Linear Mixed Effect model analysis. In the comparisons of the subfactor metrics of NIB vs manual, and Shadowed NIB vs manual, we found significant
differences (p-value < 0.05) in 12 of the 16 imaging modality tests. We did not find significant difference between DIR and manual contours in subfactor metrics. Although we controlled for fraction in the LME analysis, subfactor metrics did not vary with fraction in all comparisons, except for the comparison in MDA between Shadowed NIB vs manual for rectum (p-value = 0.05).
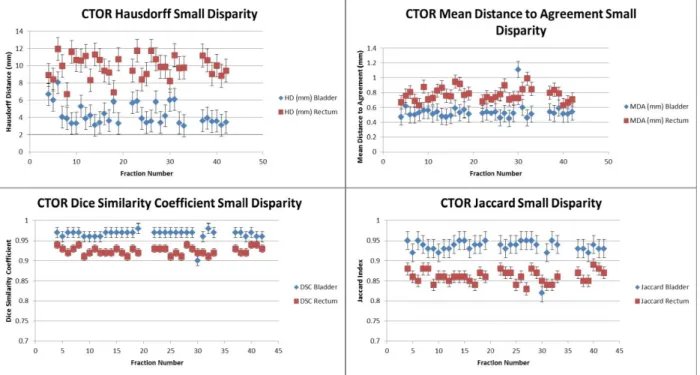
Fig. 3.7 displays the distribution of the different metric evaluations for the CTOR patients with the largest contour disparity between delineation methods (DIR Profile). Similarly, Fig. 3.8 displays the metric evaluations for the CTOR patient with the smallest contour disparity between delineation methods (Shadowed NIB DIR).
Table 3.2. Subfactor analysis in Linear Mixed Effect model. Every metric’s p-values for the associated metrics are shown. The statistically significant values (p-value < 0.05) are shown in bold.
Comparison Subfactor HD Bladder MDA Bladder DSC Bladder Jaccard Bladder HD Rectum MDA Rectum DSC Rectum Jaccard Rectum Manual vs. DIR Profile
CTOR/CBCT 0.68 0.80 0.87 0.90 0.72 0.84 0.54 0.44 Fraction 0.46 0.18 0.17 0.14 0.35 0.51 0.77 0.96 Manual vs.
NIB
CTOR/CBCT 0.08 0.01 0.02 0.01 0.03 0.01 <0.01 <0.01 Fraction 0.60 0.64 0.49 0.25 0.58 0.37 0.34 0.30 Manual vs.
Shadowed NIB
31
Fig. 3.7. Metric evaluations for the Largest-Disparity CTOR patient using the DIR Profile Propagation. The values of the metrics are shown for each fraction and were derived by comparing the DIR Profile contour propagation with the manually delineated contours. The metrics that were used are the Hausdorff distance (top left), Mean Distance to Agreement (top right), Dice Similarity Coefficient (bottom left), and Jaccard index (bottom right).
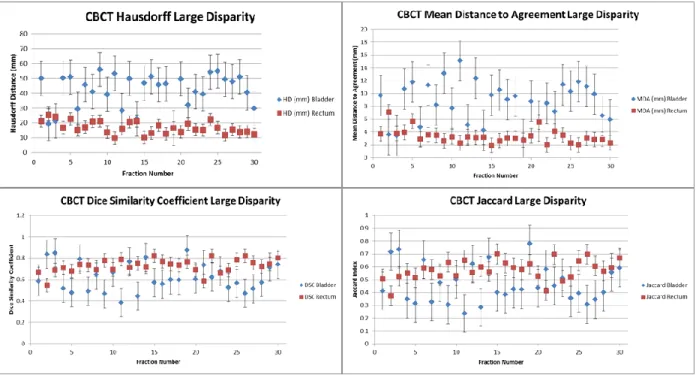
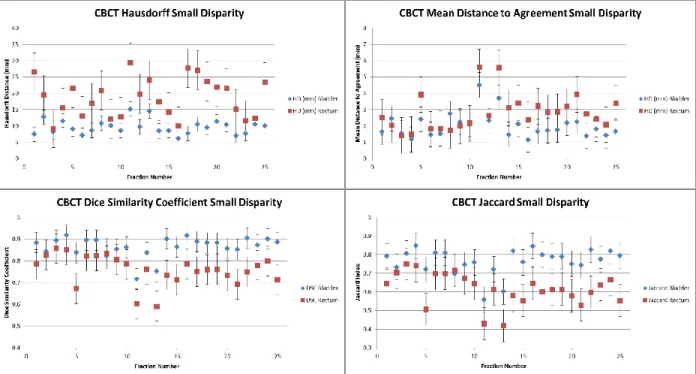
Fig. 3.9 displays the metric evaluations for the CBCT patient with the largest contour disparity between manual and automated delineation method (DIR Profile). Fig. 3.10 displays the metric evaluations for the CBCT patient with the smallest contour disparity between manual and automated delineation methods. The relationship of agreement between contour sets remains nearly constant over all the measured fractions. Nearly all the fractions for each patient possesses greater agreement for the same OAR over the other, though which OAR possesses greater
32
Fig. 3.8. Metric evaluations for the Smallest-Disparity CTOR Patient using the Shadowed NIB DIR Propagation. The values of the metrics are shown for each fraction and were derived by comparing the shadowed NIB DIR contour propagation with the manually delineated contours. The metrics that were used are the Hausdorff distance (top left), Mean Distance to Agreement (top right), Dice Similarity Coefficient (bottom left), and Jaccard index (bottom right).
While the four measured contour comparison metrics are sensitive to different characteristics of similarities and dissimilarities between compared sets, a great deal of
agreement among them was observed across all the patients. Because metric performance varies only slightly across fractions for a patient, weekly contour propagation models provide a
reasonable approximation of daily contour propagation models (Fig. 3.4).
33
Fig. 3.9. Metric evaluations for the Largest-Disparity CBCT patient with DIR Profile Propagation. The values of the metrics are shown for each fraction and were derived by comparing the DIR Profile contour propagation with the manually delineated contours. The metrics that were used are the Hausdorff distance (top left), Mean Distance to Agreement (top right), Dice Similarity Coefficient (bottom left), and Jaccard index (bottom right).
The greater variability in HD and MDA against DSC and JI across all the patients indicates regions of local contour set dissimilarities, though average similarity over the entire contour set remains comparatively constant (Fig. 3.4). Greater contour set agreement observed for CTOR patients as opposed to CBCT patients is driven by the superior normalized-intensity tissue contrast inherent to CTOR image guidance modality. A greater number of metrics for intensity-based algorithms reported differences for rectum than for bladder (Table 3.1). This is indicative of the greater tissue contrast between bladder and surrounding tissues on CT
34
Fig. 3.10. Metric evaluations for the Smallest-Disparity CBCT patient with Shadowed NIB DIR. The values of the metrics are shown for each fraction and were derived by comparing the shadowed NIB DIR contour propagation with the manually delineated contours. The metrics that were used are the Hausdorff distance (top left), Mean Distance to Agreement (top right), Dice Similarity Coefficient (bottom left), and Jaccard index (bottom right).
Section 3.3 Discussion
The high variance of Hausdorff distance for bladder compared to the results for the rectum indicates greater discord in the existence of pockets of dissimilarity across fractions. This appears to result from fractions for which large deformations of the bladder caused by variable degrees of filling are not correctly captured by the DIR algorithm. The large deformations
present in these fractions may cause the relatively high HU gradient present at the bladder wall to exceed the proximity limitation of the DIR algorithm intended to prevent excessive image
35
exhibiting sufficiently large deformations to bladder anatomy relative to the pCT. Lower
variance across all modalities, methods, and metrics were observed for the rectum, most likely as a result of less volume deformation of the rectum in fractional image guidance compared with the bladder.
While the results of the comparisons against the manually delineated contours were consistent across bladder and rectum, the performance characteristics of the DIR algorithm methods varied. DIR Profile comparison metrics were similar to those of NIB DIR for the rectum, but three of the four calculated metrics indicated substantially improved performance of the NIB DIR for the bladder over the DIR Profile. Such improvement may be derived from the improved applicability of NIB DIR in multi-modality in addition to single-modality
environments. While the shadowed NIB DIR incorporates a manual component that was expected to produce the significantly improved performance characteristics, which it exhibited over the fully automated methods, the comparison against a pure contour-based approach on a large database would provide further insight. Contour-based approaches may prove more similar to shadowed NIB DIR in performance against manual delineation, but shadowed NIB DIR is expected to provide useful characterization of the spatial information in the image that pure contour-based approaches are unable to.
The Linear Mixed Effect statistical model applied to the generated comparison metrics was selected in collaboration with a biostatistician in order to most accurately establish
36
contours they were designed to estimate. The expected modality dependency was identified in many of the metrics derived using the NIB DIR algorithms, while no observed modality
dependency was identified for the DIR Profile contours. The lack of modality dependency for the DIR Profile results suggests that the internal restrictions of the algorithm place stricter limits on the amount of deformation allowed in the result.
The automated contour propagation methods analyzed in this study were compared against manually delineated contours for each fraction. While the contour review by an expert physician may reduce intra-observer variance, the substantial volume of fractions delineated prevented correction for inter-observer variance. Further analysis against consensus-defined contours will be possible as a result of the reduced volume associated with analysis on partial datasets that represent a reasonable approximation of all patient fractions due to the relatively small observed intra-patient metric variance. Screening of image guidance for substantial differences in bladder and rectal filling compared with the planning CT reference could aid in identifying fractions for which automated DIR would prove insufficient.
37
38
REFERENCES
[1] American Cancer Society, "Cancer Facts and Figures 2016," Atlanta 2016. [2] A. Dal Pra and L. Souhami, "Prostate cancer radiation therapy: A physician's perspective," (in ENG), Phys Med, vol. 32, no. 3, pp. 438-45, Mar 2016.
[3] M. R. Cooperberg, J. M. Broering, and P. R. Carroll, "Time trends and local variation in primary treatment of localized prostate cancer," (in ENG), J Clin Oncol, vol. 28, no. 7, pp. 1117-23, Mar 2010.
[4] J. Boda-Heggemann, F. Lohr, F. Wenz, M. Flentje, and M. Guckenberger, "kV cone-beam CT-based IGRT: a clinical review," (in ENG), Strahlenther Onkol, vol. 187, no. 5, pp. 284-91, May 2011.
[5] T. Bortfeld, A. L. Boyer, W. Schlegel, D. L. Kahler, and T. J. Waldron, "Realization and verification of three-dimensional conformal radiotherapy with modulated fields," (in ENG), Int J Radiat Oncol Biol Phys, vol. 30, no. 4, pp. 899-908, Nov 1994.
[6] A. Brahme, "Biologically optimized 3-dimensional in vivo predictive assay-based radiation therapy using positron emission tomography-computerized tomography imaging," (in ENG), Acta Oncol, vol. 42, no. 2, pp. 123-36, 2003.
[7] S. Janek, R. Svensson, I. Gudowska, and A. Brahme, "Adaptive and image guided RT "
Radiother Oncol, vol. 73, p. S223, 2004.
[8] P. Mavroidis et al., "Assessing the difference between planned and delivered intensity-modulated radiotherapy dose distributions based on radiobiological measures," (in ENG), Clin Oncol (R Coll Radiol), vol. 18, no. 7, pp. 529-38, Sep 2006.
[9] U. J, J. S, and S. R, "3D dose distribution in tissue calculated based on PET-CT imaging for high energy scanned photon beams," Radiother Oncol, vol. 73, p. S232, 2004.
[10] C. Veiga et al., "Toward adaptive radiotherapy for head and neck patients: Feasibility study on using CT-to-CBCT deformable registration for "dose of the day" calculations," (in ENG), Med Phys, vol. 41, no. 3, p. 031703, Mar 2014.
[11] C. S. Hamilton and M. A. Ebert, "Volumetric uncertainty in radiotherapy," (in ENG),
Clin Oncol (R Coll Radiol), vol. 17, no. 6, pp. 456-64, Sep 2005.
[12] J. M. Kapatoes, G. H. Olivera, K. J. Ruchala, and T. R. Mackie, "On the verification of the incident energy fluence in tomotherapy IMRT," (in ENG), Phys Med Biol, vol. 46, no. 11, pp. 2953-65, Nov 2001.
[13] J. M. Kapatoes, G. H. Olivera, K. J. Ruchala, J. B. Smilowitz, P. J. Reckwerdt, and T. R. Mackie, "A feasible method for clinical delivery verification and dose reconstruction in
39
[14] D. A. Low et al., "Quantitative dosimetric verification of an IMRT planning and delivery system," (in ENG), Radiother Oncol, vol. 49, no. 3, pp. 305-16, Dec 1998.
[15] A. E. Lujan, J. M. Balter, and R. K. Ten Haken, "A method for incorporating organ motion due to breathing into 3D dose calculations in the liver: sensitivity to variations in motion," (in ENG), Med Phys, vol. 30, no. 10, pp. 2643-9, Oct 2003.
[16] P. N, Y. Y, P. J, and R. V, "The impact of daily patient setup error and tissue
inhomogeneity on PTV coverage and OAR avoidance using IMRT " Medical Physics, vol. 29, p. 1286, 2002.
[17] Webb, Steve. Intensity-modulated radiation therapy. Bristol: IOP Publishing, 2000. [18] F. Liu, E. Ahunbay, C. Lawton, and X.A. Li, “Assessment and management of interfractional variations in daily diagnostic-quality-CT guided prostate-bed irradiation after prostatectomy,” Med Phys, vol. 41, no 3, pp. 031710-1-7, March 2014.
[19] L.E. Court et al., “An off-line strategy for constructing a patient-specific planning target
volume in adaptive treatment process for prostate cancer,” Int J Radiat Oncol Biol Phys, vol. 62, pp. 154-163, 2005.
[20] E.E. Ahunbay et al., “An on-line re-planning scheme for inter-fractional variations,” Med Phys vol 35, pp. 3607-3615, 2008.
[21] E.E. Ahunbay et al., “An Online adaptive replanning method for prostate radiotherapy,” Int J Radiat Oncol Biol Phys vol 77, pp. 1561-1572, 2010.
[22] Takayama Y et al., “Evaluation of the performance of deformable image registration
40
CHAPTER 4: DOSE DELIVERY ACCURACY AND ITS DEPENDENCE ON
DEFORMABLE IMAGE REGISTRATION
Introduction
IGRT utilizes fractional image guidance to improve the agreement between the treatment plan and the dose delivered to the patient throughout the course of the treatment.1,2 Due to the steep dose fall-off, which is a characteristic feature of the IMRT and VMAT techniques aiming to spare the OARs, strict inverse treatment planning is required.3-10 Inter-fractional deviations in dose delivery are unavoidable in the current treatment process due to changes in bladder and rectal filling, changes to tumor size and internal organ deformation.1,2,11 DIR has been used to remap each day’s dose from the fractional CBCT, to the pCT, utilizing algorithms to warp doses to a reference geometry and allowing comparison of DVHs.1,2,7,12,13 In order for IGRT to be most accurate, the specific anatomy to which each fraction of treatment was administered has to be considered.
41
Geometric uncertainty in radiotherapy relates to inaccuracies in delivering dose
distribution to a specific 3D space.4 The IRCU defines two such sources inaccuracy: patient set-up variation, and organ motion and deformation.24 Patient set-up variation is largely mitigated through image-guided pretreatment patient realignment.16 The greatest challenge in reducing total geometric uncertainty in the future remains correction for organ deformation throughout treatment. Volumetric uncertainty relates to delineation challenges regarding patient anatomy and tumor volume.4 Both geometric and volumetric uncertainty must be overcome in order to accurately accumulate delivered dose based on specific anatomy.
This study aims at examining the impact of imaging modality used for IGRT and DIR algorithms (normalized intensity-based “intensity-based” and hybrid shadowed normalized intensity-based “contour-based” algorithms) in the accuracy of estimating the accumulated from all the fractions delivered dose distribution. Evaluation of dose delivery accumulation based on scaling a subset of fractions aims to estimate the benefit of partial automation in reducing
workload demand while maintaining the improved accuracy of dose accumulation that considers fractional anatomy. Determination of the variation of dose delivered to the OARs during
treatment of prostate cancer is a critical step in assessing the relationship of OAR delivered dose and patient outcome.
Section 4.1 Materials and Methods
Dataset Characterization
20 patients treated for prostate cancer using VMAT/IMRT were selected for this analysis. For the 10 IMRT patients, the CT-on-rails (CTOR) system was used for image guidance,
42
planning CT, fractional image guidance scans, planning contours, and planned dose distributions. The CTOR images consisted of 512 x 512 pixel slices with a field of view (FOV) depth of 50 to 100 pixels and voxel dimensions of 1 mm x 1 mm x 3 mm, while the CBCT images consisted of 512 x 512 pixel slices with a FOV depth of 50 to 100 pixels and voxel dimensions of 0.98 mm x 0.98 mm x 3 mm. A total of 453 fractions across those 20 patients were analyzed using bladder and rectum as the primary OARs.
Manual Fractional Contour Delineation
Image data was imported to MIM version 6.8 beta, a software suite developed by MIM Software, Inc. (Cleveland, OH). For 10 of the patients (5 of the CTOR and 5 of the CBCT groups), the contours of bladder and rectum were manually delineated on each fraction by a radiation oncologist. The remaining 10 patients had manually delineated contours on the first five fractions and weekly thereafter.
Contour Propagation and Image Registration
An initial RIR algorithm was applied on the scans of each fraction using the pCT as reference. Subsequently, a DIR algorithm registered those scans with the pCT for each
43
representation of the data processing procedure is shown in Fig. 4.1. An evaluation of the accuracy of the three DIR algorithms was performed in a prior study. Fig. 4.2 provides an example of the contour propagation and manual delineation procedure. Fig. 4.3 illustrates the results of contour propagation using each of the DIR algorithms.
Fig. 4.1. Dose Accumulation Data Processing Procedure. Graphical representation of the data processing, which was applied to each patient. This flow-chart outlines the stages to accumulate the dose delivered to the OARs throughout treatment.
Dose Accumulation and Dosimetrics Calculation
The deformation vector fields derived from both DIR contour propagation models informed the dose translations between planning CT and image guidance. Fig. 4.4 shows a depiction of the dose translation and accumulation process for a single patient. The planning CT was used as a reference to accumulate dose based on the applied DIR algorithm in daily and weekly accumulation sets. The mean dose, D1cc (dose to the ‘hottest’ 1cc of the organ), and V50
(volume of the organ receiving at least 50Gy) dose metrics were calculated from the DVH of the accumulated doses.
The accumulated dose distributions were compared with the planned doses to the OARs via the mean dose, D1cc, and V50 dose metrics to assess the effects of internal organ deformation,
44
latter case, the weekly delivered doses were scaled to account for the rest fractions of the week. A comparison was performed between the daily and weekly accumulation procedures in order to realize whether there is a relation between the frequency of imaging guidance acquisition and accuracy in accumulated delivered dose estimation.
45
46
Fig. 4.4. Dose Accumulation Model. Graphical representation of the dose registration and accumulation procedure, which was applied on each OAR and DIR algorithm. Image guidance was generated with CBCT for the patients treated on Elekta Versa, and CT-on-rails for the patients treated on the Siemens.
Statistical Analysis
We analyzed difference in metrics (mean dose, D1cc, and V50) between different
algorithms (planned, intensity based, and contour based method) using linear mixed effect (LME) models. Given a metric (e.g., D1cc), modality (CT or CBCT), and location (Bladder or
Rectum), there were up to six values per subject, corresponding to different combinations of accumulation interval (daily or weekly) and algorithms. The observed metric values were
clustered within subjects (patients) and were thus correlated. We employ LME model to account for such correlated data. Specifically, in the LME model, the metric value (e.g., D1cc) was the
47
based). There were two-layer of random effects, accumulation interval and subject, because metric values for different algorithms is clustered in accumulation interval (daily or weekly), and accumulation interval is then clustered in subjects. Difference between any two algorithms was claimed as significant if the corresponding estimated contrast was significantly different from 0 at 2-sided alpha level 0.05, using Tukey’s method to adjust for multiple pairwise comparisons. We use a similar procedure to examine the difference between daily and weekly metric values, except that we treat accumulation interval as a fixed effect, and algorithms (only intensity based or contour based) and subject as the two-layer random effects. LME model analysis was
conducted using SAS 9.4 (SAS Institute Cary, NC).
Section 4.2 Results
Fig. 4.5 displays the delivered dose distributions and OAR contours (propagated via DIR or manually delineated) for two representative patients from each IGRT imaging modality (CT-on-rails and CBCT). Fig. 4.5 illustrates the effects that usually moderate changes in internal
48
are plotted, which are based on daily and weekly dose accumulation using the contour-based NIB DIR. Fig. 4.8 displays the same information for the intensity-based NIB DIR.
Fig. 4.5. Isodose Overlay. Axial slices illustrating bladder, rectum and isodose lines from two representative patients with different IGRT imaging modalities CT-on-rails (left) and Cone Beam CT (right). In the upper panel, the planning CT is shown. In the lower panel, the IGRT images are shown with the shifted dose distributions overlaid. In the IGRT images there are three sets of contours for bladder and rectum, the manually drawn (yellow), the intensity-based DIR (light blue) and the contour-based DIR (orange).
49
Fig. 4.6. Accumulated Dose Volume Histograms by Modality. DVHs of two representative patients with different IGRT imaging modalities: CT-on-rails (left) and Cone Beam CT (right). In each plot, the DVHs of bladder and rectum from the original plan, accumulated from all the fractions using the intensity-based deformable image registration (DIR) algorithm and accumulated from all the fractions using the contour-based deformable image registration (DIR) algorithm are shown. The solid lines refer to bladder and the dashed lines to rectum.
50
Fig. 4.8. Intensity-based Dose Volume Histograms by Accumulation Interval. DVHs of two representative patients with different IGRT imaging modalities: CT-on-rails (left) and Cone Beam CT (right). In each plot, the DVHs of bladder and rectum from the original plan, accumulated from all the fractions the using intensity-based deformable image registration (DIR) algorithm and the accumulated from weekly fractions using intensity-based deformable image registration (DIR) algorithm are shown. The solid lines refer to bladder and the dashed lines to rectum.
Table 4.1 displays the dose metrics of mean dose, D1cc, and V50 for bladder and rectum
for all the CTOR patients, while Table 4.2 displays the values of the same metrics for all the CBCT patients. In general, those metrics indicate close agreement of each accumulation method with the planned dose delivery. However, in individual patients large deviations are also
observed.
51
indicating that variation of accumulated dose delivery compared to the planned dose delivery largely results from volumetric uncertainties in delineation of specific anatomy than with the geometric uncertainties of dose delivery or drastic changes to organ filling on a specific treatment fraction.